Question 10 · Education
Are more people learning to read?
In two centuries the share of adults who can read and write has risen from one in eight to seven in eight. That is one of the great quiet victories of the modern age. It is also only a doorway: a quarter of adolescents never finish lower secondary school, seventy million primary-age children never start, and one in five young people is in no school and no job.
In 1820 roughly one adult in eight could read. Two centuries later about seven in eight can. That rise is one of the longest runs of improvement in any social indicator we can measure, and it happened without a single blueprint. Compulsory schooling, the fall of child labor, the spread of printing, and the quiet decision of millions of parents to send a daughter as well as a son to class all pushed the same direction.
But the top of the curve is not the end of the story. Literacy is only the threshold; it says nothing about how many years a child stays in school, what she learns, or whether the credential leads to work. The global figure also flattens as it approaches the ceiling, not because the world has stopped trying but because the remaining gap is concentrated in the places with the least money, the weakest schools, and the most disruption. More than half a billion adults still cannot read. Seventy-one million primary-age children are out of school. One young person in five is neither learning nor earning.
This article follows the question from the world line down to the region and the single country, then past the doorway into years of schooling, completion, the missing children, the money spent, and the young adults who leave school and find nothing waiting. The answer is not one verdict. It is two: a historic expansion, and a long list of rooms still to build.
you read
- Literacy is a low bar. The standard definition is the ability to read and write a simple statement. Passing it does not mean a person can handle a form, follow a textbook, or use a digital device. This article keeps that distinction in view: literacy is the threshold, not the house.
- The numbers are partly modelled. The World Bank and UNESCO fill gaps between surveys with modelled estimates, and the last few years are nowcasts rather than fresh counts. The direction is solid; the final decimal is not.
- Averages hide the place you live. Global literacy says almost nothing about a child in Chad or South Sudan. Wherever the data allow, this piece drops from the world line to the region and to the single country.
- Schooling is not learning. We do not have a freely redistributable, globally comparable measure of whether children are actually learning in class. PISA, TIMSS and the World Bank’s learning-poverty data are cited link-only; the evidence that exists says the learning crisis is real, but this piece does not put a global number on it.
evidence
Every window measures the same climb from a different distance. From 1820 the share of literate adults rose more than sevenfold, a transformation that reshapes what a society can do. From 1950 it doubled in a single lifetime. From 2000 the slope gentles, and in the most recent years the world figure moves by tenths of a point. The direction is still toward more readers; the speed, and the geography of who is left behind, is now the story.
The signals pull in different directions. Youth literacy has reached ninety-three percent, mean years of schooling have risen by three years since 1985, and the count of out-of-school primary children has fallen by more than two-fifths. But lower-secondary completion is below eighty percent, seventy-one million children still never start primary school, and one young person in five is detached from both education and work. The headline is a historic rise; the fine print is that the school system still leaks at every joint, and the leak is largest where the need is greatest.
1 of 4 signals point to deterioration · 3 toward progress
Stand beside a girl in Niger who signs her name for the first time and the gain is everything. Stand with her five years later, when she leaves school and finds no work, and the same statistic looks like a door that opened only halfway.
the lived now
Stand beside a girl in Niger who signs her name for the first time and the gain is everything. Stand with her five years later, when she leaves school and finds no work, and the same statistic looks like a door that opened only halfway.
Has the world really learned to read?
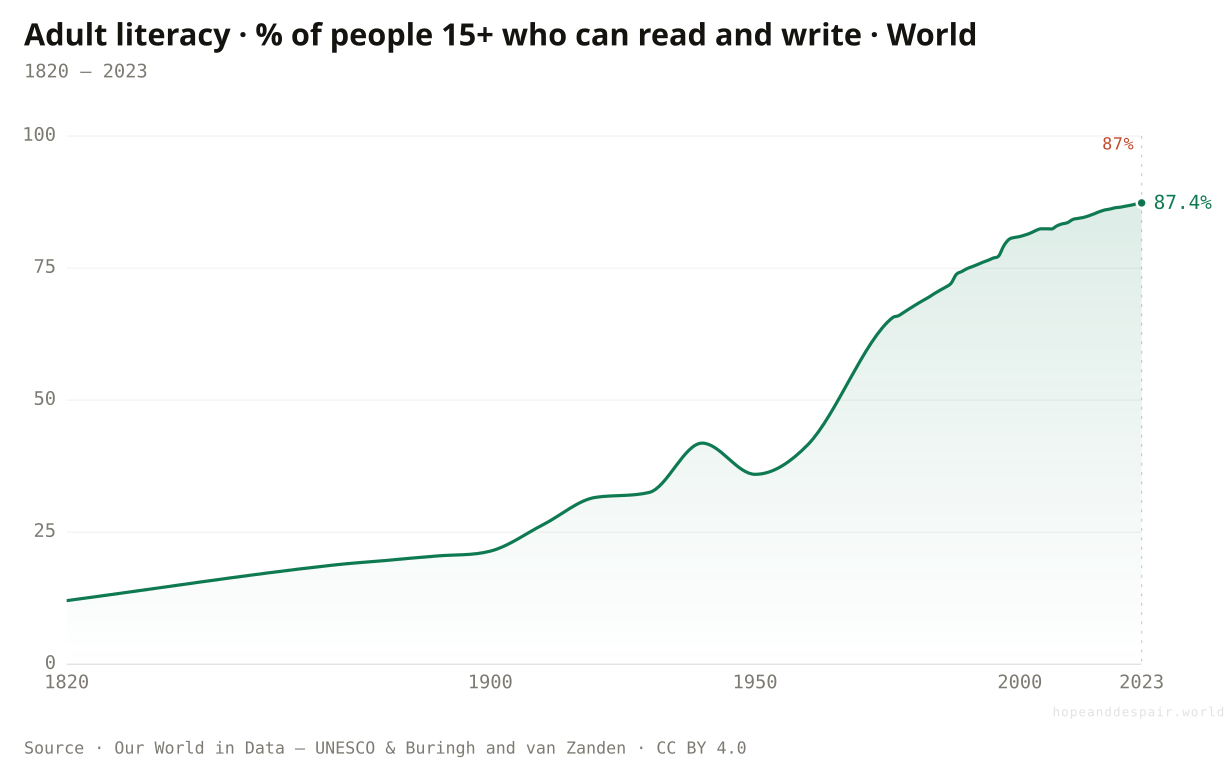
Yes. In two centuries the share of adults who can read and write has risen from about one in eight to about seven in eight.
Strip the question to its plain meaning and the answer is unmistakable. In 1820 only about twelve percent of adults worldwide could read and write. By 1950 that share had roughly quadrupled; by the start of this century it had passed four-fifths; and by 2023 it stood at about eighty-seven percent. No other measure of human capability has risen so far for so long.
The climb is not the work of a single reform. Schools spread into villages. Laws pulled children out of fields and mills. Governments began to tax and spend on public education. Parents, especially mothers who had themselves been denied school, chose to send their children further. The deepest force may be the simplest: once literacy becomes common, illiteracy becomes expensive — in daily life, in health choices, in the labor market.
But a line that climbs this long also hides its own endgame. The first seventy-five percentage points were the easiest: they came from building schools where none existed and enrolling children who had never attended. The last thirteen points are the hardest because the remaining illiterate adults are older, poorer, more likely to be women, and concentrated in countries that have not yet built the schools, the safety nets, and the jobs that make sending every child to class the obvious choice. The world average is no longer the right place to read the story.
How this number was made
What it measures. Share of adults who can read and write a simple statement about their everyday life.
Calculation. Selected entity World.
The displayed line is monotone-cubic smoothed for legibility only — it never moves a data point.
The spread of literacy is one of the quietest and most durable gains in human history; most people alive now can read, a condition that was unimaginable two centuries ago.
The last stretch is the hardest: the remaining illiterate adults are the oldest, poorest, and hardest to reach, and the global line is flattening.
The first three-quarters of the rise and the last eighth are not the same problem; the world solved the easy part first.
Are the young more literate than their parents?
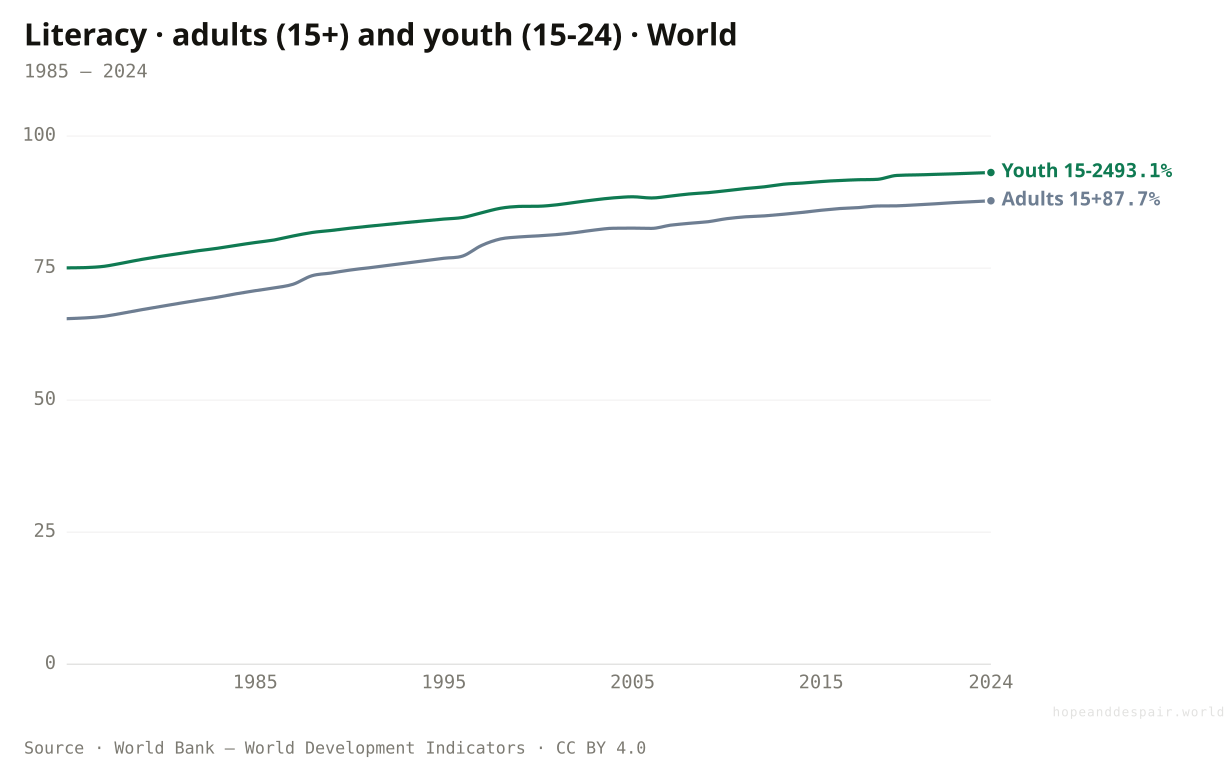
World youth literacy is now about six percentage points above adult literacy, because the rise is generational.
The gain is driven by what happens to children, and children are almost always more literate than the adults around them. In 2024 about ninety-three percent of fifteen- to twenty-four-year-olds could read and write, against about eighty-eight percent of all adults. That five- or six-point gap is the memory of older generations who missed school.
The gap is one of the cleanest signs that the world is still moving in the right direction. A youth literacy rate above ninety percent means that, globally, illiteracy is becoming an old-age condition. But it also means the headline adult figure rises only as the older, less-schooled cohorts age out. The speed of the world average now depends partly on demography, not just classrooms. A country can have youth literacy near universal and still carry a large stock of illiterate adults for decades.
The gap is also where gender shows up most clearly. In many countries older women were far less likely to be schooled than older men, so the youth-adult gap is wider for women. That young women have nearly caught young men in most places is one of the most consequential changes in the data, even if it does not show in the overall number.
How this number was made
What it measures. Literacy rate, adult total (% of people ages 15 and above)
Calculation. Selected entity WLD.
The displayed line is monotone-cubic smoothed for legibility only — it never moves a data point.
The young are ahead of the old almost everywhere, which means the world is still producing more readers than it is losing.
The adult figure is held down by older cohorts, so the people who most need literacy in daily life — working-age adults — improve more slowly than the school numbers suggest.
A high youth literacy rate can hide a large stock of illiterate adults; the generation gap is good news and a lag at the same time.
Where is literacy still failing?
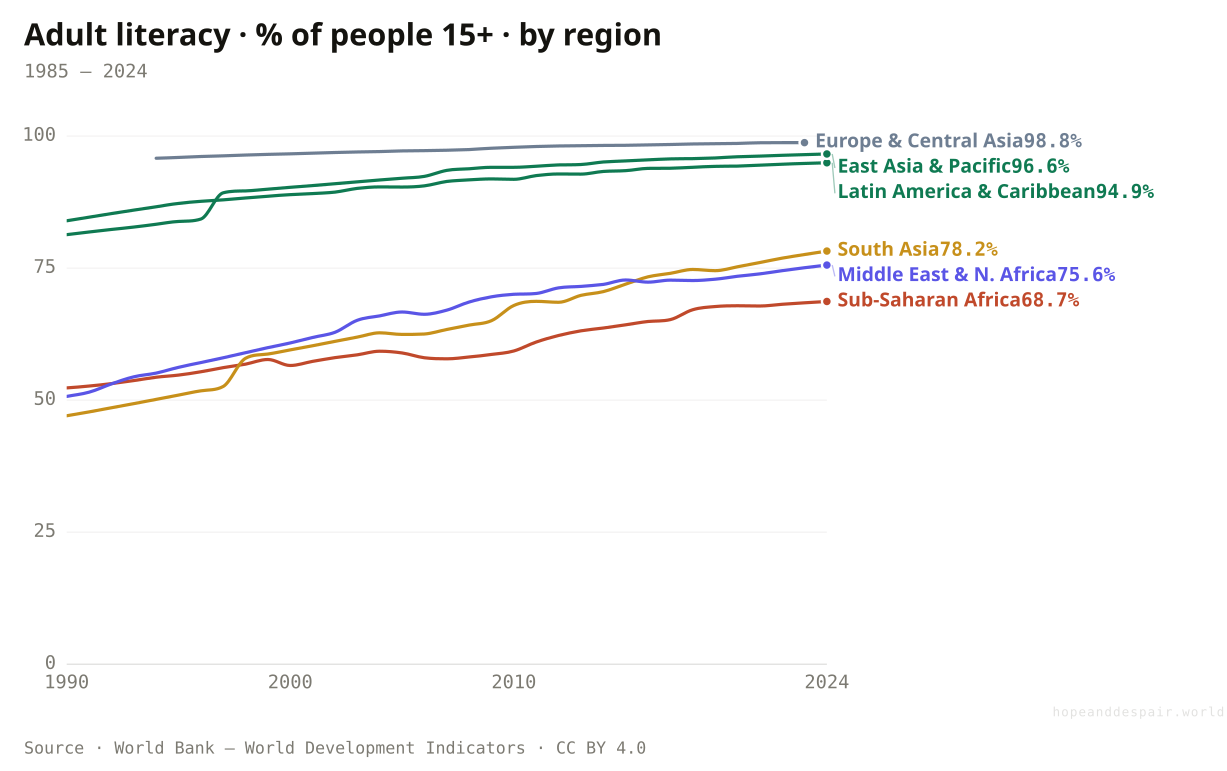
Sub-Saharan Africa is the outlier: fewer than seven in ten adults can read and write, against almost everyone in Europe and Central Asia.
The world line is a blend of two different planets. In Europe and Central Asia adult literacy is about ninety-nine percent; in East Asia and the Pacific about ninety-seven; in Latin America and the Caribbean about ninety-five. South Asia is at about seventy-eight, the Middle East and North Africa at about seventy-six, and Sub-Saharan Africa at about sixty-nine. The same global figure covers both a region that has all but finished and a region where nearly one adult in three still cannot read.
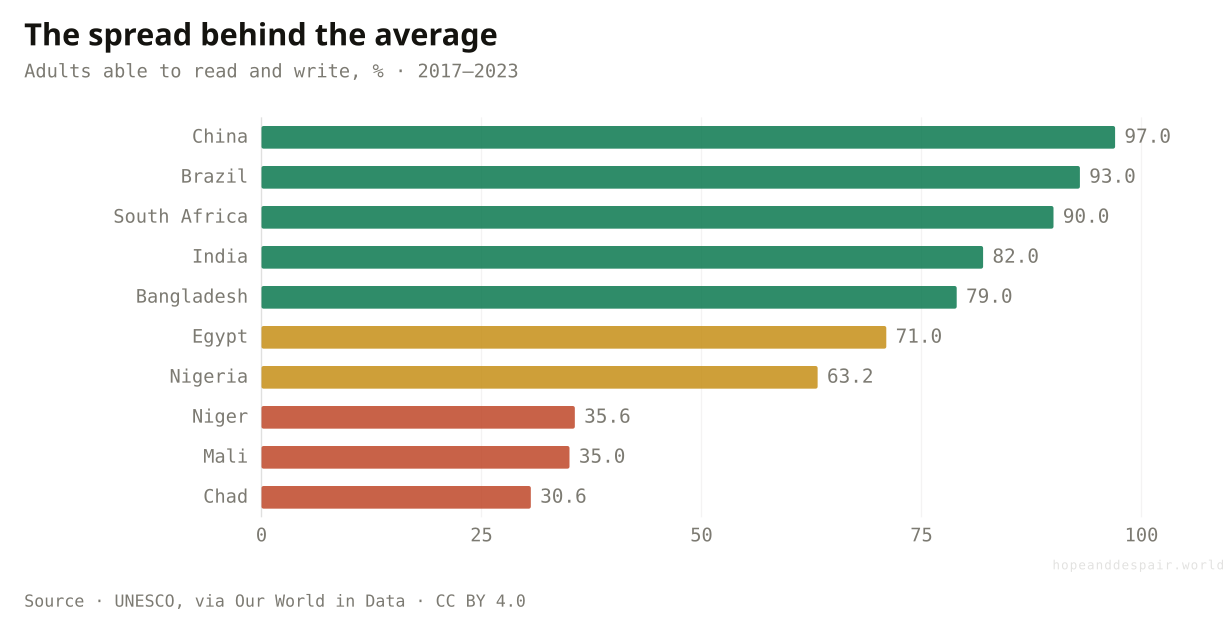
The spread within regions is just as wide. India is at about eighty-two percent and Bangladesh at seventy-nine, while next-door Pakistan is lower still. Nigeria is at sixty-three percent; South Africa at ninety. Chad, Mali and Niger sit near thirty percent. National income, school capacity, conflict, and the schooling of girls all pull in the same direction: where they fail together, literacy fails badly.
A child born in Chad is more than three times as likely to grow up illiterate as one born in Nigeria, and Nigeria is already among the worst large countries. The average is not wrong, but it is almost useless for asking where the problem lives.
How this number was made
What it measures. Literacy rate, adult total (% of people ages 15 and above)
Calculation. Selected entity SSF.
The displayed line is monotone-cubic smoothed for legibility only — it never moves a data point.
Adult literacy, latest available year: Chad 31%, Mali 35%, Niger 36%, Nigeria 63%, India 82%, Brazil 93%, China 97%.
Most of the world’s regions have pushed adult literacy above ninety percent, and South Asia has made a particularly fast climb from a very low start.
Sub-Saharan Africa is both the lowest and the most populous of the lagging regions; the illiterate population is still concentrated there.
A country can be called 'developing’ while sitting anywhere from thirty to ninety-five percent literacy, so the category hides the only thing that matters.
Is literacy the same as being educated?
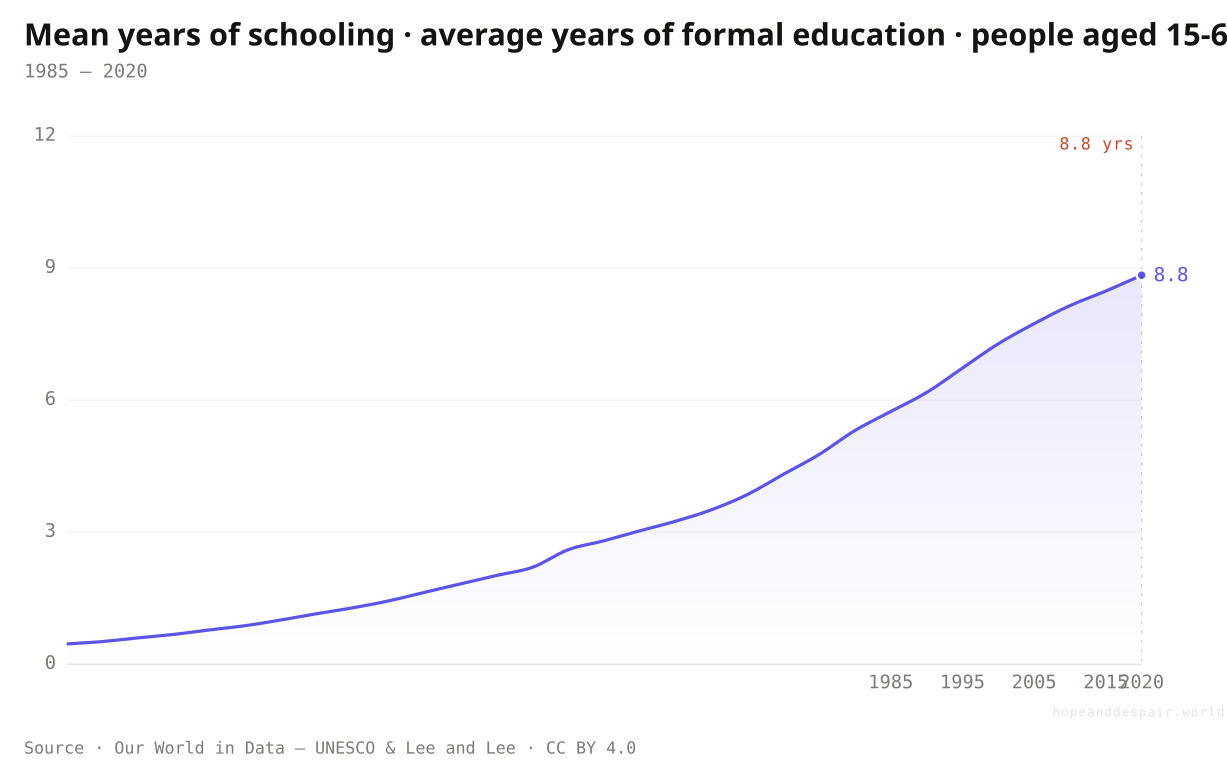
No. The average adult has about 8.8 years of formal schooling, up from 5.7 in 1985, but still short of lower secondary.
Literacy is the first step; the next is how many years a person spends in school. The world average for people aged fifteen to sixty-four is now about 8.8 years, up from 5.7 in 1985. That is a big rise, but it is only a little past the lower-secondary threshold. Half the world’s adults have not completed lower secondary school.
The gap between literacy and schooling matters because a person who can sign a name is not the same as one who can read a manual, fill out a job application, or follow a health leaflet. Years of schooling capture something closer to real skill, and they move more slowly than literacy because they require a child to stay in school, not just to enter it. Literacy gets you through the door; schooling determines which room you reach.
The average also hides a steep gradient. In the richest countries mean schooling is above twelve years; in the poorest it can be below five. The world has done the first part of the job, getting most children through the door. It is still building the rooms beyond it.
How this number was made
What it measures. Average years of formal education for individuals aged 15-64.
Calculation. Selected entity World.
The displayed line is monotone-cubic smoothed for legibility only — it never moves a data point.
The average adult has three more years of schooling than in 1985, and that extra time is where reading turns into reasoning.
8.8 years is still short of lower secondary for the average person; millions leave school before they can read fluently enough to use it.
Literacy and schooling are moving in the same direction but at different speeds, which is why both numbers are needed.
How far up the school system do children get?
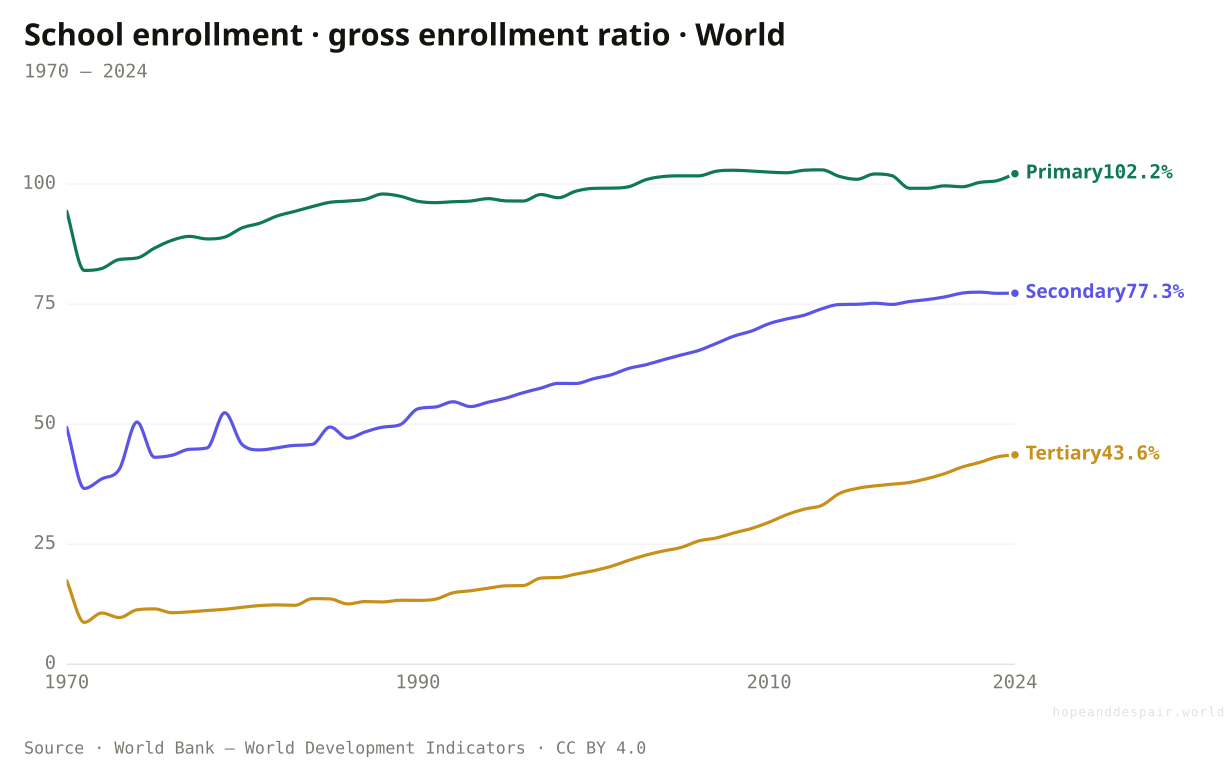
Primary enrollment is near universal, secondary reaches about three in four, and tertiary barely two in five.
Enrollment ratios show the rise in three stages, and each stage is a filter. Primary schooling is now effectively universal, with a gross enrollment ratio of about 102 percent. That figure can exceed one hundred because it includes under- and over-age children; what matters is that almost every primary-age child is enrolled.
Secondary enrollment is lower, at about seventy-seven percent. That drop is where the system begins to leak: the child who starts school does not always continue past the early grades. Tertiary enrollment is lower still, at about forty-four percent, which means higher education remains a minority experience worldwide even though it has more than tripled since 1970.
The ladder is the cleanest summary of educational inequality. Primary is for everyone; tertiary is for some; and the distance between them is income. In rich countries tertiary enrollment is often above eighty percent; in the poorest it is in single digits. The world has built the bottom of the ladder; the top is still being fought over.
How this number was made
What it measures. School enrollment, primary (% gross)
Calculation. Selected entity WLD.
The displayed line is monotone-cubic smoothed for legibility only — it never moves a data point.
The drop from primary to secondary is steepest in Sub-Saharan Africa and South Asia; Europe, Central Asia and East Asia are near or above universal.
Primary school is now the norm almost everywhere, and secondary enrollment has more than doubled in fifty years.
The drop from primary to secondary to tertiary shows that each rung filters out more children, and tertiary is still a privilege.
Enrollment is presence, not learning; a full classroom is a necessary start, not proof that anything is being taught.
Does enrolling mean finishing?
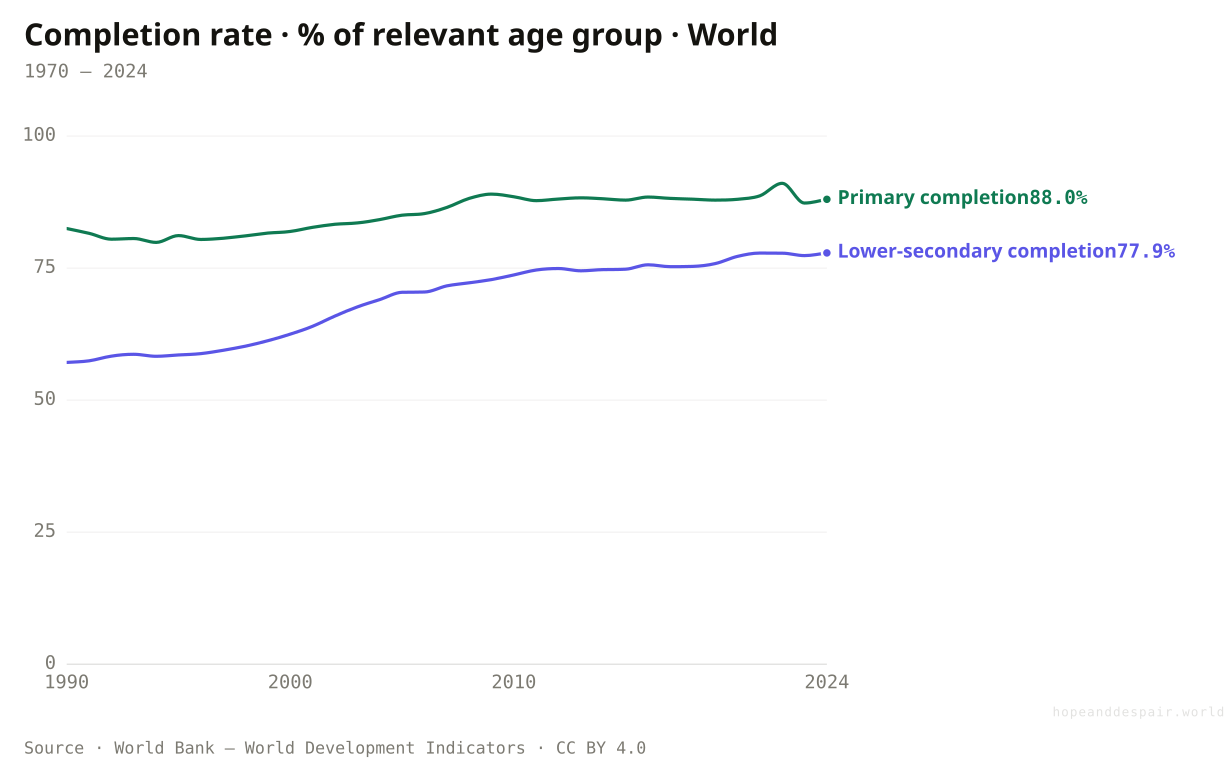
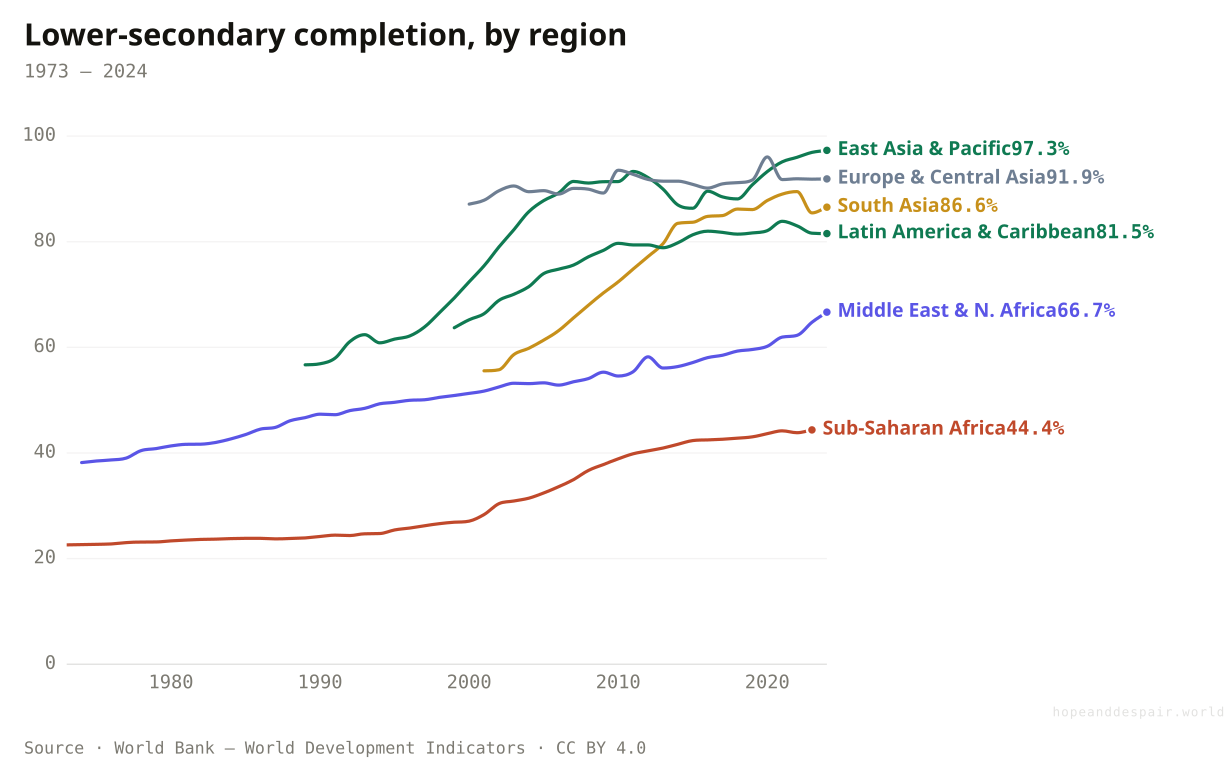
No. Primary completion is about 88%, and lower-secondary completion about 78% — a full rung below enrollment.
Enrollment tells you a child walked through the door; completion tells you they stayed long enough for it to matter. Worldwide, about eighty-eight percent of the relevant age group completes primary school, and about seventy-eight percent completes lower secondary. Those are not bad numbers by historical standards, but they are a long way from universal, and the gap between enrollment and completion is where the system loses its hold.
The reasons are predictable. Poverty pulls children out to work or to care for siblings. Distance matters when the nearest lower-secondary school is hours away. War, displacement, and climate shocks break attendance. Girls drop out when schools lack toilets or when marriage is expected early. Each cause is local, but together they add up to tens of millions of children who start school and leave without the credential.
The regional spread is wide. In East Asia and the Pacific lower-secondary completion is about ninety-seven percent; in Europe and Central Asia about ninety-two; in South Asia about eighty-seven; in Latin America and the Caribbean about eighty-two; in the Middle East and North Africa about sixty-seven; and in Sub-Saharan Africa only about forty-four. The same ladder exists everywhere; the rungs are furthest apart where poverty and instability are deepest.
How this number was made
What it measures. Primary completion rate, total (% of relevant age group)
Calculation. Selected entity WLD.
The displayed line is monotone-cubic smoothed for legibility only — it never moves a data point.
Sub-Saharan Africa finishes fewer than half; Europe, Central Asia and Latin America finish more than four in five.
Most children who start primary school now finish it, which was not true a generation ago.
Lower-secondary completion is below eighty percent worldwide, and in some regions below half; the leak is large.
Enrollment is the number politicians cite; completion is the number that changes a life. They are not the same.
How many children never start?
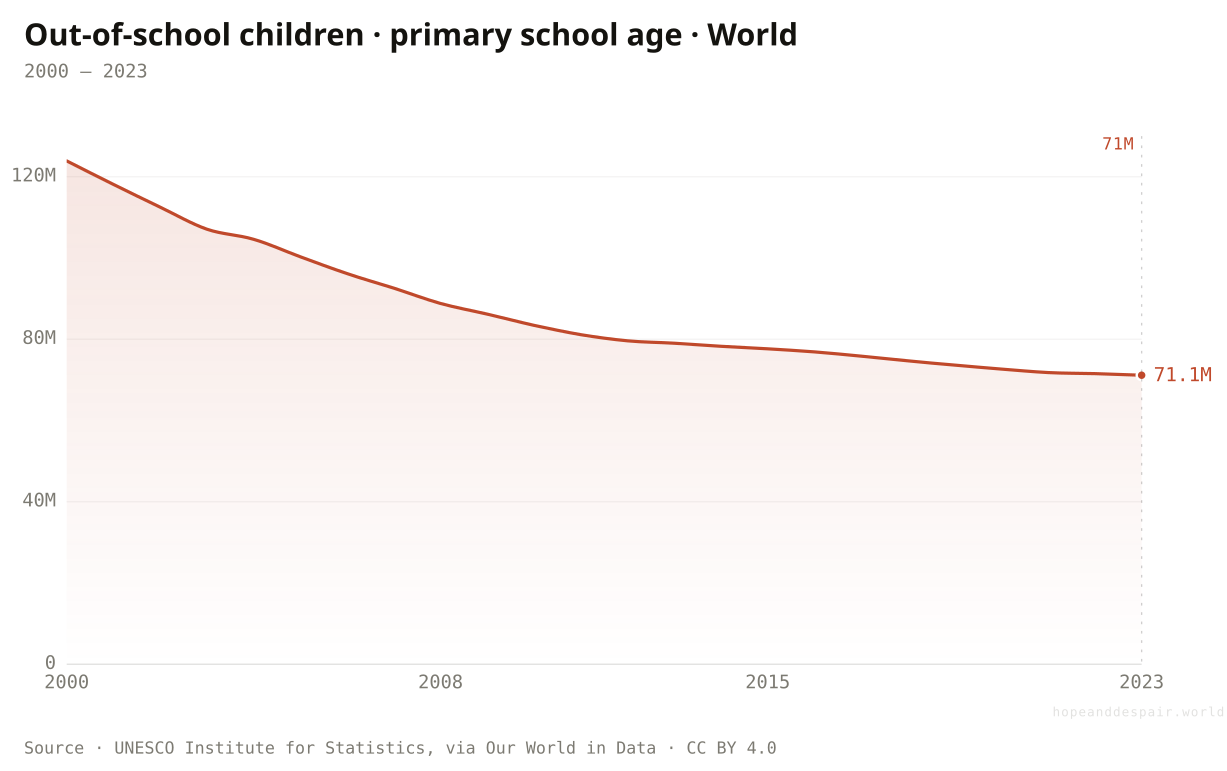
About 71 million primary-age children were out of school in 2023, down from roughly 124 million in 2000.
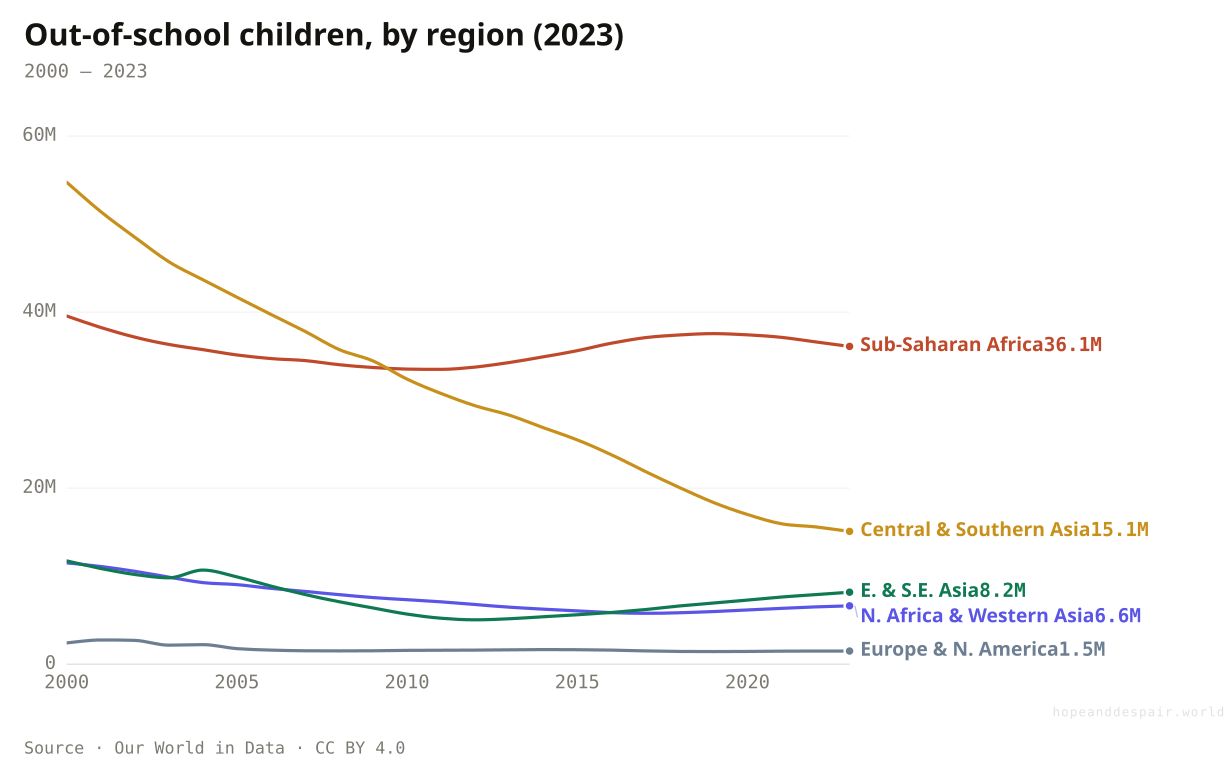
Even in an age of near-universal primary enrollment, the absolute number of excluded children is staggering. In 2023 about seventy-one million children of primary-school age were not in primary or secondary school. That is down from roughly 124 million in 2000, a real improvement, but it still means one in every hundred children on earth is missing the first rung entirely.
The children are not evenly distributed. More than half of all out-of-school children — about thirty-six million — live in Sub-Saharan Africa. Central and Southern Asia accounts for another fifteen million, and Northern Africa and Western Asia for nearly seven million. Eastern and South-Eastern Asia and Europe and Northern America together make up the remainder. The map of exclusion is the same map as poverty, conflict, and weak state capacity.
Within countries the pattern sharpens: girls in rural areas, children with disabilities, and those speaking minority languages are disproportionately absent. In some regions boys are more likely to be out of school; in others, girls. These are not statistical details; they are individual children who will enter adulthood without the tool most of the world now takes for granted.
The fall is also slowing. After a rapid drop in the 2000s, the line has levelled near seventy million. The last few points move by a million or two a year. That is enough to matter to those children, but it is not fast enough to close the gap within a generation. At this pace, the out-of-school population will still be counted in the tens of millions for decades.
How this number was made
What it measures. Children in the official primary school age range who are not enrolled in either primary or secondary education.
Calculation. Selected entity World.
The displayed line is monotone-cubic smoothed for legibility only — it never moves a data point.
Sub-Saharan Africa alone accounts for more than half of all out-of-school children; Europe and Northern America for about one in fifty.
The number has fallen by more than two-fifths since 2000, and the trend is still downward.
Seventy-one million children is a city the size of a large country, and the line is no longer falling quickly.
Out-of-school numbers are counts, not rates, so they also reflect population growth; the rate has improved more than the count.
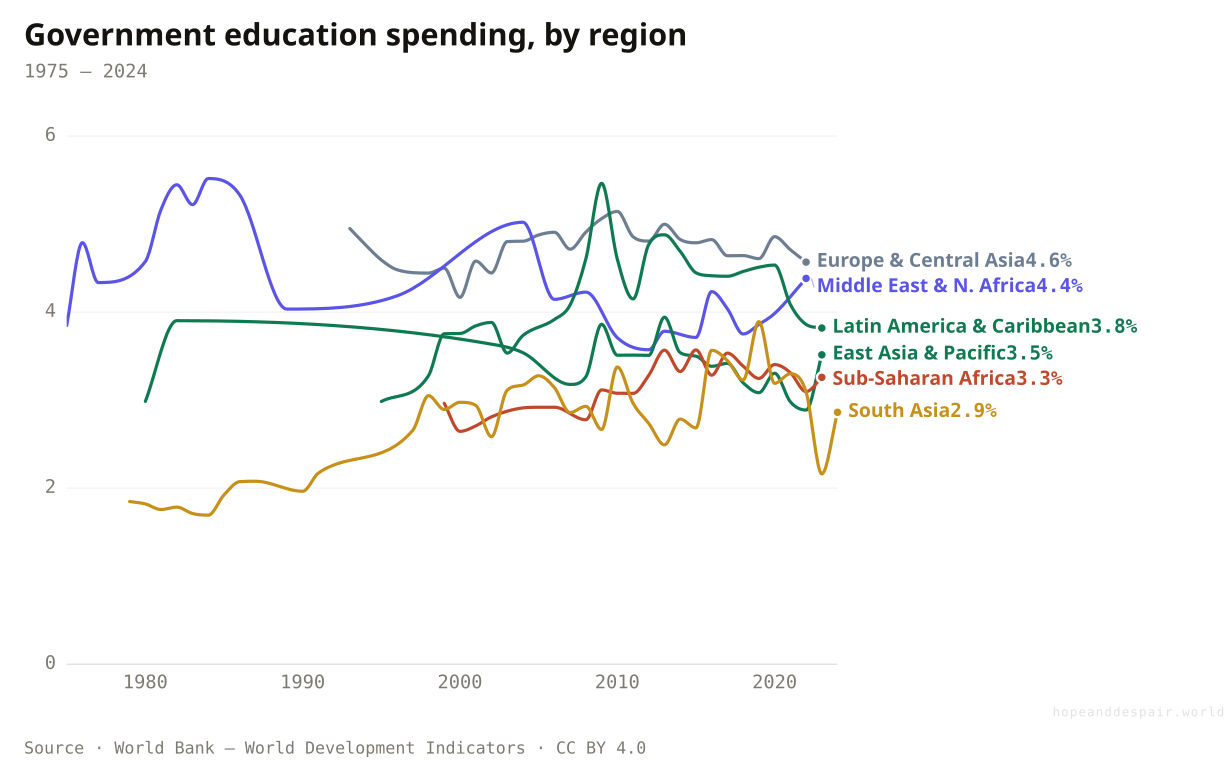
Are governments paying for the school day?
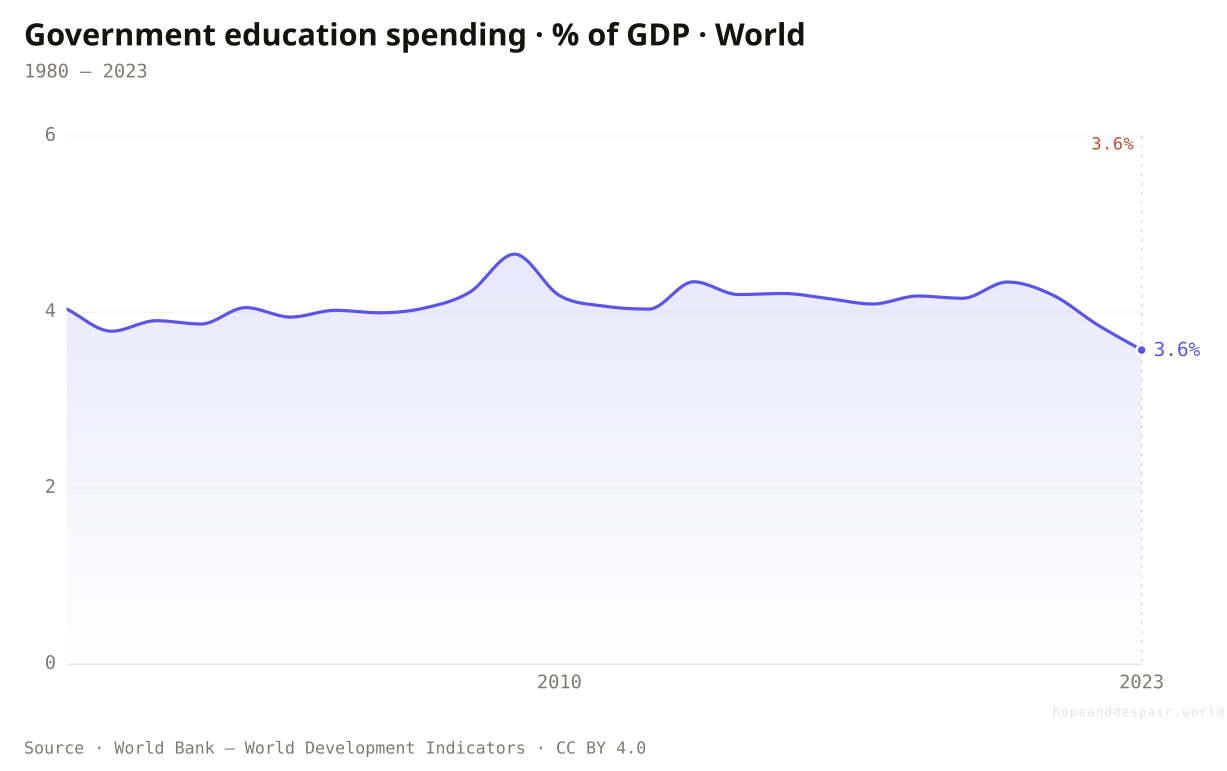
Public education spending has run near 4% of world GDP, but after a pandemic bump it has slipped back toward 3.6%.
Money is not the only thing that makes a school work, but it is hard to run one without it. Worldwide, governments spend about four percent of GDP on education, a figure that has been stable for decades. During the pandemic it rose slightly as economies shrank faster than budgets were cut, but it has since slipped back to about 3.57 percent.
The headline hides a wide spread. Europe and Central Asia spend the most among the major regions, about 4.6 percent of GDP. The Middle East and North Africa follow at roughly 4.4 percent, Latin America and the Caribbean at 3.8 percent, East Asia and the Pacific near the world average, and Sub-Saharan Africa at 3.3 percent. South Asia is lowest, at about 2.9 percent. Those shares measure political effort, not classroom quality; a poor country spending 3 percent of a small GDP cannot afford what a rich country spending the same share can.
Spending as a share of GDP also misses what the money buys: salaries for trained teachers, textbooks, buildings, transport, and support for the poorest children. It says nothing about whether funds reach rural schools or stay in capitals, or about whether teachers show up. Still, the share is a floor. When it falls, the children who need school most feel it first.
The post-COVID dip is worth watching. Education budgets were not the main casualty of the pandemic, but many countries are still under fiscal pressure, and aid for education has been flat. If the world share keeps falling while the learning crisis deepens, the gap between aspiration and capacity will widen.
How this number was made
What it measures. Government expenditure on education, total (% of GDP)
Calculation. Selected entity WLD.
The displayed line is monotone-cubic smoothed for legibility only — it never moves a data point.
Europe and Central Asia devote the largest share of GDP to education; South Asia the smallest, below the world average.
Education spending has been a durable priority for most governments, and the world still devotes about one dollar in twenty-five of public money to it.
The post-COVID fall means the resource base is shrinking just as the learning crisis demands more, not less, investment; South Asia in particular spends well below the world share.
Percent of GDP measures effort, not results; some countries spend little and teach well, others spend much and learn little.
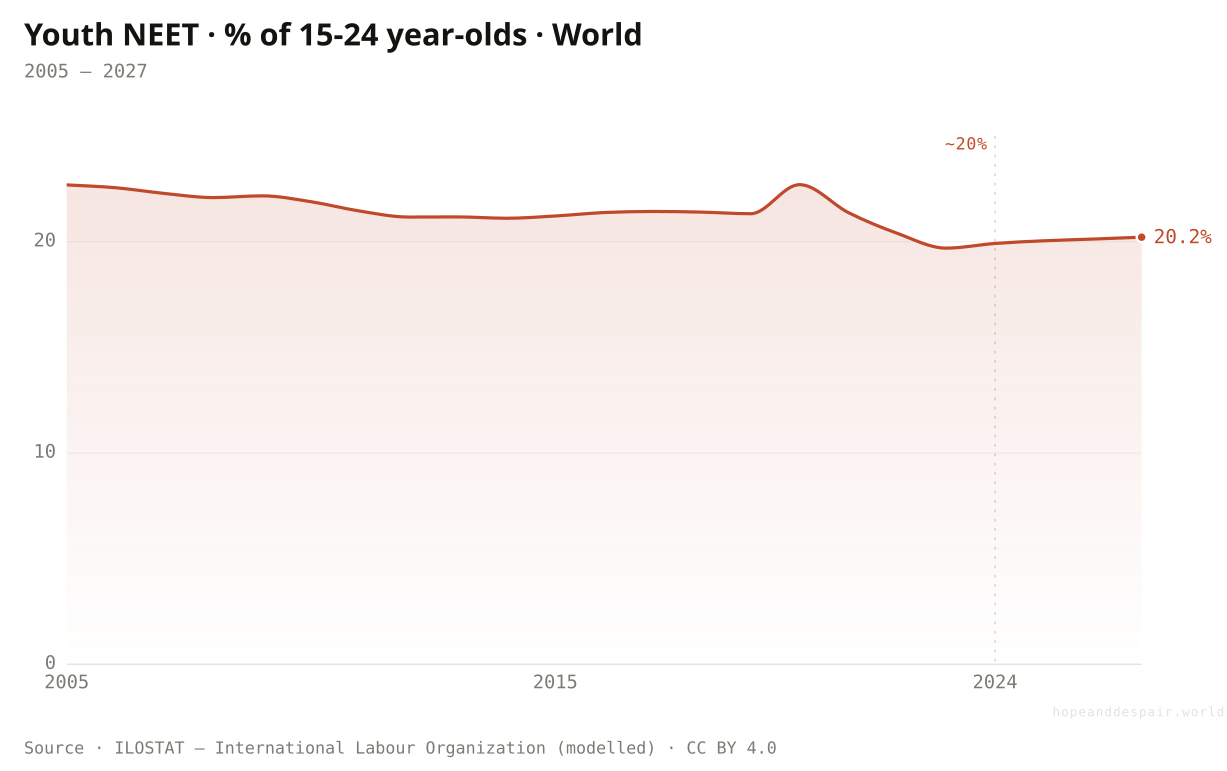
What happens after school?
About one in five young people worldwide are not in employment, education or training — a reminder that schooling does not end the story.
The final measure is not about school at all; it is about the moment school ends. Youth NEET, the share of fifteen- to twenty-four-year-olds who are not in employment, education or training, is about twenty percent worldwide. That means one young person in five is detached from both learning and earning at the age when both matter most.
The figure is not the same as unemployment. Many young NEETs are not looking for work because no work exists, because they are caring for family, or because they have given up. It is a measure of a broken transition from school to adult life. The rate has fallen from the 2005 peak of about twenty-three percent to about twenty percent in 2024, but it remains high, and the modelled projections show it edging up again toward 2027.
Like every other measure here, NEET is concentrated. In most regions young women are more likely to be NEET than young men, often because of household duties. In some poor countries the rate is high not because schools are empty but because jobs are. The lesson is that literacy and even schooling do not guarantee a place in the economy. The school day is only part of the day; the rest of life needs an economy that can use what was learned.
How this number was made
What it measures. Youth not in employment, education or training (NEET), World
Calculation. Selected entity World.
The displayed line is monotone-cubic smoothed for legibility only — it never moves a data point.
The rate is below its 2005 peak, which suggests the transition has improved slightly for the average young person.
One in five young people is neither learning nor earning, and the projections show the rate edging up again.
NEET is partly an education problem and partly a jobs problem; solving it requires both.
Strongest case for hope
Read by the threshold measure and the story is one of the great advances of the modern age. In two centuries literacy moved from a rarity to the normal condition of most adults. Youth literacy is above ninety percent. Primary school is near universal. The gender gap has narrowed almost everywhere, and South Asia has shown that a region can climb from mass illiteracy to near-universal literacy within a single generation. The world has built the first and most important layer of human capital, and it has done it faster than any previous century.
Strongest case for despair
Read by what comes after the threshold and the story is unfinished. Mean years of schooling are still below lower secondary. One child in four does not finish lower secondary. Seventy-one million primary-age children never start. One young person in five is detached from both education and work. And the deepest failures are stacked in the same places: Sub-Saharan Africa, conflict zones, poor rural areas, and girls everywhere that tradition or poverty keeps them home. The world can read, but it has not yet built the school system, the jobs, or the safety nets that make the ability to read worth having.
The verdict would shift if the lagging regions caught up. If Sub-Saharan Africa’s literacy rate rose at South Asia’s recent pace, if out-of-school numbers fell by half within a decade, or if youth NEET dropped below fifteen percent, the despair case would weaken. If global education spending kept falling, if learning outcomes kept declining, or if conflict and displacement pushed more children out of school, the hope case would weaken. The question is less about whether the world can read than about whether it finishes the school day for the children still waiting.
Everything done to the numbers between the source and the chart, disclosed in full. Where a choice is editorial rather than measured, we say so.
- Literacy definitions
- The long-run world series from Our World in Data combines UNESCO estimates with historical reconstruction by Buringh and van Zanden. The World Bank’s adult and youth literacy rates cover people aged 15+ and 15-24 respectively and rely on UNESCO and national census data, with modelled estimates filling gaps.
- Enrollment and completion
- Gross enrollment ratios can exceed 100% because they include under- and over-age students. Completion rates measure the share of the relevant age group that completes the final grade of a cycle, regardless of age. Both come from UNESCO via the World Bank.
- Modelled estimates
- Recent years of the youth NEET series and some World Bank literacy estimates are modelled nowcasts, not direct survey counts. The direction is reliable; the precise last-year figure carries more uncertainty.
- Prose and number audit
- Explanatory text was drafted with the help of a large language model and then checked line by line against the project’s derived data series; every quantitative claim traces to a figure produced by the pipeline (src/data/derived). No outside numbers were introduced.
- Our World in Data — Cross-country literacy rates — ourworldindata.org/grapher/cross-country-literacy-rates ↗ · CC BY 4.0 · vintage 2026-06-21Long-run world literacy and the country cross-section, compiled from UNESCO and Buringh and van Zanden.
- World Bank — World Development Indicators (literacy) — data.worldbank.org/indicator/SE.ADT.LITR.ZS ↗ · CC BY 4.0 · vintage 2026-06-21Adult literacy (15+) and youth literacy (15-24) for the World and the six World Bank regions.
- World Bank — World Development Indicators (education) — data.worldbank.org/indicator/SE.PRM.ENRR ↗ · CC BY 4.0 · vintage 2026-06-21Primary, secondary and tertiary gross enrollment; primary and lower-secondary completion; government education expenditure as % of GDP.
- Our World in Data — Mean years of schooling — ourworldindata.org/grapher/mean-years-of-schooling ↗ · CC BY 4.0 · vintage 2026-06-21Average years of formal education for people aged 15-64, from UNESCO and Lee and Lee.
- Our World in Data — Out-of-school children of primary school age — ourworldindata.org/grapher/out-of-school-children-of-primary-school-age-by-world-region ↗ · CC BY 4.0 · vintage 2026-06-21Children of primary-school age not enrolled in primary or secondary education, from UNESCO.
- ILOSTAT — Youth not in employment, education or training — ilostat.ilo.org ↗ · CC BY 4.0 · vintage 2026-06-21Youth NEET rate (15-24), ILO modelled estimates, via the SDMX API.
Cite this page
Reference
Hope & Despair. “Are more people learning to read?.” Hope & Despair, 2026. https://hopeanddespair.world/questions/are-more-people-learning-to-read.
BibTeX
@misc{hopeanddespair:are-more-people-learning-to-read,
  author       = {{Hope & Despair}},
  title        = {{Are more people learning to read?}},
  year         = {2026},
  howpublished = {\url{https://hopeanddespair.world/questions/are-more-people-learning-to-read}},
  note         = {hopeanddespair.world, updated 2026-06-27}
}
Original prose, code, and chart designs are released under CC BY 4.0 ↗ — reuse freely with attribution. Source datasets keep their own licences, listed above. Add your access date when citing.
- Ship: Can the world create enough jobs? (Q16) + air-pollution and literacy articles View diff →
Generated from the commit history — every edit to a number, a word, or a chart is tracked in the open. Browse the full history & diffs on GitHub →
in plain words