Question 02 · Health
Are we beating disease and death?
The retreat of early death is the best news on Earth, and most people have never heard it. Then the pandemic took a piece of it back — and where you are born still decides whether your child sees five.
you read
- “Disease and death” here is mostly mortality — who dies, of what, and how young — plus a few headline infections. Chronic pain, disability, and mental illness are thinly counted; the absence of dying is not the same as health, and this article keeps tripping over that gap.
- The deep curves — child mortality before 1950, life expectancy before 1900 — are modelled reconstructions (UN IGME, Gapminder, historical demography). Trustworthy in their direction and shape; rough in their exact level.
- Life expectancy at birth is not how long a typical adult lives. It is an average dragged down hard by babies who die, so most of its long rise is fewer infant deaths, not more old age. Said again where it matters below.
- Every section reads at three magnifications — the world line, the regional spread, and named countries — all on real ingested data (UN IGME, the World Bank’s mirror of WHO, UNAIDS, and the UN agencies, CC BY 4.0), with source, data package, and lineage downloadable under each figure. Two series come straight from the WHO Global Health Observatory (healthy life expectancy, premature NCD death); WHO’s licence forbids re-hosting, so those are charted and cited but carry no download. The deep world curve and the regional cuts sometimes use different units (child mortality is per 100 in the long view, per 1,000 by region) — flagged where it matters.
- World averages hide the chasm, which is why no section stops at the global line. A child in Helsinki and a child in Lagos do not live on the same line, and most of this article is the distance between them.
evidence
Zoom out to the centuries and the news is overwhelming: a person born in 1770 could expect under thirty years, and a person born today gets past seventy. Zoom in to 2020 and the line does something it had not done in living memory. It falls. Then, within two years, it climbs back.
Life expectancy fell in 2020 and 2021 for the first time in generations, maternal progress stalled before the pandemic and has barely restarted, and malaria has crept back up since 2019. A cluster of small reversals after decades of one-way traffic.
0 of 4 signals point to deterioration · 4 toward progress
The calm world average says nothing about a delivery room in northern Nigeria, where a birth is hundreds of times more likely to kill the mother than the same birth in Sweden.
the lived now
The calm world average says nothing about a delivery room in northern Nigeria, where a birth is hundreds of times more likely to kill the mother than the same birth in Sweden.
Across the centuries, how many children lived to grow up — and where do they still die?
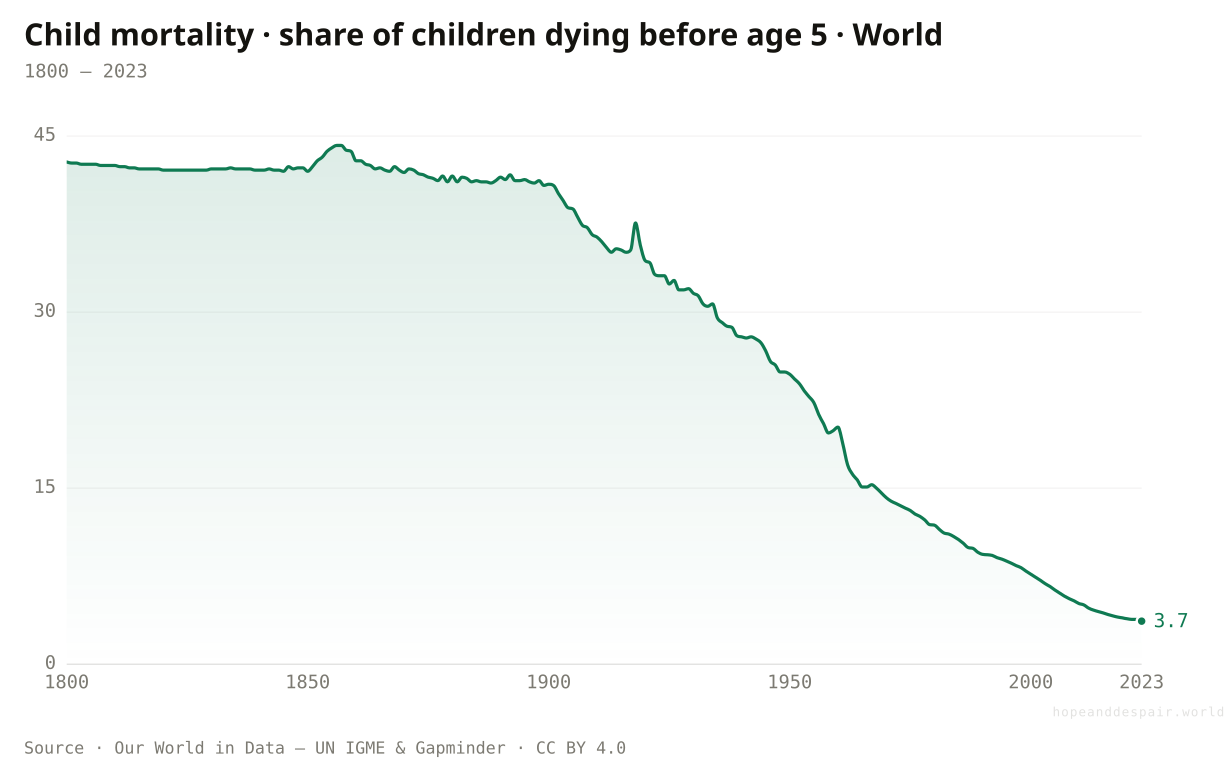
Two centuries ago, nearly half of all children died before five. Now it is under four in a hundred — but where you are born still swings the odds ninefold.
Picture a hundred babies born in the year 1800. Before their fifth birthday, about forty-three of them would be dead. A mother who carried six children to term could expect to bury two or three; burying a child was not a tragedy that befell the unlucky, it was the ordinary texture of a life. Today that number is 3.67 in a hundred and still falling, pulled down by a stack of unglamorous wins: clean water, the germ theory, oral rehydration salts, antibiotics, and above all vaccines.
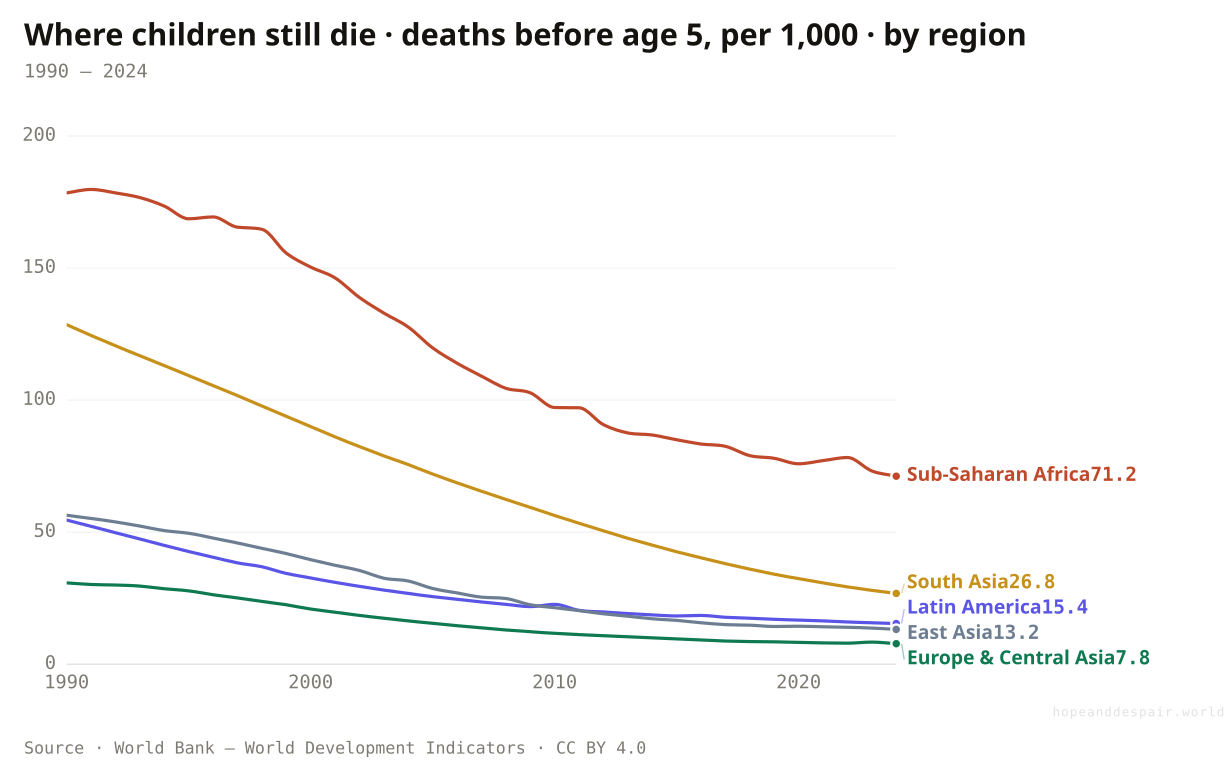
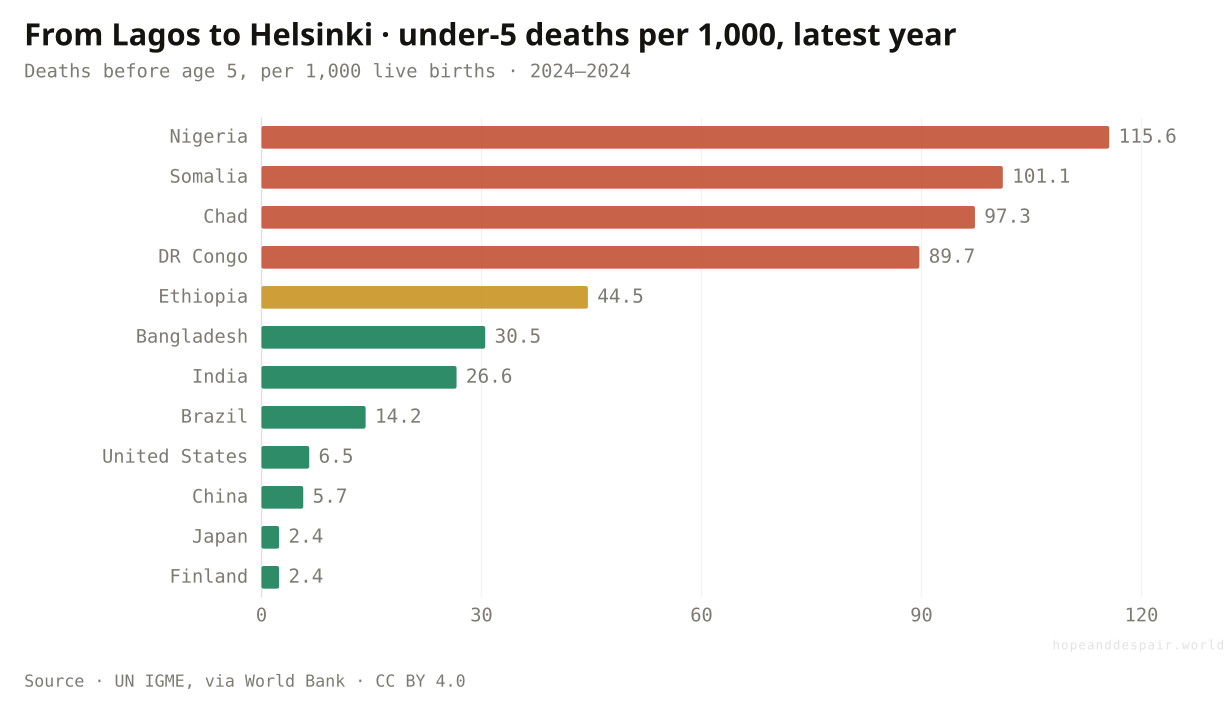
But the world line is an average, and the average is a lie of composition. Split it by region and it splinters into different centuries living at once. In Europe and Central Asia about 8 children in a thousand die before five; in Sub-Saharan Africa it is 71, nine times higher, roughly where the rich world stood in the 1950s. Drop to single countries and the spread widens again: a child in Nigeria is about 48 times more likely to die than a child in Finland or Japan. None of that gap is mystery. It tracks the things that travel with poverty, a clinic an hour away or a day away, a fever treated or not.
The hopeful half is that every one of these lines is falling, and falling fastest where it started highest, so the gap narrows even as it stays wide. The grim half is the level. Of all the lines on this site, the world curve is the one to remember; the regional and country ones are the reminder that the work is unfinished, and exactly where.
How this number was made
What it measures. The long-run estimated share of newborns who die before reaching the age of five.
Calculation. Selected entity World.
The displayed line is monotone-cubic smoothed for legibility only — it never moves a data point.
Where a child is born still swings the odds ninefold: Sub-Saharan Africa loses 71 children per 1,000 before five, against 8 in Europe. But it is a closing gap. South Asia fell from 129 to 27 in a single generation, one of the fastest declines ever recorded, and Africa is on the same path a decade or two behind.
Nigeria buries about 116 children per 1,000; Finland and Japan, fewer than 3. That fortyfold gap is not science the rich world hoards. It is clinics, midwives, and cold chains the poorest places still lack.
The likeliest death our ancestors faced, the death of a small child, has been pushed to the edge of modern life, and is retreating fastest where it was worst.
A ninefold regional gap and a fortyfold country gap mean millions of children still die every year of causes we mastered decades ago.
How much credit goes to medicine versus clean water, food, and simple wealth is genuinely hard to disentangle.
And how long does a single life last — the same everywhere?
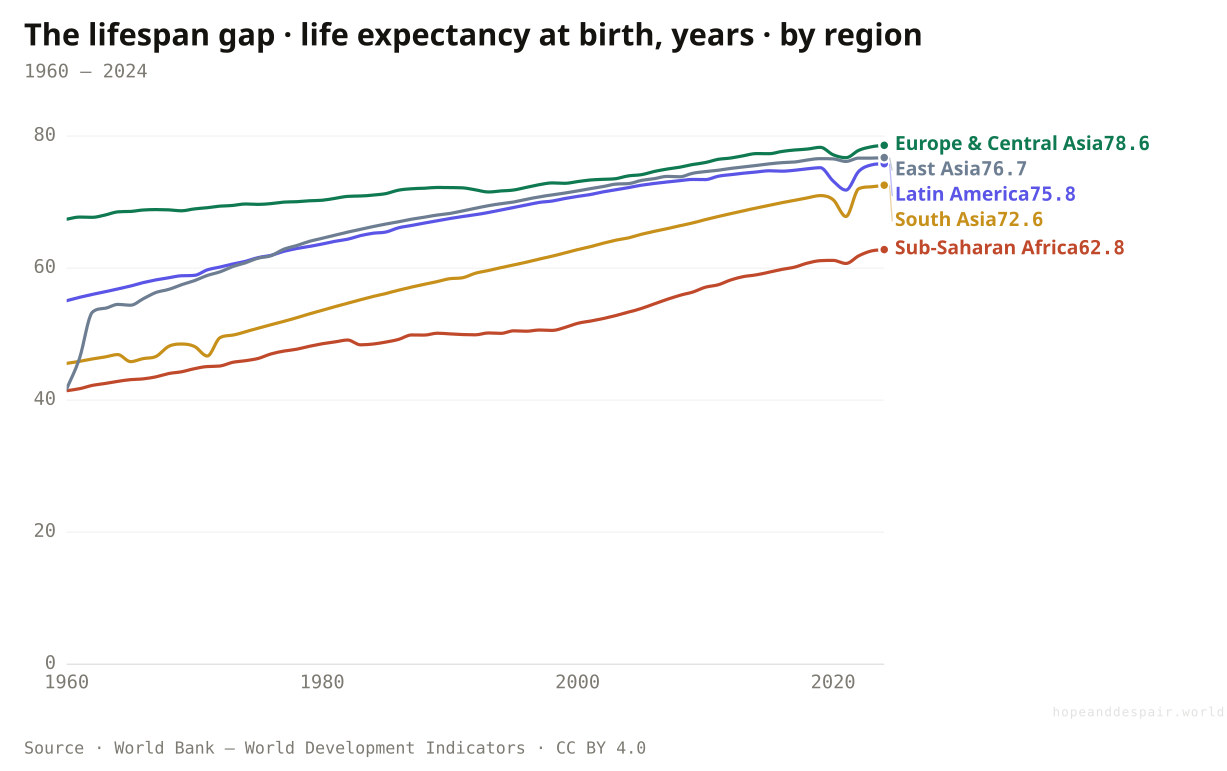
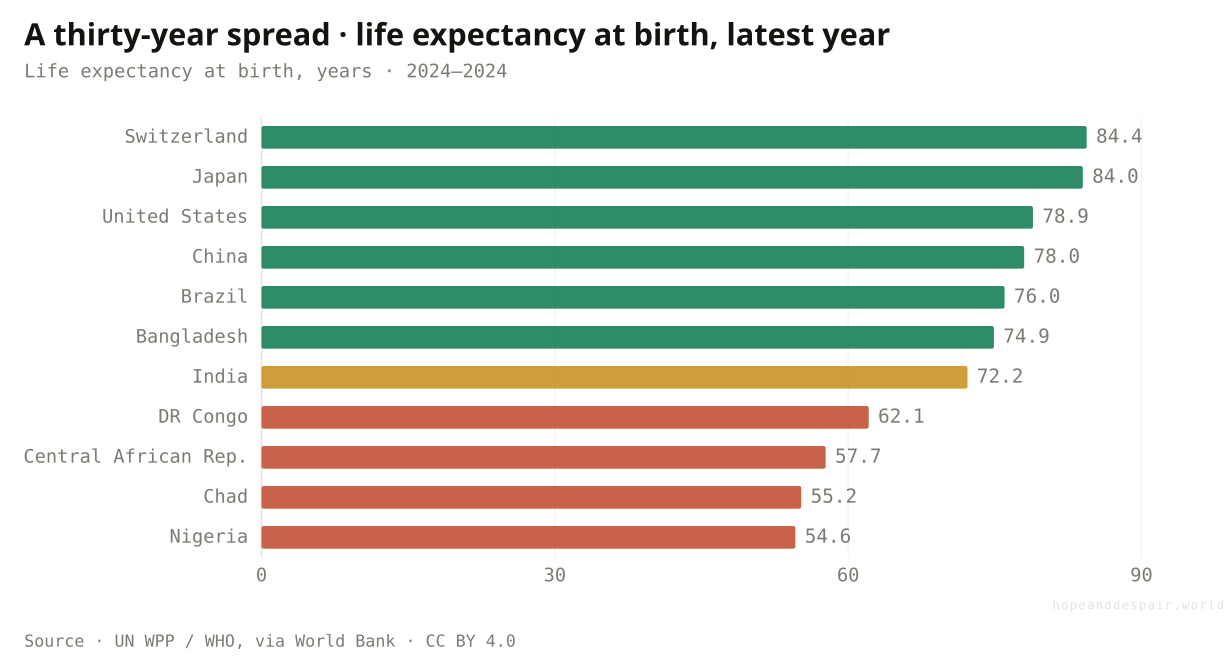
A life lasted under thirty years in 1770; now it lasts past seventy. But a baby in Switzerland is handed thirty years more than one in Nigeria.
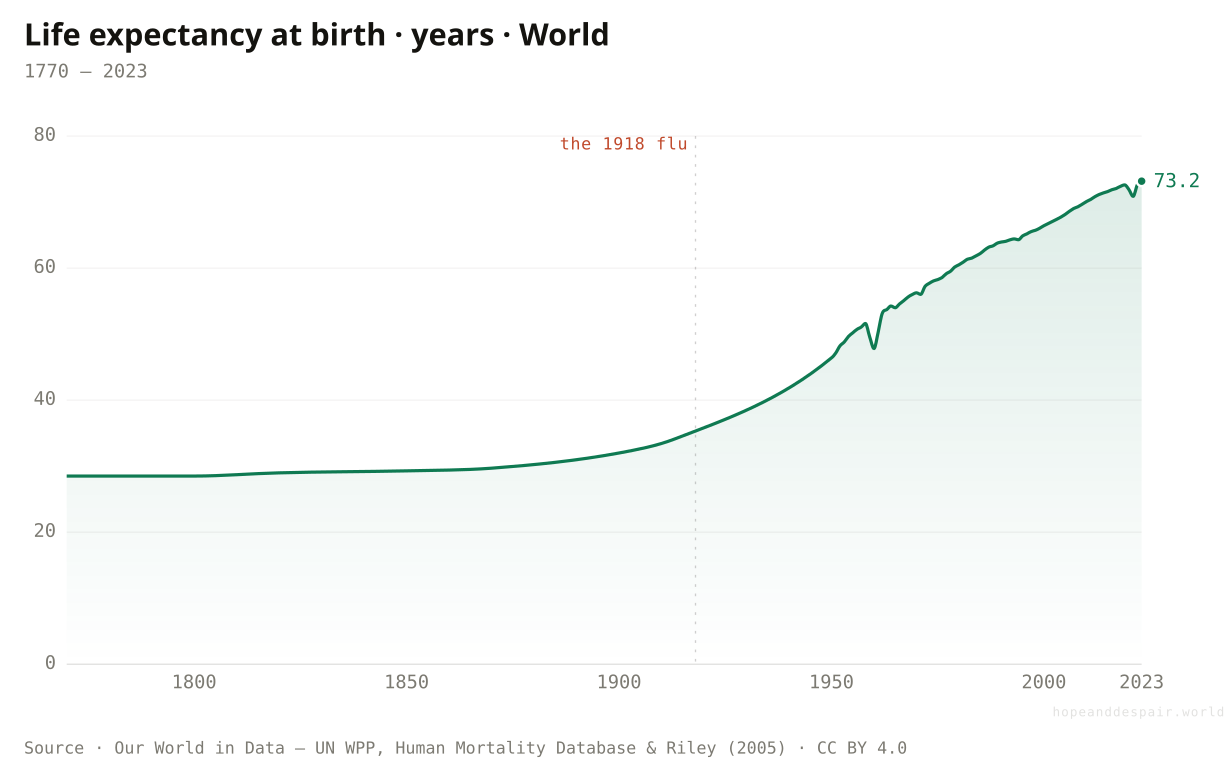
For most of human history the average life ran out before the average person finished being young. Around 1770 a newborn could expect roughly twenty-eight years, and that barely moved for a century. Then, over a few generations, it more than doubled, to 73 today. The catch lives inside the word average: life expectancy at birth is pulled down hard by every baby who dies, so most of that doubling is simply children surviving who once would not have. What changed was less that the old got much older and more that far more people got to grow old at all.
The world figure hides a familiar split. Sub-Saharan Africa sits at about 63 years; Europe and Central Asia at nearly 79, a gap of sixteen years between regions. By country the distance stretches to thirty: Switzerland and Japan clear 84, while Nigeria, Chad, and the Central African Republic sit in the mid-50s, about where Europe was a century ago. The line also remembers its wounds. The deep notch in 1918 is the influenza pandemic, which killed enough young adults to knock years off the world in a single season, a preview of a smaller dip this article reaches later.
How this number was made
What it measures. Period life expectancy is the number of years the average person born in a certain year would live if they experienced the same chances of dying at each age as people did that year.
Calculation. Selected entity World.
The displayed line is monotone-cubic smoothed for legibility only — it never moves a data point.
Sixteen years separate the regions: Europe and Central Asia near 79, Sub-Saharan Africa about 63. Most of that gap is still the very young dying, not the old dying sooner. Every line climbs, and the lowest climbs fastest, so the distance is closing even now.
Switzerland and Japan clear 84 years; Nigeria, Chad, and the Central African Republic sit in the mid-50s. That is roughly where Switzerland itself stood a century ago, a full thirty years apart within one world.
The typical human now gets a second half of life almost none of our ancestors were granted, and the poorest regions are closing on the richest.
A thirty-year gap between the longest- and shortest-lived countries is a gap in whole decades of a single human life.
Because the number is dominated by infant survival, it tells you less about how the old fare than people assume.
Why did the dying stop — and who does the engine still miss?
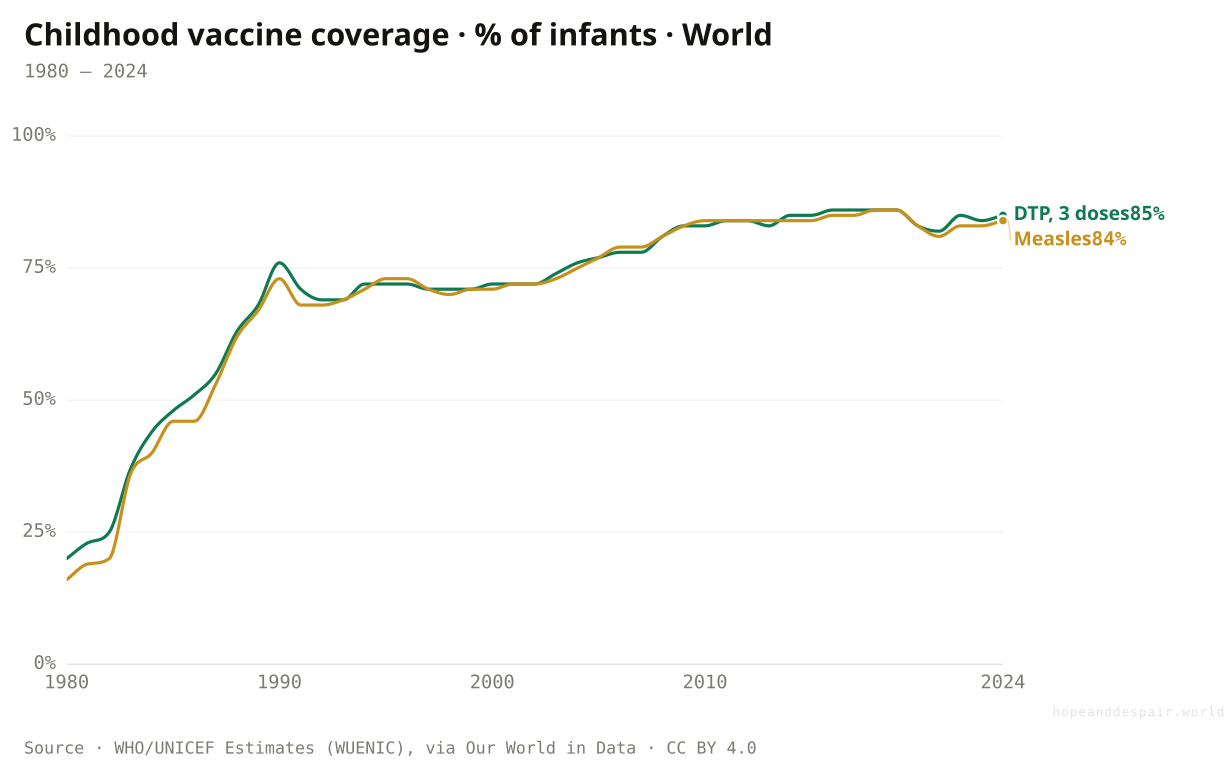
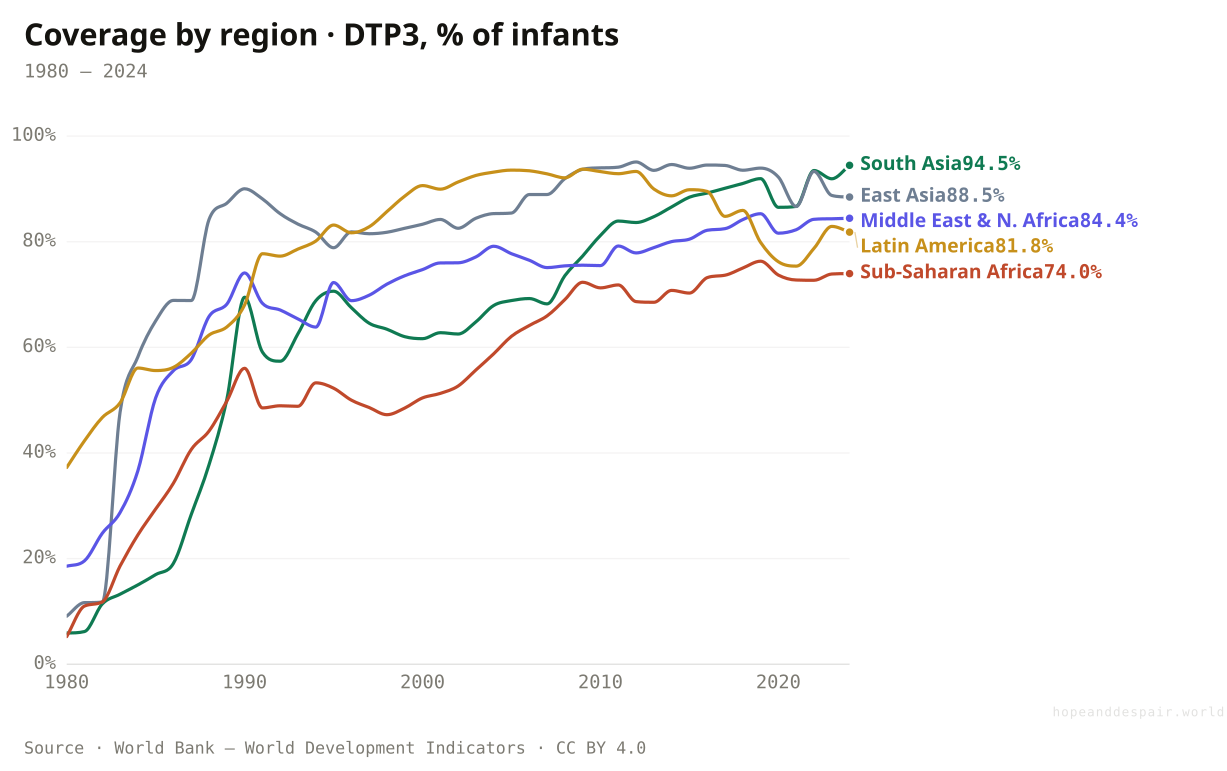
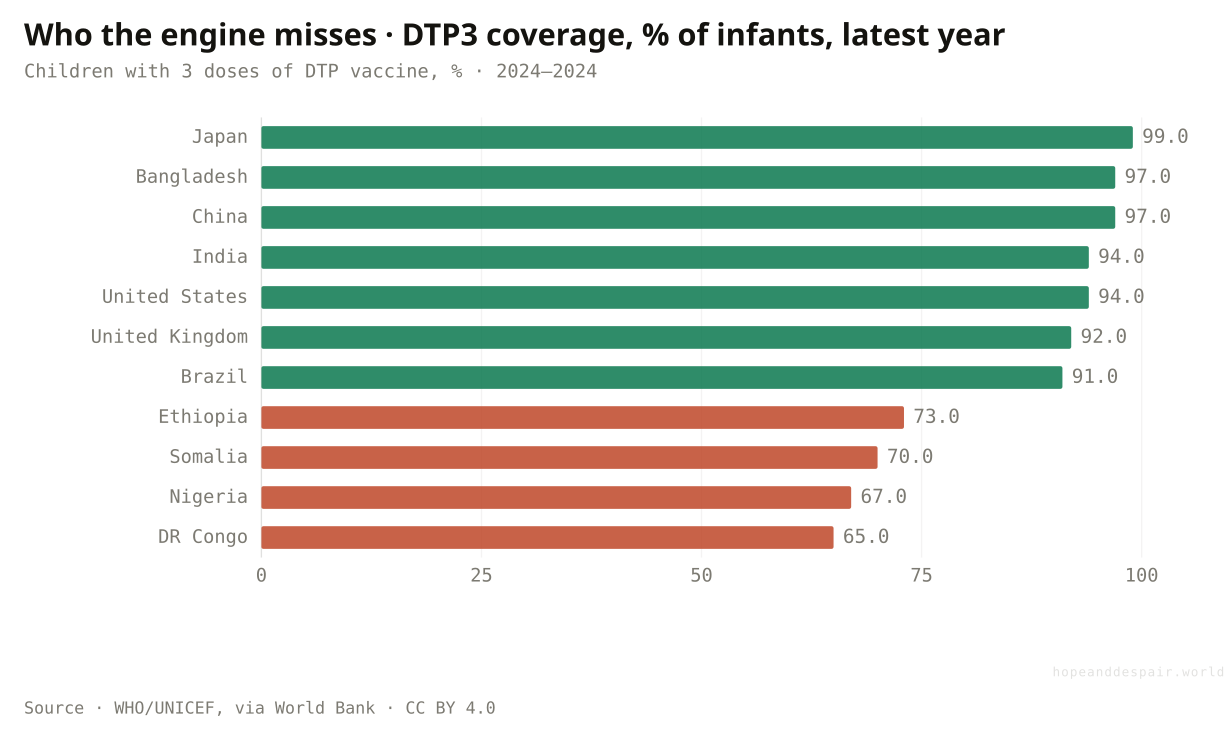
In 1980 one infant in five got the basic vaccines; now five in six do. South Asia has overtaken the world average; Central Africa still trails it.
In 1974 the World Health Organization launched something with a dull name and an enormous reach: the Expanded Programme on Immunization. Fewer than one child in twenty in poor countries was then vaccinated against the routine killers. The idea was simple and relentless, get a handful of cheap vaccines to every child on the planet, cold chain by cold chain. Coverage for the three-dose diphtheria-tetanus-pertussis course, the standard test of whether a health system reaches its babies, climbed from 20 percent in 1980 to about 85 today; measles tracks just behind. The basic vaccines travel together, given at the same infant visits, so hepatitis B and polio coverage sit within a point of that figure, and one line stands in for the whole routine schedule. Each point is millions of children who never caught what used to be a death sentence.
The regional picture carries the surprise. South Asia, once a byword for unreached children, now vaccinates 94 percent of its infants, several points above the world average, the fruit of India’s vast immunization drives. Sub-Saharan Africa trails at 74. By country the laggards are specific and knowable: Japan, Bangladesh, China, and India clear the mid-90s, while the Democratic Republic of Congo, Nigeria, and Somalia sit in the high 60s. That is the whole story of the stalled global line in miniature. The engine works; it has simply not reached the last, hardest places, which are exactly where the health system is weakest. A vaccine only works if it reaches an arm.
How this number was made
What it measures. Vaccination coverage — DTP3 (diphtheria/tetanus/pertussis), World
Calculation. Selected entity World.
The displayed line is monotone-cubic smoothed for legibility only — it never moves a data point.
South Asia now vaccinates 94 percent of its infants, above the world average, on the back of India’s mass campaigns. Sub-Saharan Africa, at 74, is the drag that holds the global line flat. The work left is not inventing the vaccine; it is the last hard mile to each child.
The floor is not the poorest countries but the most broken ones. Bangladesh, poor but peaceful, reaches 97 percent of its infants. The Democratic Republic of Congo, Nigeria, and Somalia sit in the high 60s, held down by conflict, distance, and distrust as much as by money. A child goes unvaccinated not where money is shortest but where the state’s reach gives out.
One of the cheapest interventions ever devised reaches roughly six in seven of the world’s children, and South Asia shows the last stretch is winnable.
Coverage has stalled for a decade and slipped in the pandemic, leaving pockets of unvaccinated children exactly where outbreaks catch.
Whether the last unreached fraction is a logistics problem or a trust problem differs sharply from place to place.
Are the epidemics in retreat — and are they everyone’s?
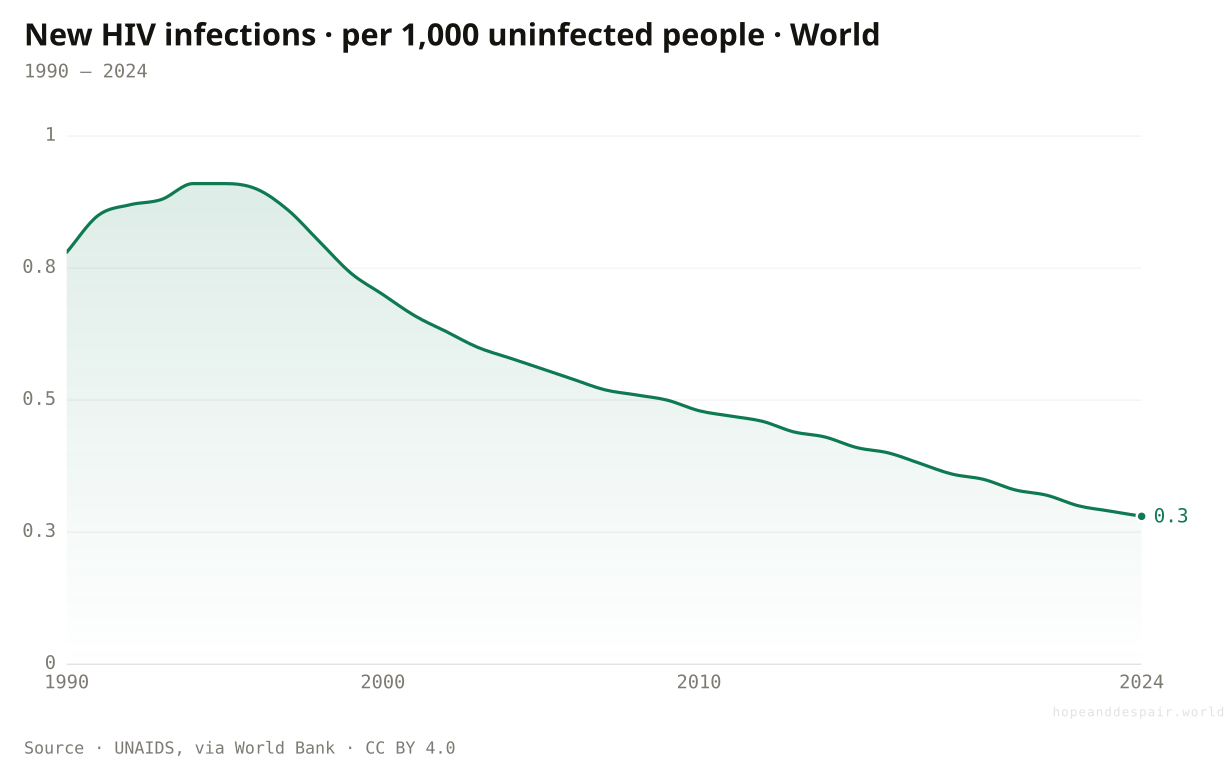
New HIV infections have fallen by two-thirds. But the burden that remains is not the world’s evenly; it sits in one region and a handful of countries.
In the 1990s a positive HIV test was, across much of the world, a death sentence with a timetable. New infections worldwide peaked near 0.9 per thousand uninfected people in 1995 and now sit around 0.28, a fall of roughly two-thirds, driven by antiretroviral therapy scaled up after 2003 until the drugs reached millions who could never have paid. The success has a strange shape: the number of people living with HIV has risen, from about 0.3 percent of adults in 1990 to 0.7, because the treatment that stops the dying keeps people alive for decades. Winning, on this measure, looks like more sick people, not fewer.
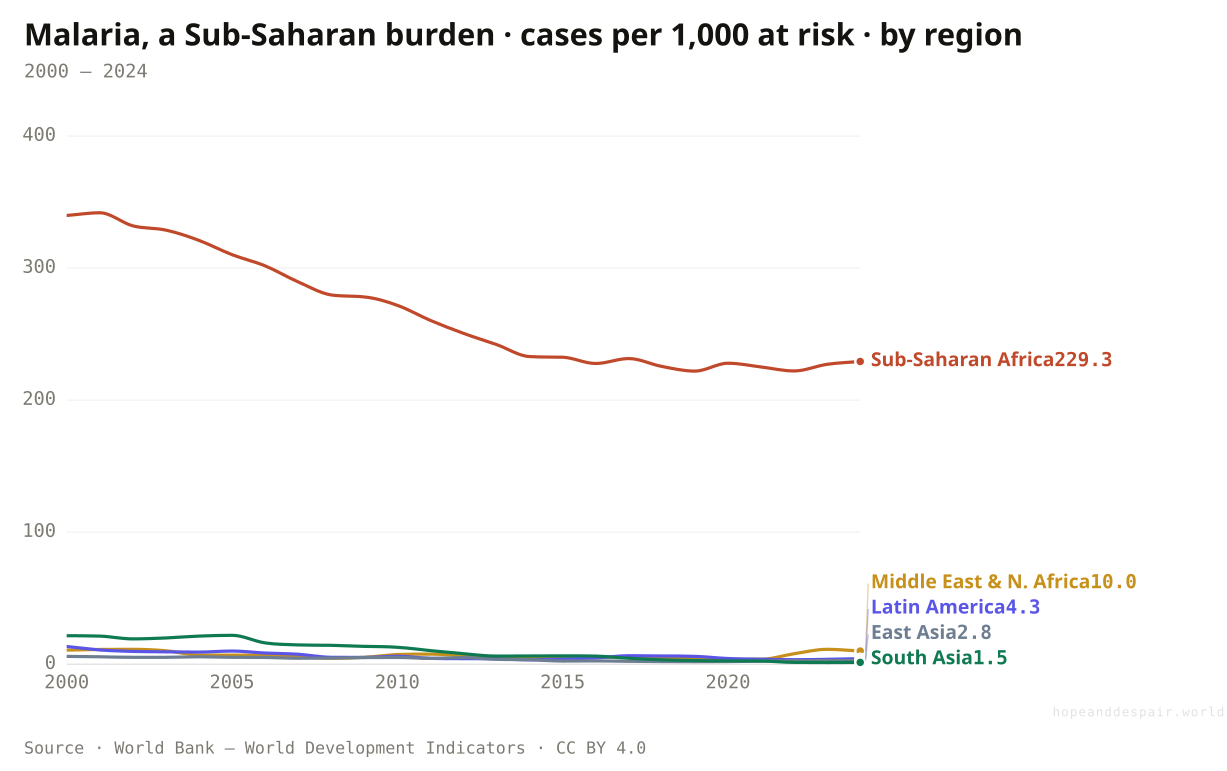
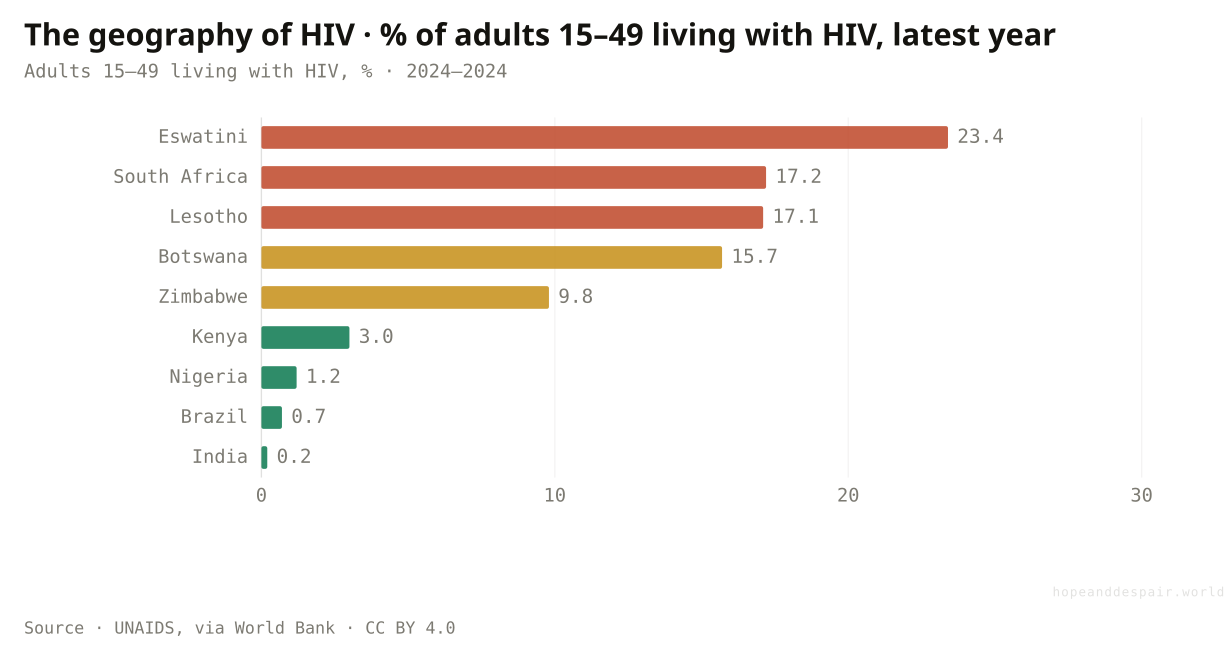
What the world line buries is how concentrated the remaining burden is. Malaria is the clearest case: across Sub-Saharan Africa there are about 229 cases a year for every thousand people at risk, against roughly one in South Asia, a regional gap of more than two hundredfold. HIV is concentrated by country instead. In Eswatini about 23 percent of adults live with the virus, in Lesotho and South Africa around 17, in India 0.2. The epidemics that defined a generation have become, in effect, the burden of specific places, which is grim and also the reason they can be planned against. The danger is that the programmes holding them down depend on outside money, and a budget written elsewhere can move every line here.
How this number was made
What it measures. Incidence of HIV, ages 15-49 (per 1,000 uninfected population ages 15-49)
Calculation. Selected entity WLD.
The displayed line is monotone-cubic smoothed for legibility only — it never moves a data point.
Malaria is now almost entirely a Sub-Saharan disease: about 229 cases a year per 1,000 at risk there, against one in South Asia. The burden did not fade everywhere evenly. It retreated to a single region.
About 23 percent of adults in Eswatini live with HIV, against 0.2 percent in India. On this map an 'epidemic’ is the weight carried by a handful of southern African countries, not a global event.
A diagnosis that meant death in 1995 is a manageable condition today, and a burden concentrated in a few places is a burden that can be targeted.
Malaria has turned back upward since 2019 and tuberculosis has stalled, while whole nations carry an HIV weight the rest of the world has forgotten.
Prevalence rising as new infections fall makes 'are we winning?' genuinely ambiguous on any single number.
Is it as safe to give birth — and where is it not?
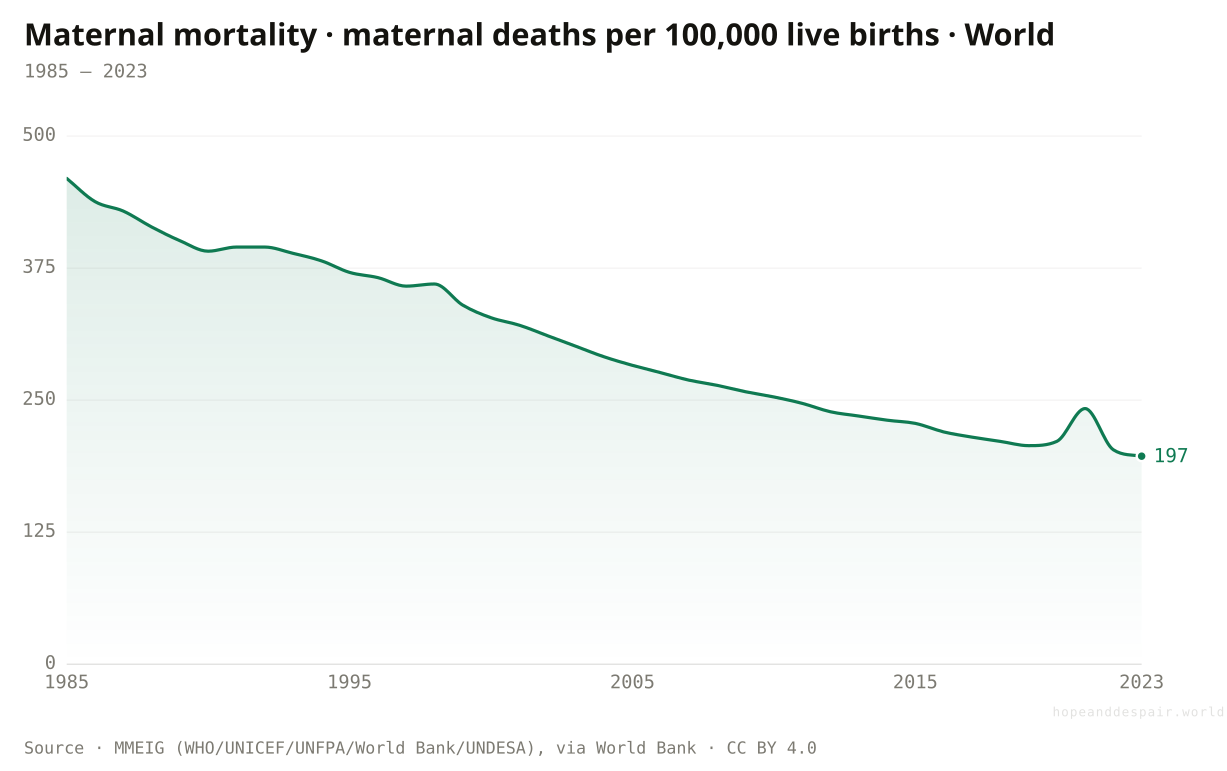
Maternal deaths halved, then stalled. A woman in Nigeria is still about 250 times more likely to die giving birth than a woman in Sweden.
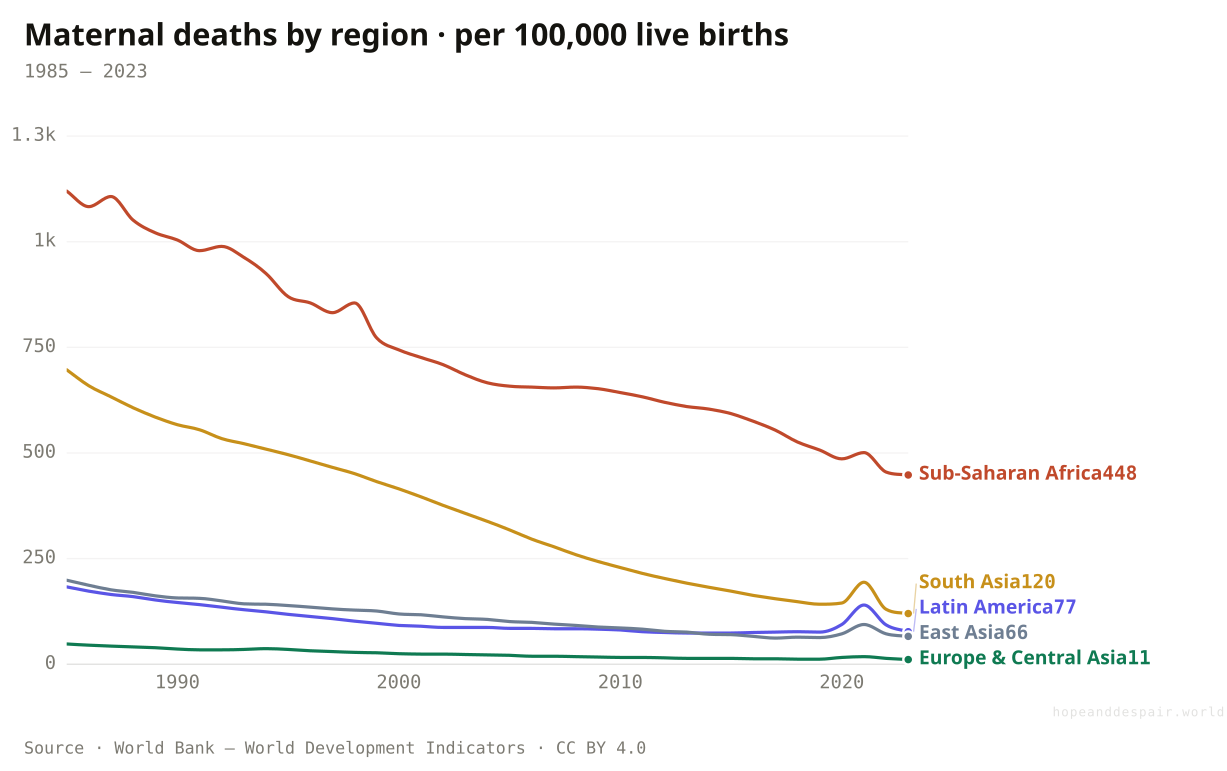
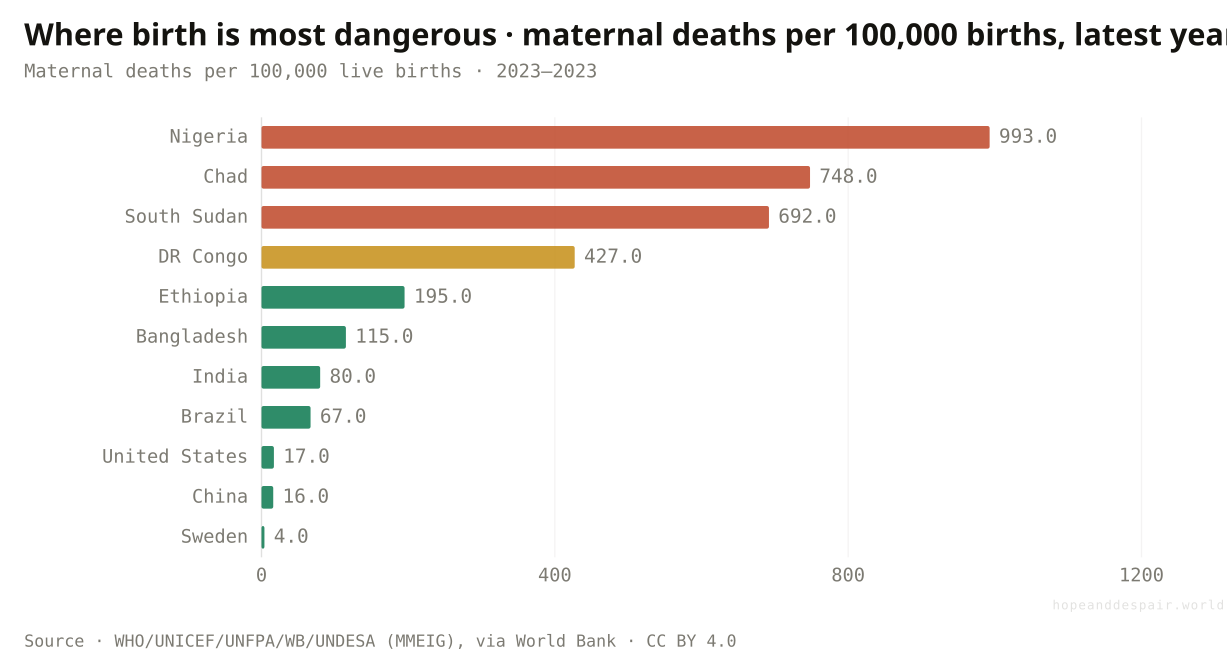
Of all the curves here, childbirth carries the cruelest gap. The world maternal death rate fell from about 460 per 100,000 births in 1985 to 197 today, but the fall stalled in the late 2010s and the pandemic briefly pushed it back up. The stall is the global story; the gap is the real one. By region, Sub-Saharan Africa loses about 448 mothers per 100,000 births while Europe and Central Asia lose 11, a fortyfold difference. By country the spread becomes almost hard to believe: Sweden loses about 4 mothers per 100,000 births, Nigeria 993, nearly one in every hundred, with Chad and South Sudan close behind.
A birth in the most dangerous country is on the order of 250 times likelier to kill the woman than the same birth in the safest. Nothing else in global health carries a rich-to-poor gap this brutal, and nothing else is as purely a problem of distribution rather than discovery. What closes it is unglamorous and known: a trained attendant, a way to stop a haemorrhage, a road to a clinic, blood to transfuse. The countries at the bottom of this chart are not waiting on a breakthrough; they are waiting on the staff and supplies to deliver the ones we already have. That makes maternal death, in principle, one of the most solvable catastrophes on this list. It has just not been solved.
How this number was made
What it measures. Maternal mortality ratio (modeled estimate, per 100,000 live births)
Calculation. Selected entity WLD.
The displayed line is monotone-cubic smoothed for legibility only — it never moves a data point.
Sub-Saharan Africa loses about 448 mothers per 100,000 births; Europe and Central Asia, 11. It is a fortyfold gap. Africa is falling, from about 610 a decade ago, but nowhere near fast enough to close it.
Sweden loses 4 mothers per 100,000 births, Nigeria 993, nearly one in a hundred. The fix is a trained attendant and blood to transfuse, not a discovery. That is what makes the gap as solvable as it is shameful.
Because the fix is delivery, not discovery, the worst maternal death rates are among the most reversible numbers on this site.
A 250-fold gap in surviving childbirth is a quiet, ongoing catastrophe that stalled even before the pandemic.
Maternal deaths are notoriously under-recorded, so the true figures in the worst-affected places may be worse than shown.
Did any of this ever go backwards?
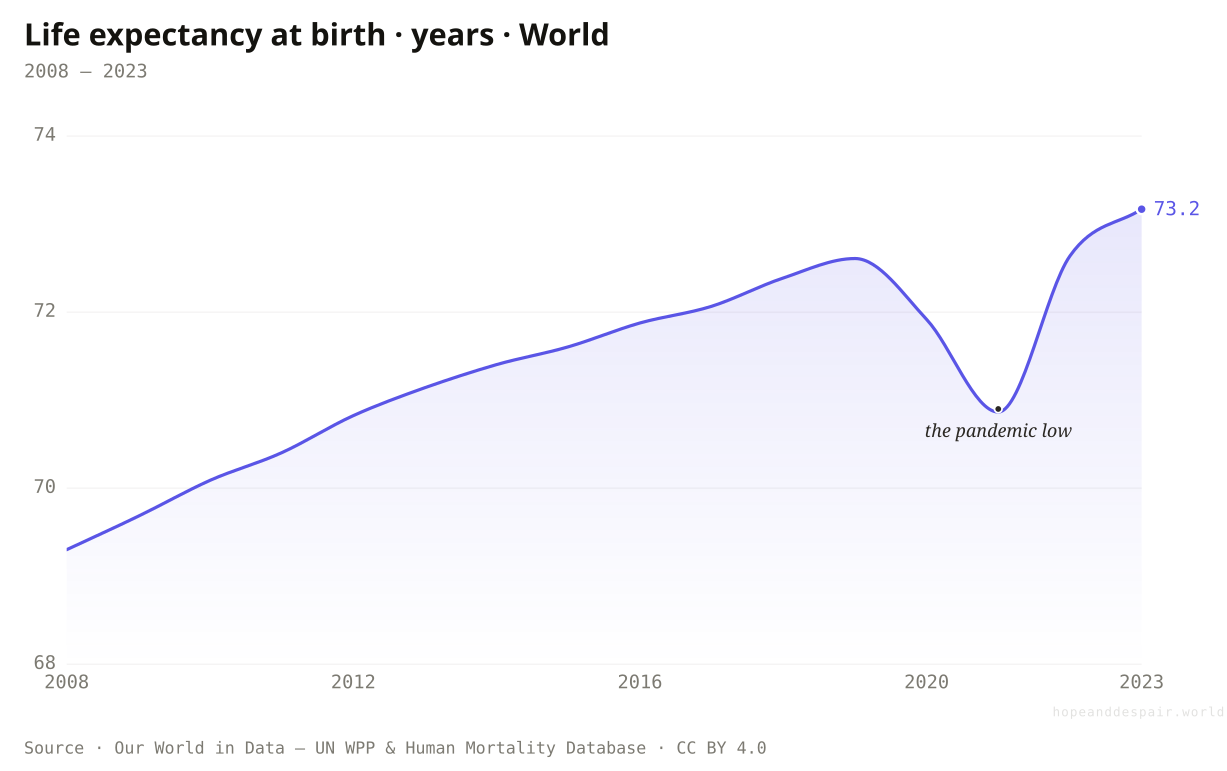
In 2020 and 2021, for the first time in a generation, human life got shorter — and in Latin America it fell off a cliff.
For most people alive today, life expectancy was a number that only ever went up. Then the world caught a new virus and in 2020 the line bent down. By 2021 the global figure had fallen from 72.6 years to 70.9, the planet aged backward by more than a year and a half, erasing roughly a decade of gains in two seasons. This is the single fact behind the verdict at the top of this piece. Progress this large is not a law of nature; it is a thing that can be lost.
The world figure understates how hard it hit some places. Latin America lost about three and a half years off its life expectancy between 2019 and 2021, falling from 75.2 to 71.8, a regional collapse with few peers in peacetime. And then, almost as fast, it came back. By 2023 the global figure had climbed past its pre-pandemic peak to 73.2. The dip and the rebound together are the honest answer to whether we are beating death: yes, on a scale that should be front-page news, and no, not safely, not permanently. The recovery is the hopeful part. The speed of the fall is the warning. This is the one section with no clean regional or country chart, because a pandemic’s toll lands in a single notch that a flat-scaled line cannot show; the numbers above come straight from the same series.
How this number was made
What it measures. Period life expectancy is the number of years the average person born in a certain year would live if they experienced the same chances of dying at each age as people did that year.
Calculation. Selected entity World.
The displayed line is monotone-cubic smoothed for legibility only — it never moves a data point.
The rebound was almost as fast as the fall — within two years the world had recovered all of it and more.
A single pathogen subtracted a decade of progress in two years, and in places like Latin America it took three and a half.
How much of the recovery is durable versus a bounce off an artificially low base will only be clear with hindsight.
We added the years. Are they healthy years — anywhere?
We live about nine years longer than we live well, and that gap follows the same map as wealth.
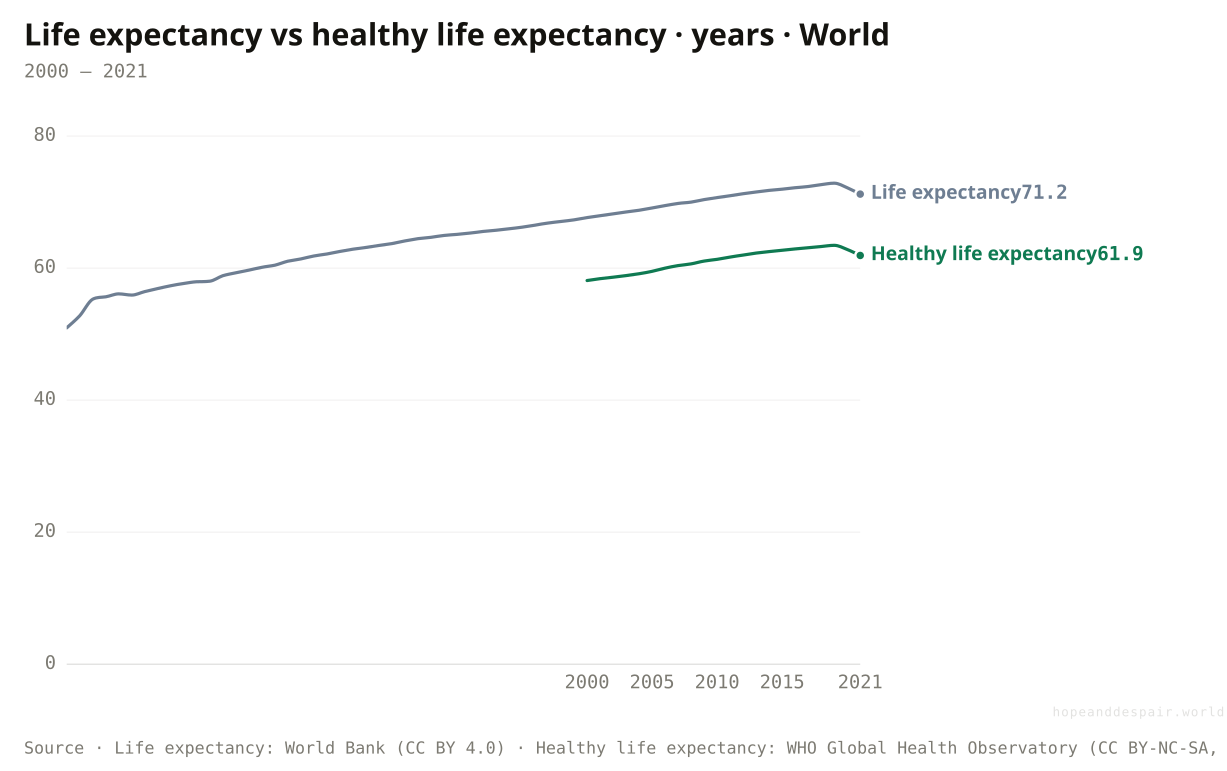
Underneath life expectancy sits a quieter number, and it complicates the whole celebration. Healthy life expectancy counts only the years lived in good health, before chronic illness or disability sets in. Worldwide in 2021 it was about 61.9 years, while overall life expectancy was near 70.9. The gap is roughly nine years: close to a decade, on average, lived in declining health at the end of a life. It is not closing as we live longer; if anything it widens, because the diseases we are best at surviving are the slow ones.
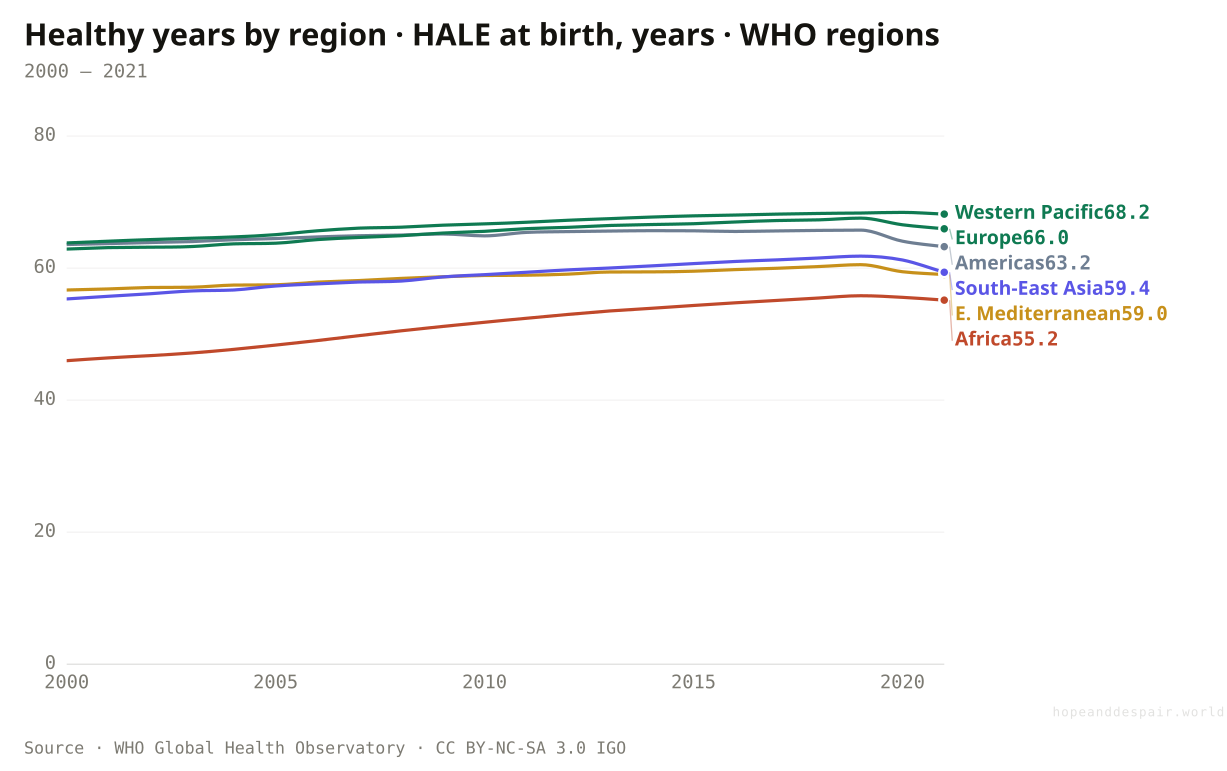
The regional picture maps onto wealth almost exactly. Healthy life expectancy runs from about 55 years across the WHO’s African region to 66 in Europe and 68 in the Western Pacific, a thirteen-year spread in good health on top of the gap in life itself. There is no country breakdown shown here, and that is deliberate: these figures come from the World Health Observatory, whose licence lets us chart and cite them but not re-host the file, so they sit beside the rest as borrowed evidence and stop at the regional line. Read together, the lines say something true and uncomfortable: we are winning years of life faster than we are winning years of health, and most unevenly where health was already shortest.
How this number was made
What it measures. Life expectancy at birth, total (years)
Calculation. Selected entity WLD.
The displayed line is monotone-cubic smoothed for legibility only — it never moves a data point.
Healthy life follows the same map as wealth, and the poorest places lose twice. WHO’s African region gets about 55 healthy years, Europe 66, the Western Pacific 68. That thirteen-year spread sits on top of the gap in life itself, so the shortest lives are also the least healthy. WHO data, link-only.
Even the healthy years are rising, and the gap to life expectancy is a measure of how many people now reach old age at all.
We are banking longevity as a growing stock of years in poor health, widest where health was already shortest.
Measuring 'healthy’ across cultures and clinics is hard, so the exact size of the gap is more uncertain than life expectancy itself.
If we are beating the old killers, what is left — and for whom?
We live long enough now to meet the slow diseases. But the world’s grey hair is spread wildly unevenly.
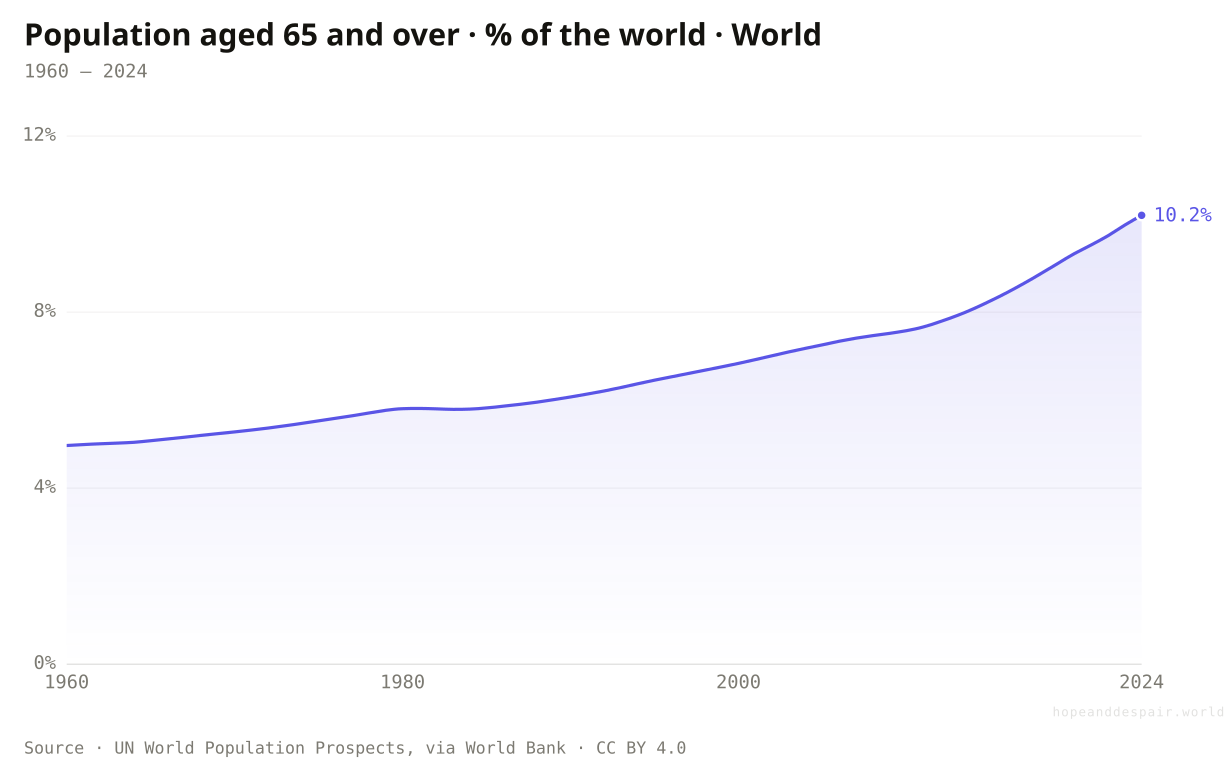
Hold all the good news at once and a new shape appears. As infections retreat and children survive, populations age: the share of the world over 65 has doubled from about 5 percent in 1960 to 10 today, and it is still climbing. That is success, written as a problem. The killers of an old population are not cholera and measles; they are heart disease, cancer, diabetes, and dementia, the slow conditions a body only reaches if nothing fast got there first.
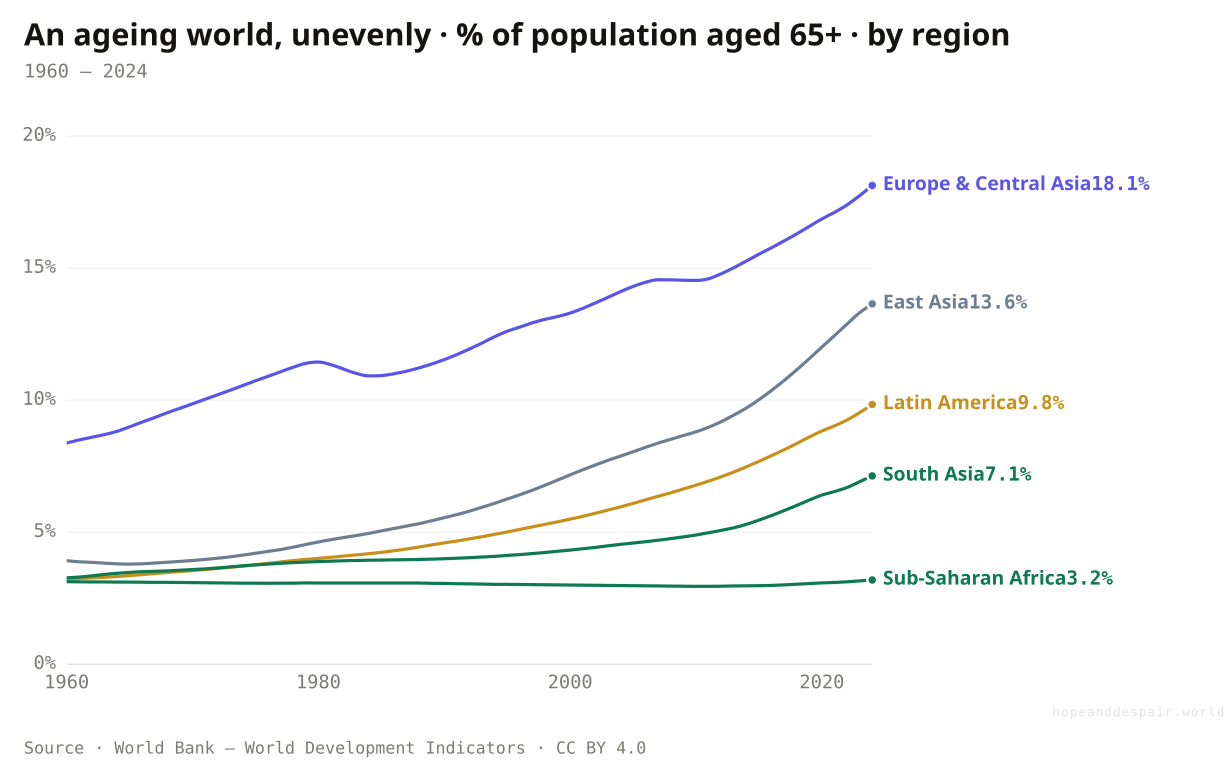
Ageing, though, is mostly a rich-region story so far. Europe and Central Asia are already 18 percent over 65; Sub-Saharan Africa is 3 percent, still a young continent finishing the fight against early death the older regions won. So the frontier arrives in sequence, not all at once. Some of it is already yielding: smoking, the great accelerant, has fallen worldwide from about 34 percent of adults in 2000 to 22, and the probability of dying early from the four big chronic diseases has edged down from 22 to 18 percent. But there is no single shot for ageing, no cold chain that delivers a cure for the slow diseases, and the years we are adding are not all healthy ones. We spent a century learning to keep people from dying young. The next century’s question is quieter and harder: not whether people live, but how well, and for how long after.
How this number was made
What it measures. Population ages 65 and above (% of total population)
Calculation. Selected entity WLD.
The displayed line is monotone-cubic smoothed for legibility only — it never moves a data point.
Europe and Central Asia are already 18 percent over 65; Sub-Saharan Africa, 3 percent. Ageing is a rich-region condition the poorer regions have not yet reached, so the frontier of chronic disease arrives in sequence, not all at once.
Mass old age is itself the prize — billions now reach the decades that chronic disease occupies, which almost no one used to.
The slow diseases have no vaccine, and the ageing regions are stacking up years of poor health faster than they can prevent them.
Whether ageing societies can stay healthy and solvent at once is an experiment no country has finished running.
As the old killers retreat, what takes their place?
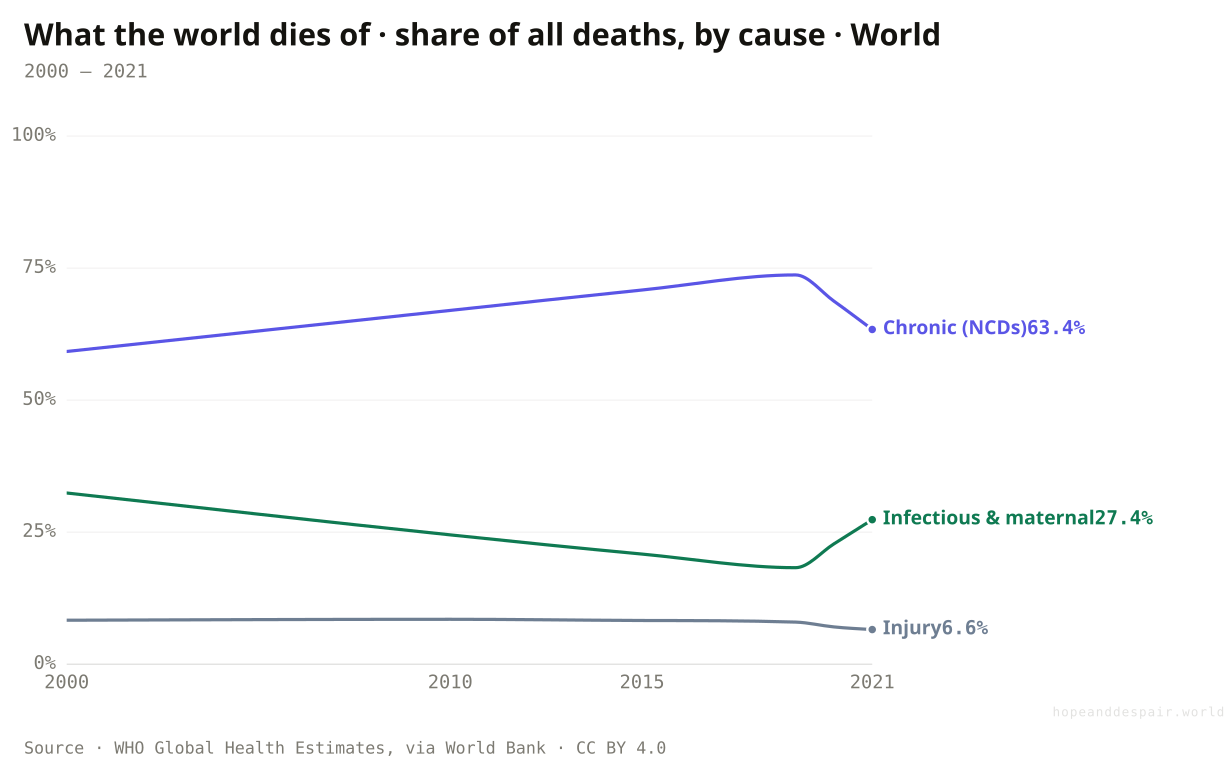
In one generation the world flipped from dying of infections to dying of chronic disease — and then the pandemic flipped a piece of it back.
In 2000, about a third of all deaths on Earth came from infectious disease, childbirth, and hunger. By 2019 that share had fallen to 18 percent, while deaths from the chronic diseases, heart attacks, cancer, diabetes, climbed from 59 percent to nearly three-quarters. That flip is the epidemiological transition, the quiet signature of a world where children stop dying young. Then the pandemic put a notch in it: communicable deaths jumped back to 27 percent in 2021, the first reversal of the trend in living memory.
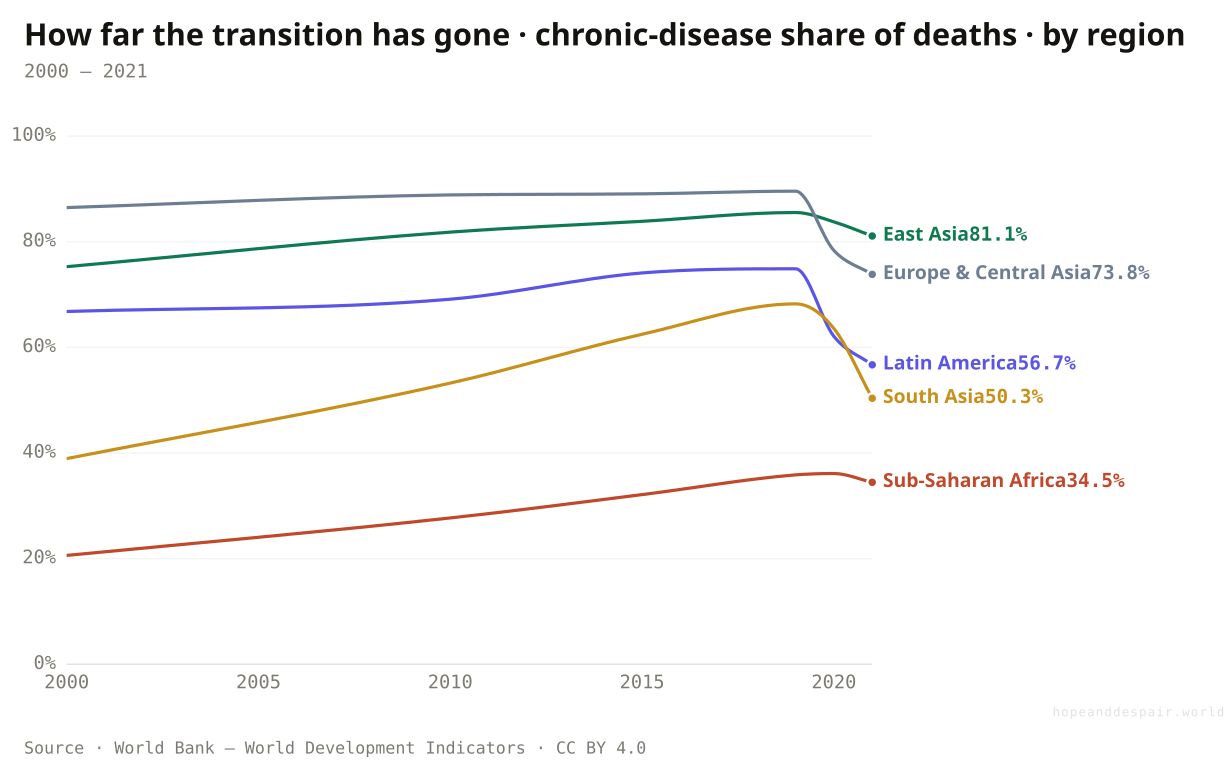
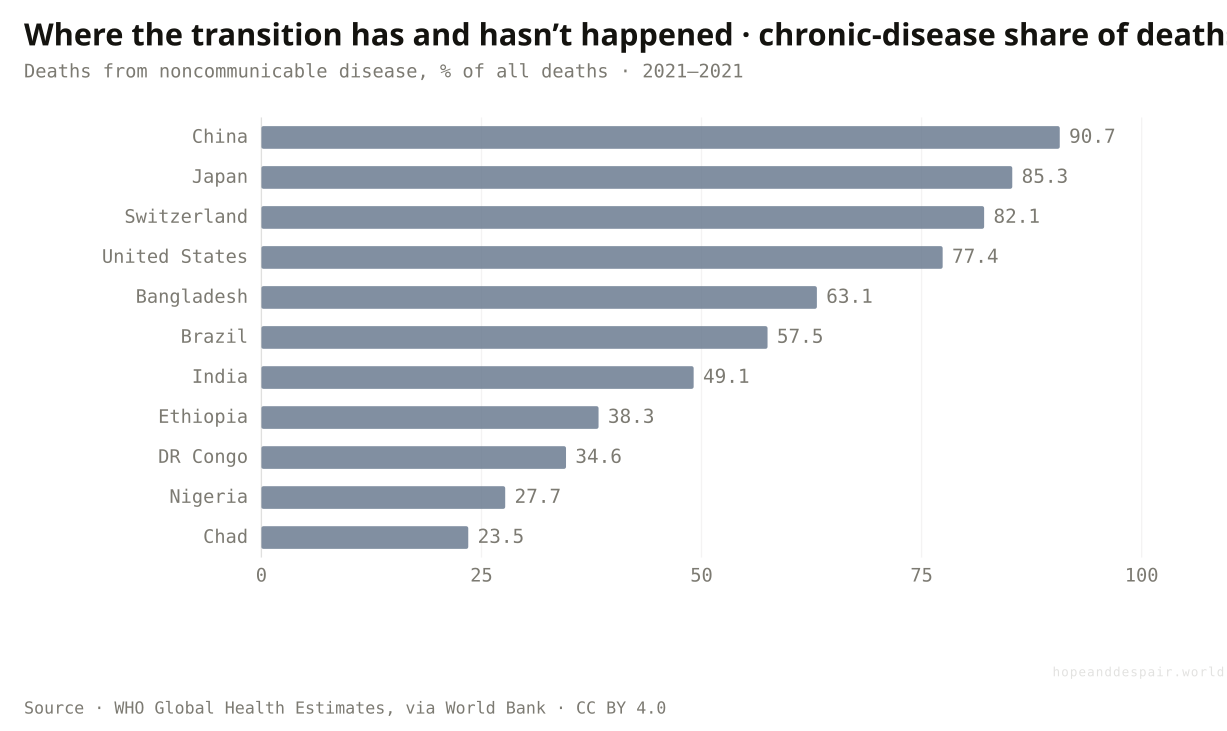
How far a place has traveled along that path is itself a map of development. In East Asia and Europe, around 80 and 74 percent of deaths are now chronic; across Sub-Saharan Africa it is 34 percent, with the majority of deaths still infectious. By country the spread runs from China at 91 percent to Chad at 24. None of this is simply good or bad. Dying of heart disease at 78 is the prize for not dying of measles at 2. The transition is what success looks like from the inside, and most of the world now lives in its second half, where the enemy is slow, chronic, and far harder to vaccinate against.
How this number was made
What it measures. Cause of death, by non-communicable diseases (% of total)
Calculation. Selected entity WLD.
The displayed line is monotone-cubic smoothed for legibility only — it never moves a data point.
East Asia is 81 percent chronic, Sub-Saharan Africa 34, where most deaths are still infectious. The transition is a development clock, set differently in each region.
China and Japan now lead the world in dying of chronic disease, above 85 percent, precisely because they have beaten the infections that kill the young. Chad’s deaths are barely a quarter chronic. A high share is grim and a milestone at once, the price of having survived everything that used to come first.
Dying old of a chronic disease is the prize for surviving everything that once killed the young, and most of the world has now claimed it.
The chronic diseases that dominate death now carry no vaccine, and the pandemic showed the infectious ones can still surge back.
A rising share of chronic death is at once a marker of progress and a warning of the burden ahead, genuinely both at the same time.
Zoom past the country line. Is survival equal even within one nation?
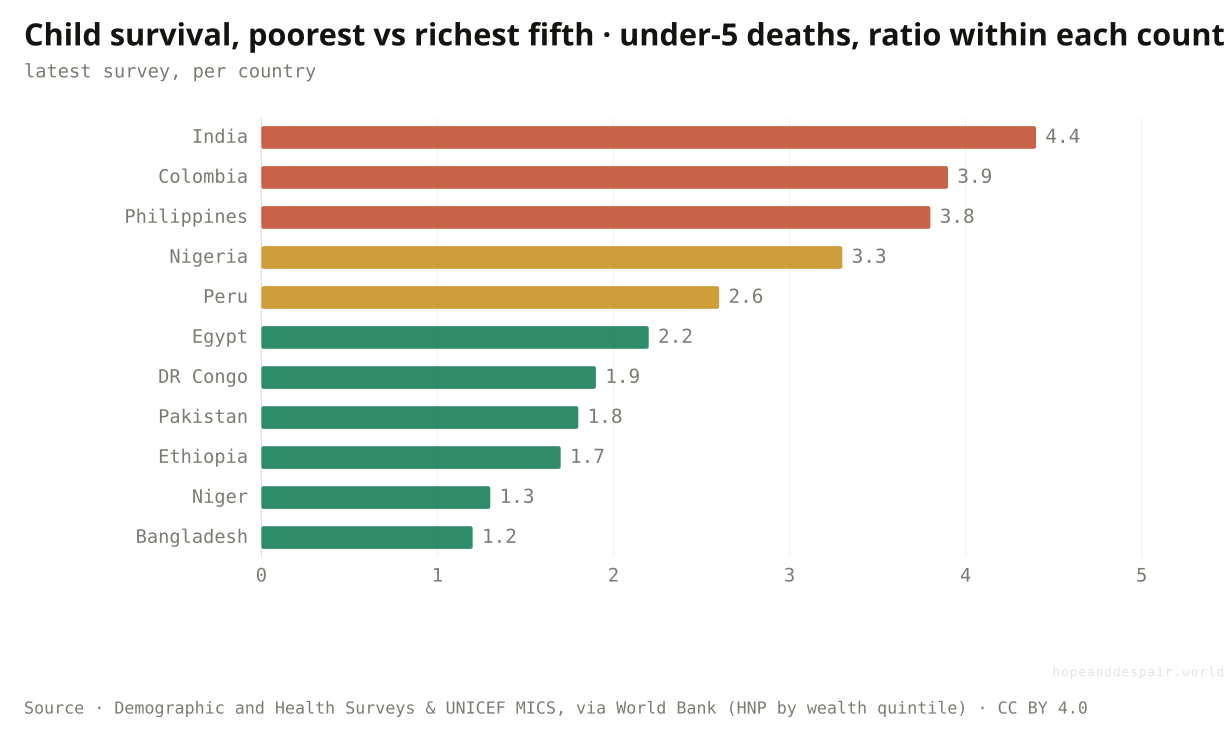
No country is one place. In India the poorest fifth’s children die at more than four times the rate of the richest fifth’s.
Take the country averages that rank every other chart here, and zoom past them entirely. Within India, children in the poorest fifth of households die before five at about 4.4 times the rate of children in the richest fifth: the same country, the same year, the same flag. Colombia and the Philippines run close behind. Every national average on this page hides a second country folded inside it, where the poor still live by older rules.
The strange part is where the gap is widest. It is not the poorest countries; it is the middle-income ones. In Niger and Ethiopia the ratio sits below two, not because they are fair but because they are poor enough that the rich bury children too. A wide internal gap is, perversely, a sign that some families have already escaped, that survival has become something money can buy inside a single border. This is the last magnification on the page, the one no global headline reaches. The average launders the spread, and even one country is never one place.
How this number was made
What it measures. Under-five mortality among the poorest 20% of households divided by that of the richest 20%, latest survey per country. A ratio of 3 means a child in the poorest fifth is three times as likely to die before five as one in the richest fifth of the same country. A curated 11-country spread sorted descending.
Calculation. Latest value per country, 11 curated countries sorted descending.
Within most countries the survival gap is narrowing as the poorest families gain the basics the richest always had.
In the same city, under the same government, a poor child can be several times more likely to die than a rich one.
The widest internal gaps sit in middle-income countries, so a closing national average can hide a widening one inside.
We learned to stop people from dying young so well that the world’s hardest health question changed underneath us — from whether you live to how well, and for how long after.— The whole argument, in one line
One question, read by the fields that actually study it. Each voice is given both its most hopeful and its darkest honest reading — with a note on how settled the evidence underneath is.
the hopeful readChild survival is the most reliable upward trend in human history, and it has not truly reversed.
the darker readThe same survival ages every population into a wall of chronic disease no society has solved.
the hopeful readHIV, smallpox, and measles prove that a coordinated push can bend an entire disease curve downward.
the darker readMalaria’s turn upward and TB’s stall show those gains reverse the moment attention or money slips.
the darker readA national average is no comfort in a room with no blood to transfuse. The mother in front of me is the only dataset that counts.
the darker readThe world recovered its life expectancy in two years. My family did not recover anything.
the hopeful readThe cheapest wins, vaccines and antiretrovirals, still return more life per dollar than almost anything humans buy.
the darker readMost of these curves bend on donor money, and the budgets that hold them up are not guaranteed.
Strongest case for hope
The long view is overwhelming and it is the true story. Child mortality has fallen more than tenfold, life expectancy has more than doubled, and a diagnosis that meant death in 1995 is now a manageable condition. The engines of that progress, from vaccines and clean water to antiretrovirals and trained birth attendants, have not stopped working, and the regions that started worst are improving fastest, so the global gaps are narrowing. The pandemic took a piece back and the world recovered it in two years. A bad five years does not undo a better two hundred.
Strongest case for despair
The one-way traffic is over. Life expectancy fell for the first time in a generation, maternal progress stalled before the pandemic and has barely restarted, malaria has turned back upward, and TB has flatlined. The averages hide a ninefold gap in whether a child survives and a 250-fold gap in whether a mother does, sustained in many places by foreign money that can vanish with one budget. And the very success of beating early death has handed us an ageing world full of slow diseases we are far better at surviving than preventing.
The hope case weakens if life expectancy fails to keep rising through the late 2020s, or if vaccine coverage and malaria continue to slide across multiple regions for another five years. The despair case weakens if Sub-Saharan child and maternal mortality resume falling at their pre-2015 pace, if the healthy-life-expectancy gap stops widening, and if the big infection programmes survive intact through a period of donor retrenchment.
Everything done to the numbers between the source and the chart, disclosed in full. Where a choice is editorial rather than measured, we say so.
- Under-five mortality
- The share of children who die before their fifth birthday. The world series (per 100 live births) runs on UN IGME and Gapminder via Our World in Data, back to 1800; the regional and country cuts (per 1,000 live births) are UN IGME via the World Bank. Note the unit differs between the deep world curve and the regional charts.
- Life expectancy at birth
- Average years a newborn would live under current mortality rates. Dominated by infant survival, so most of its long rise reflects fewer child deaths, not longer old age. World series from Our World in Data (UN WPP, Human Mortality Database, Riley 2005); regional and country cuts from the World Bank.
- Healthy life expectancy (HALE)
- Years lived in full health, with time in illness or disability discounted. From the WHO Global Health Observatory (CC BY-NC-SA), so it is charted and cited here, world and WHO-region only, but not offered for download. The gap to life expectancy is the years lived in poor health.
- Incidence vs prevalence
- Incidence counts new cases in a year; prevalence counts everyone living with a condition at a moment. For HIV the two diverge: incidence falls while prevalence rises, because treatment keeps people alive with the virus. Both via UNAIDS / WHO through the World Bank.
- Maternal mortality ratio
- Maternal deaths per 100,000 live births, modelled by the MMEIG (WHO, UNICEF, UNFPA, World Bank, UNDESA), via the World Bank. Maternal deaths are heavily under-recorded where systems are weakest, so the worst figures are likely undercounts.
- Regional and country lenses
- Each section reads at three magnifications, and the last at a fourth. Regional aggregates are the World Bank’s (six WDI regions) or the WHO’s (for HALE); country bars show a curated, recognizable spread at the latest available year. Where the World Bank computes no regional aggregate (HIV incidence for some regions, malaria for Europe) the line is simply absent, never invented.
- Cause-of-death composition
- The share of deaths from communicable (with maternal and nutritional), non-communicable, and injury causes — WHO Global Health Estimates via the World Bank (CC BY). Sparse years (2000, 2010, 2015, 2019–2021); the three shares sum to roughly 100. The deeper cause-by-cause and disability detail lives at IHME’s Global Burden of Disease, whose licence is non-commercial, so we link to it rather than re-host it.
- Wealth-quintile gap
- Under-five mortality among the poorest 20% of households divided by the richest 20%, from DHS and UNICEF MICS household surveys via the World Bank’s HNP database (CC BY). Latest survey per country, low- and middle-income countries only — the within-country lens below the national average.
- The composite verdict
- The evidence-panel overview and the temperature reading are an editorial synthesis of the signals, not a computed index. Every underlying chart is real, ingested, and individually sourced.
- UN Inter-agency Group for Child Mortality Estimation (UN IGME) — childmortality.org ↗ · CC BY 4.0 · vintage 2024Child and under-five mortality; via Our World in Data and the World Bank.
- Our World in Data — Life Expectancy — ourworldindata.org/life-expectancy ↗ · CC BY 4.0 · vintage 2024UN WPP, Human Mortality Database, Riley (2005).
- WHO/UNICEF Estimates of National Immunization Coverage (WUENIC) — www.who.int/teams/immunization-vaccines-and-biologicals/immunization-analysis-and-insights/global-monitoring/immunization-coverage ↗ · CC BY 4.0 · vintage 2024DTP3 and measles coverage; via Our World in Data.
- UNAIDS — aidsinfo.unaids.org ↗ · CC BY 4.0 · vintage 2024HIV incidence and prevalence; via the World Bank.
- World Bank — World Development Indicators — data.worldbank.org ↗ · CC BY 4.0 · vintage 2024The World Bank’s open mirror of WHO, UN IGME, UNAIDS, MMEIG and UN WPP. It carries the regional and country cuts for life expectancy, maternal mortality, vaccines, TB, malaria, HIV, and ageing.
- Maternal Mortality Estimation Inter-agency Group (MMEIG) — www.who.int/data/maternal-newborn-child-adolescent-ageing/maternal-health ↗ · CC BY 4.0 · vintage 2023Maternal mortality ratio; via the World Bank.
- WHO Global Health Observatory — www.who.int/data/gho ↗ · CC BY-NC-SA 3.0 IGO · vintage 2024Healthy life expectancy (HALE) and premature NCD mortality. Link-only: charted and cited, not re-hosted, per WHO’s terms.
- World Bank HNP — Health, Nutrition & Population by wealth quintile (DHS & UNICEF MICS) — databank.worldbank.org/source/health-nutrition-and-population-statistics-by-wealth-quintile ↗ · CC BY 4.0 · vintage various surveysUnder-five mortality by household wealth quintile — the within-country equity lens. Cause-of-death composition is WHO Global Health Estimates, via the World Bank.
- IHME — Global Burden of Disease (link-only) — vizhub.healthdata.org/gbd-results ↗ · IHME Free-of-Charge Non-Commercial Agreement · vintage GBD 2021The deepest cause-of-death, disability, and risk-factor surface. Non-commercial licence, so linked for reference, never re-hosted; the re-hostable composition shown here is the CC BY WHO/World Bank equivalent.
Cite this page
Reference
Hope & Despair. “Are we beating disease and death?.” Hope & Despair, 2026. https://hopeanddespair.world/questions/are-we-beating-disease-and-death.
BibTeX
@misc{hopeanddespair:are-we-beating-disease-and-death,
  author       = {{Hope & Despair}},
  title        = {{Are we beating disease and death?}},
  year         = {2026},
  howpublished = {\url{https://hopeanddespair.world/questions/are-we-beating-disease-and-death}},
  note         = {hopeanddespair.world, updated 2026-06-14}
}
Original prose, code, and chart designs are released under CC BY 4.0 ↗ — reuse freely with attribution. Source datasets keep their own licences, listed above. Add your access date when citing.
- Mobile-first chart system + redesign branch snapshot View diff →
- Scaffold the static-first Astro site (foundation milestone) View diff →
Generated from the commit history — every edit to a number, a word, or a chart is tracked in the open. Browse the full history & diffs on GitHub →
in plain words
If you remember one thing from this page, remember the first chart. Two hundred years ago, nearly half of all children died before they turned five. Today it is under four in a hundred, and still dropping. There is no bigger or better-hidden piece of news about the human race. We made dying young rare, and we did it almost everywhere.
But the good news comes with three catches, and they are why the answer is “better than it feels” rather than just “better.” The first: the last five years bent the line the wrong way. A new virus made human life shorter in 2020 and 2021 for the first time most people could remember, before the world clawed it back. The second: the average is a kind of lie. A child in Sub-Saharan Africa is still nine times likelier to die before five than a child in Europe, and a woman in Nigeria is hundreds of times likelier to die giving birth than a woman in Sweden, gaps that are mostly about who has a clinic and who does not, not about what medicine knows. The third: we got so good at stopping fast deaths that we now live long enough to meet the slow ones, the heart disease and dementia of old age, and we are winning years of life faster than we are winning years of good health.
So, are we beating disease and death? Yes, by a margin so large that not knowing it should count as being misinformed about the world. And also not yet, not safely, and not for everyone equally. The one thing to say at dinner and be right: the retreat of early death is the greatest achievement nobody talks about, and the work that is left is no longer mostly about discovering cures. It is about getting the ones we already have to the people who still die without them.