Question 19 · Food
Can the world afford to eat healthy?
The price of a healthy diet is no longer a vague feeling. It is measured country by country. The news is split: the world is improving again, but billions are still priced out, and the worst places are being left further behind.
For years, arguments about healthy food had a missing number. We knew fruit, vegetables, pulses, eggs, fish, and dairy mattered. We knew poor families were squeezed. But there was no single global answer to the blunt question: in each country, what would the cheapest healthy diet cost, and how many people have too little income left to buy it?
The FAO and World Bank now publish that number. In 2024, the average cost of a healthy diet reached about $4.46 per person per day in purchasing-power dollars. Around 2.6 billion people still could not afford it. That is better than 2023, but it is not a victory lap. It is one third of humanity.
The hard part is that the average and the map tell opposite emotional stories. Globally, affordability has recovered from the pandemic shock. In Sub-Saharan Africa and low-income countries, the line is stuck high or worsening. This is the shape of progress now: the world gets a little better while the hardest places do not.
you read
- This is mostly an affordability story. The core data says whether people could afford the least-cost healthy diet in their country, after basic non-food needs. It does not prove what they actually ate.
- The diet is a lower bound. CoAHD prices the cheapest locally available foods that meet food-based dietary guidelines. Real families also face taste, cooking time, transport, storage, safety, seasonality, and food marketing.
- Recent years use more assumptions. The FAO and World Bank update costs with food price indexes and combine them with income distributions. The newest points are the most useful for policy, and also the most dependent on nowcasting and imputation.
- The country table is not the official world aggregate. The raw Data360/FAOSTAT pull used here has country and economy rows. For the headline global count, the article cites the official FAO/World Bank/SOFI estimate; for country rankings and changes, it uses the raw country data.
- Eating healthy is wider than calories. The final sections bring in FAO food security indicators and UNICEF child food poverty because a household can have enough calories and still have a poor diet.
What does a healthy diet cost?
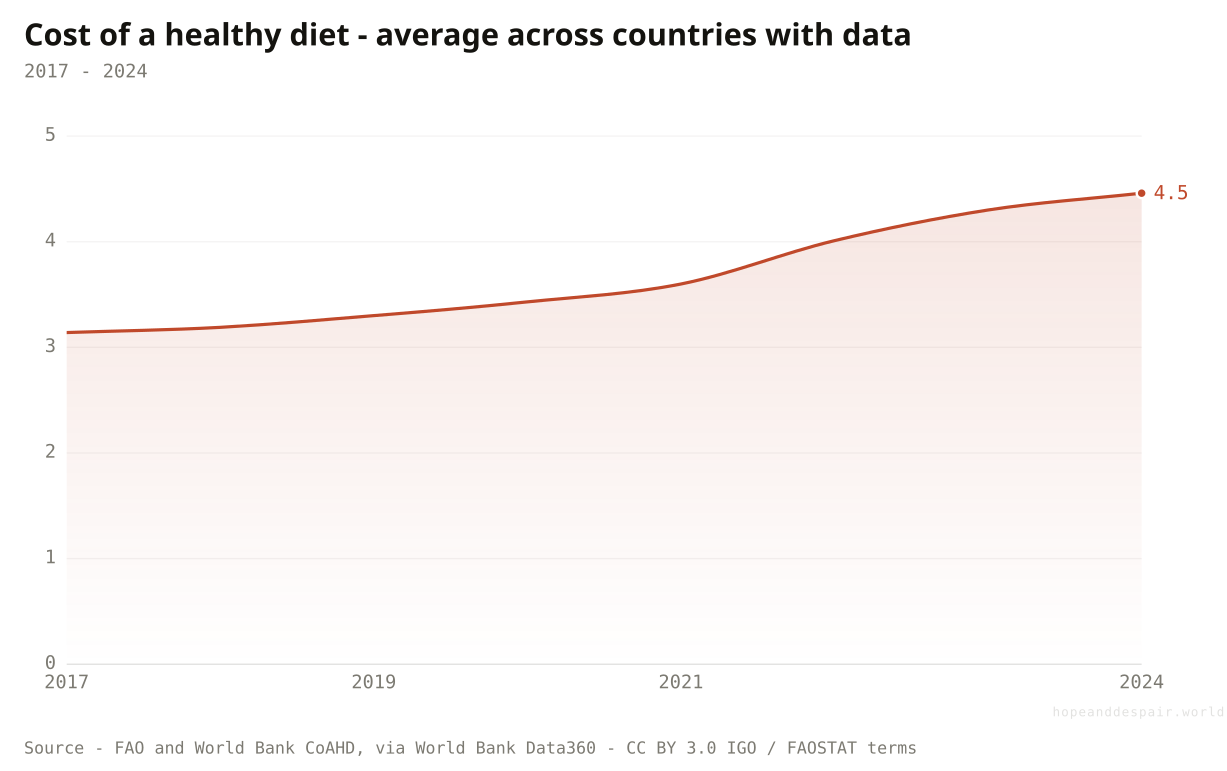
The average national cost rose from about $3.14 a day in 2017 to $4.46 in 2024.
A healthy diet, in this dataset, is not a luxury shopping basket. It is the least expensive combination of locally available foods that meets a common healthy-diet standard: enough energy, enough food groups, and proportions consistent with food-based dietary guidelines.
Measured that way, the average national cost climbed steadily from 2017, jumped hardest around the food-price shock of 2022, and reached $4.46 per person per day in 2024. That number is in purchasing-power dollars, so it is meant to compare what money buys across countries, not what a currency is worth at a market exchange rate.
The hopeful reading is that healthy food has become a measurable policy target. The darker reading is that $4.46 a day for one person is already beyond the food budget of hundreds of millions of households. For a family of five, it is more than $22 a day before rent, fuel, school, transport, medicine, debt, or anything else.
How this number was made
What it measures. Average national cost of the least-cost healthy diet, PPP dollars per person per day, across countries/economies with data.
Calculation. Averaged national PPP-dollar healthy-diet costs by year across countries/economies with available CoAHD data.
The displayed line is monotone-cubic smoothed for legibility only — it never moves a data point.
The thing we need to fix is now measured: a comparable daily price for a healthy diet in each country.
The cheapest healthy basket rose about 42 percent in seven years, and the rise hit before many incomes recovered.
The price is a modelled minimum. Real life can make the same diet cost more than the line.
How many people are still priced out?
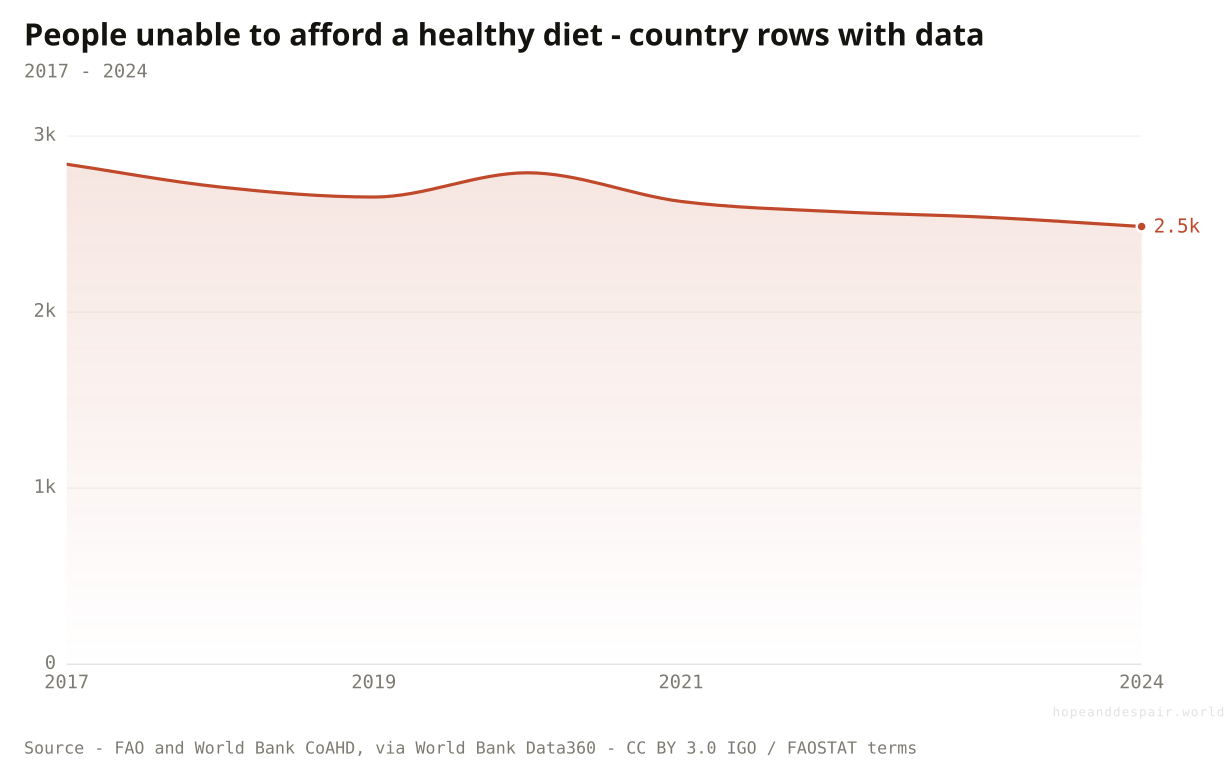
The official 2024 estimate is about 2.6 billion people, down from 2023 but still roughly one in three humans.
The official FAO and World Bank headline is the cleanest number: around 2.6 billion people could not afford a healthy diet in 2024, 48.8 million fewer than in 2023. That is the hopeful part. The count is lower than the pandemic-era peak, and the recovery in incomes is again doing some work.
The raw country rows tell the same broad shape, with a caveat. Summing only the countries with NUA data gives about 2.49 billion people in 2024. The official aggregate is higher because the institutions compute global totals with their full aggregate method and coverage adjustments. This chart is therefore useful for direction, not as the headline world total.
The direction still matters. The global affordability crisis got worse in 2020, eased after 2021, and has kept easing slowly. But "slowly" is doing a lot of work. At this pace, the story is not that the crisis is over. It is that the world has stopped falling down the stairs.
How this number was made
What it measures. Sum of people unable to afford a healthy diet across countries with available CoAHD NUA estimates. Official FAO/World Bank global aggregates are slightly higher because aggregate methods handle coverage gaps.
Calculation. Summed country-level NUA estimates by year; values are in millions because UNIT_MULT is 6 in the source.
The displayed line is monotone-cubic smoothed for legibility only — it never moves a data point.
The count is falling again after the pandemic shock.
A recovery that still leaves about 2.6 billion people priced out is not a small problem.
The country-row sum and the official global aggregate are close but not identical; the article uses each for the job it can honestly do.
Is affordability improving everywhere?
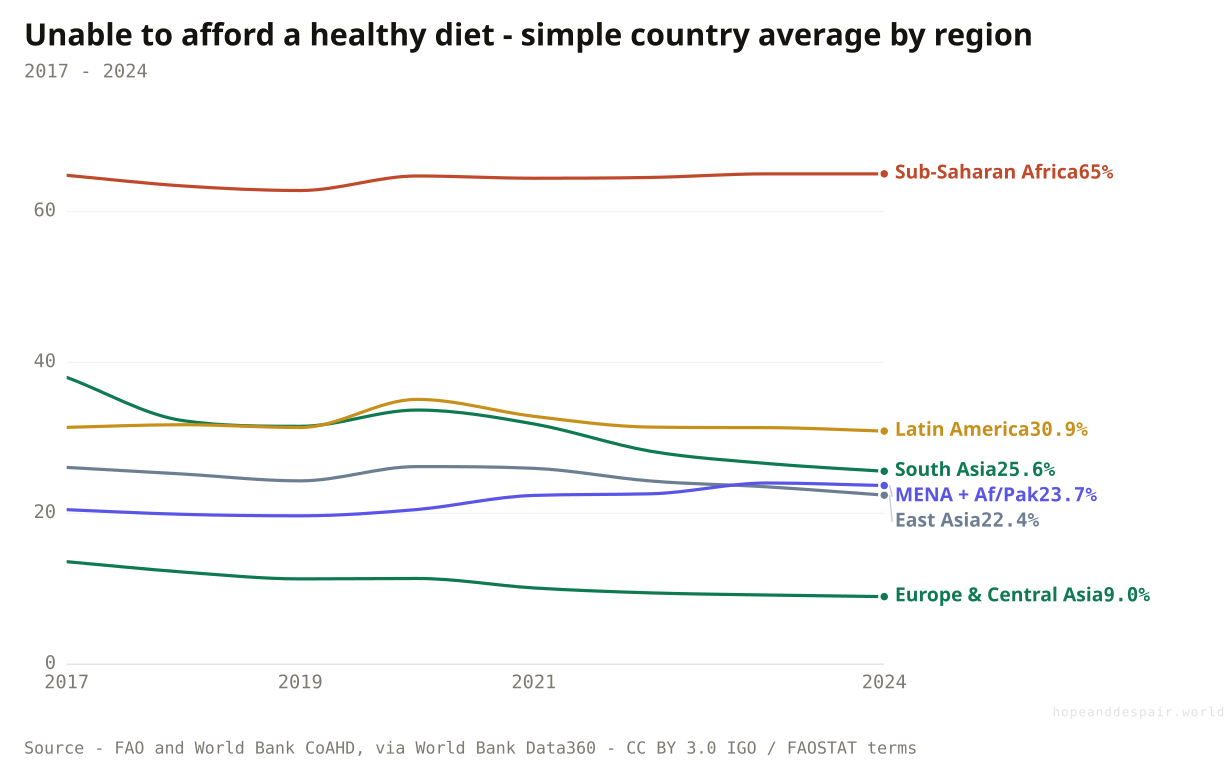
No. South Asia improved sharply, Europe improved, East Asia improved. Sub-Saharan Africa stayed stuck, and the Middle East and North Africa moved the wrong way.
The average hides the central story. In South Asia, the average country prevalence of unaffordability fell from about 38 percent in 2017 to 26 percent in 2024. Europe and Central Asia also improved. East Asia and the Pacific improved. Latin America barely moved.
Sub-Saharan Africa is the stubborn line. Across the countries with data, roughly two thirds of people live in countries where a healthy diet is unaffordable for the average low-income household. The line does not collapse after 2020. It sits there. That is the difference between a global recovery and a human recovery.
The Middle East and North Africa, now grouped by the World Bank with Afghanistan and Pakistan in some classifications, is the other warning. Conflict, price shocks, and weak income growth make a healthy diet harder to buy even when the world line looks calmer.
How this number was made
What it measures. Simple average share of population unable to afford a healthy diet among CoAHD countries in Sub-Saharan Africa.
Calculation. Averaged country prevalence estimates within Sub-Saharan Africa; this is not a population-weighted official regional aggregate.
The displayed line is monotone-cubic smoothed for legibility only — it never moves a data point.
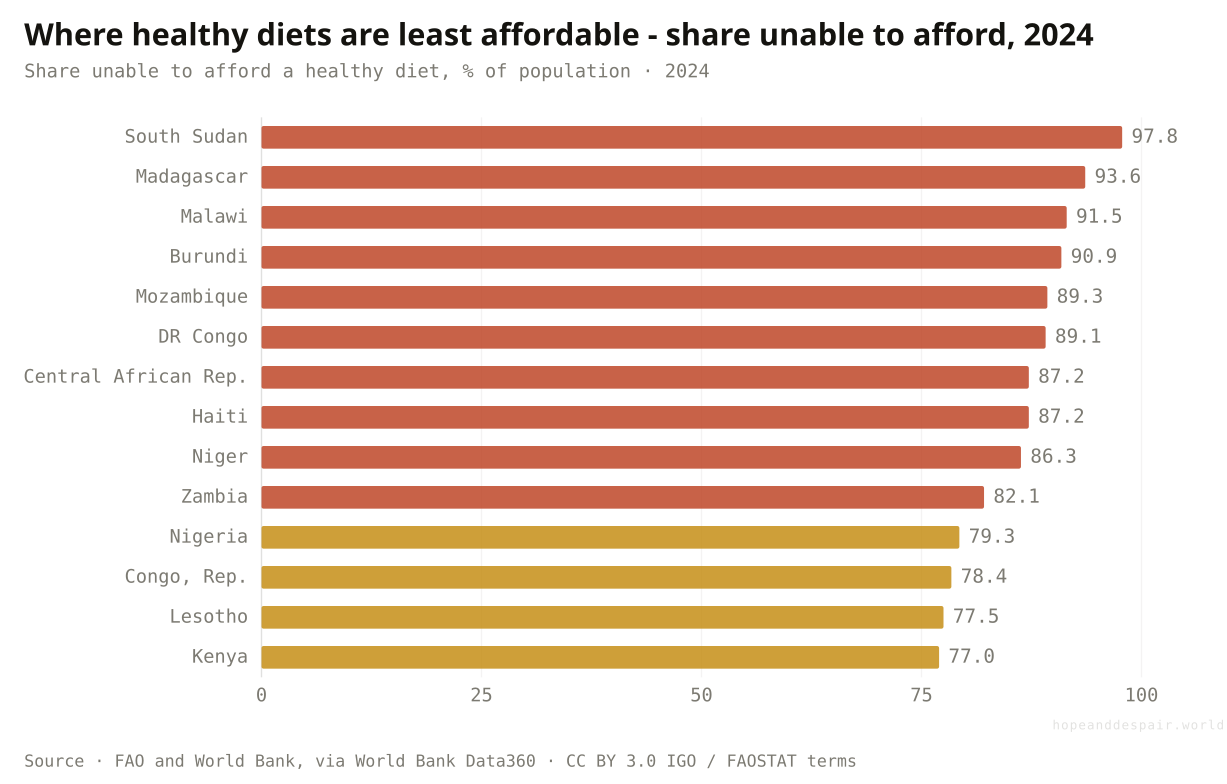
The worst prevalence numbers are almost all in Sub-Saharan Africa. In South Sudan, Madagascar, Malawi, and Burundi, more than nine in ten people are priced out.
Several regions are moving in the right direction, and South Asia’s improvement is large.
The region with the highest unaffordability is the one with the least movement.
These regional lines are simple averages of countries with data, not official population-weighted regional aggregates.
Where are the most people priced out?
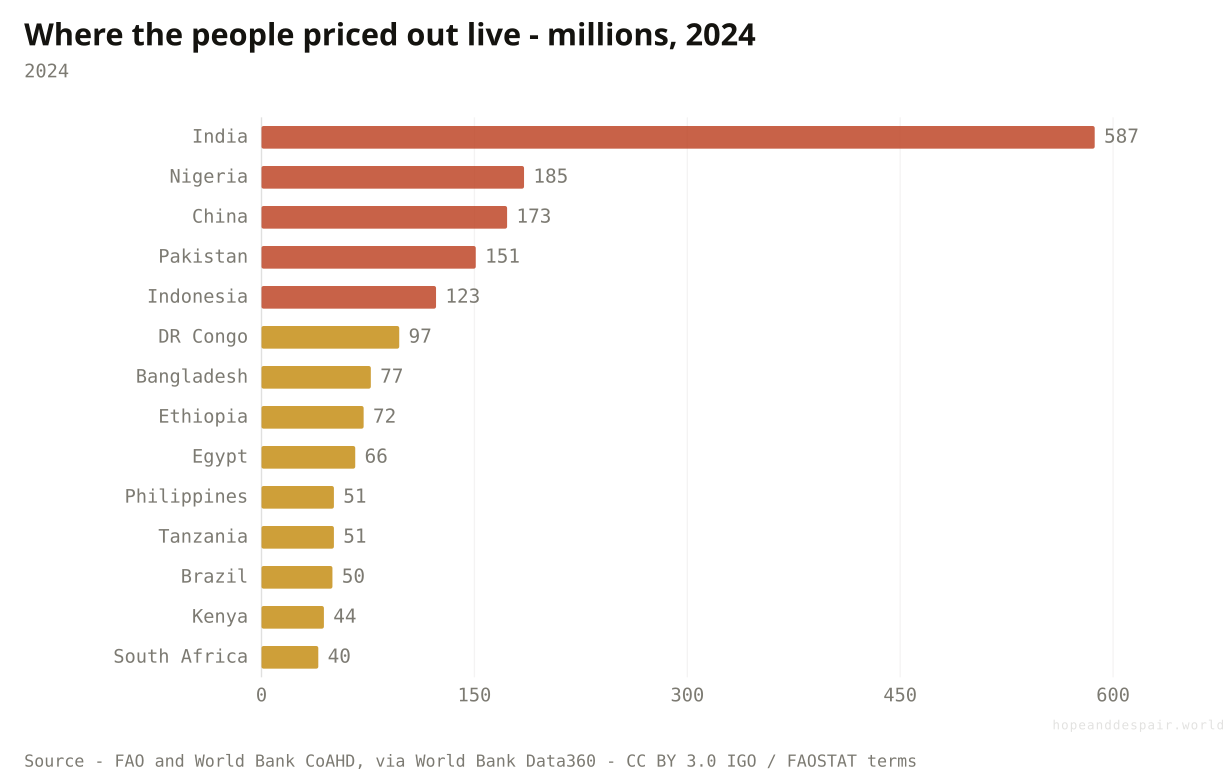
By headcount, this is a big-country story: India, Nigeria, China, Pakistan, and Indonesia sit at the top.
Prevalence tells you where the risk is most intense. Counts tell you where the people are. They are not the same story.
South Sudan has the highest share of people unable to afford a healthy diet. But India has the largest number: about 587 million people in the country rows in 2024. Nigeria follows with about 185 million, then China, Pakistan, and Indonesia. Together, the top five account for well over a billion people.
This is why a food policy story cannot be only a poverty story and cannot be only an Africa story. The highest rates are in the poorest and most fragile countries. The largest numbers also sit in populous middle-income countries, where even a modest improvement reaches tens of millions of people.
How this number was made
What it measures. Countries with the largest number of people unable to afford a healthy diet in 2024.
Calculation. Selected the 14 countries with the highest 2024 count of people unable to afford a healthy diet.
Progress in a handful of populous countries can change the global total quickly.
The scale is enormous: the largest single-country bar is bigger than the population of most continents’ regions.
A country can be relatively better by share and still dominate the global count because it is so large.
Where did things get worse after 2022?
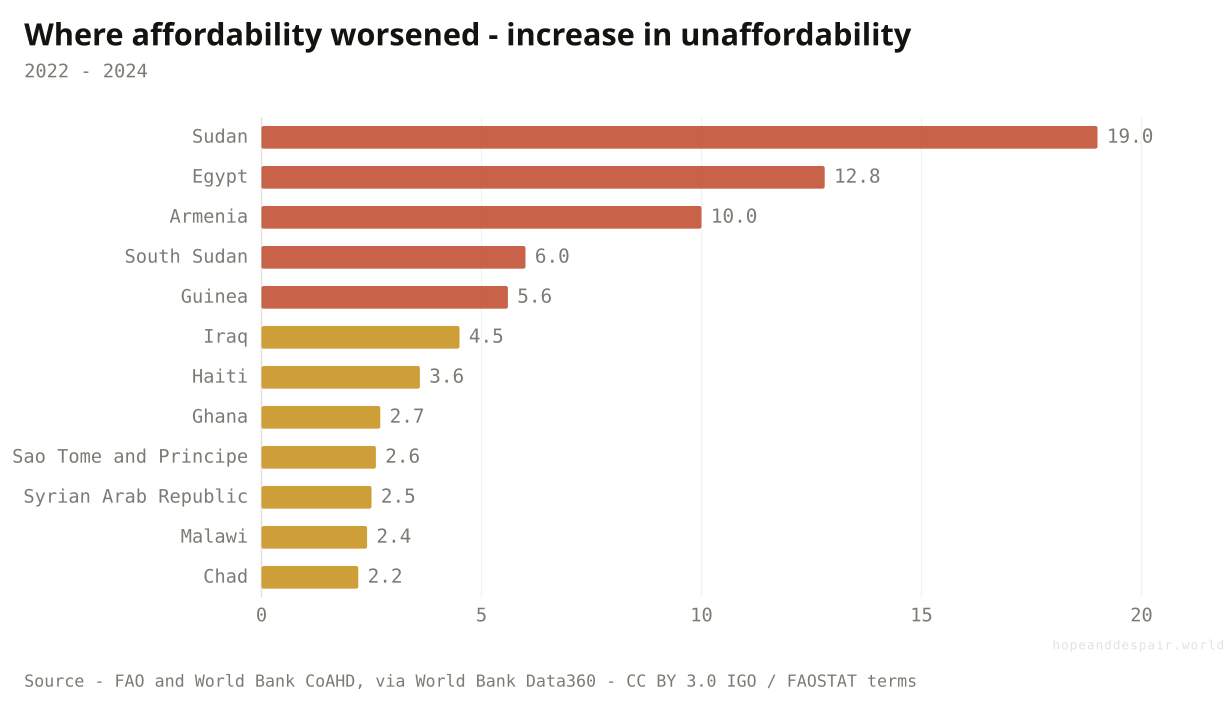
Sudan, Egypt, Armenia, and South Sudan saw the sharpest recent increases in healthy-diet unaffordability.
The global count improved from 2022 to 2024. That sentence is true, and still too smooth.
In Sudan, the share unable to afford a healthy diet rose by about 19 percentage points in two years. Egypt rose by nearly 13 points. Armenia rose by 10. South Sudan, already close to the ceiling, rose another 6 points. These are not small statistical wiggles. They are the places where price, income, conflict, and currency pressure pushed the basket further away.
The other side exists too. India, Bangladesh, China, Indonesia, and several others improved over the same period. That is the bifocal read: the global line can fall because big countries improve while fragile places worsen. The average is not wrong. It is incomplete.
How this number was made
What it measures. Countries with the largest increase in the share unable to afford a healthy diet between 2022 and 2024.
Calculation. Computed percentage-point change in PUA from 2022 to 2024, then ranked countries with positive change.
The countries moving the right way are large enough to bend the world line.
The countries moving the wrong way are often the ones least able to absorb another shock.
Recent estimates are the most policy-relevant and the most model-dependent.
Which foods make the healthy basket expensive?
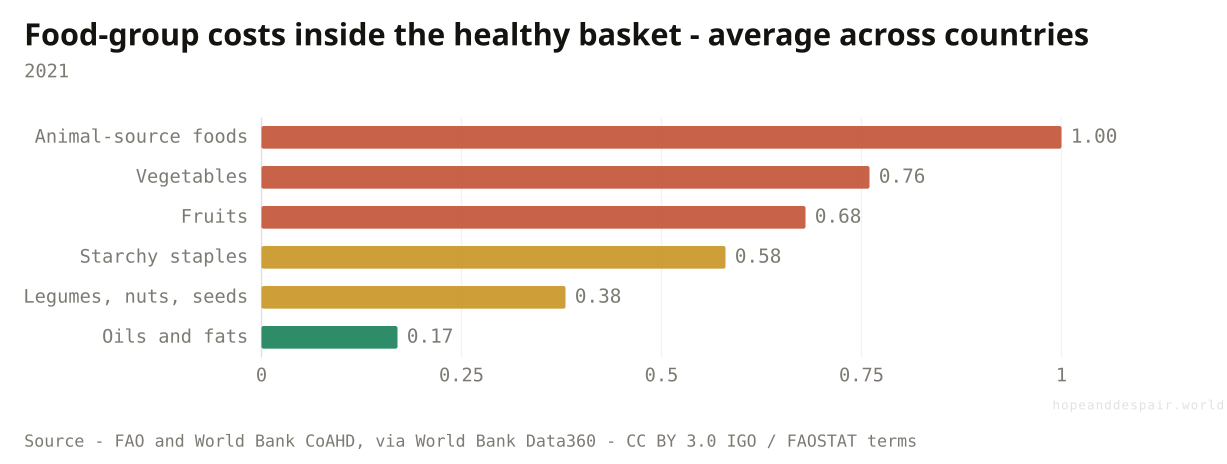
Animal-source foods, vegetables, and fruits are the most expensive pieces of the least-cost healthy diet.
The food-group data is only available for the 2021 ICP price round, so it is a snapshot rather than a trend. It is still useful because it shows why "eat healthy" can be a different instruction from "get enough calories."
Starchy staples are not free, but they are not the costliest part of the healthy basket. Animal-source foods average about $1.00 per person per day. Vegetables average about $0.76. Fruits average about $0.68. Legumes, nuts, and seeds are cheaper on average, but still add cost and require availability.
This is why poor diets often collapse toward starch. Rice, maize, wheat, cassava, and oil can keep a body alive more cheaply than a varied plate can keep it well. The price gap is not a moral failure. It is a budget constraint.
How this number was made
What it measures. Average 2021 PPP-dollar cost of each food group in the Healthy Diet Basket across countries with data.
Calculation. Averaged 2021 PPP-dollar food-group costs across countries for each Healthy Diet Basket component.
The basket points to specific food groups, not a vague command to eat better.
The most protective foods are often the first foods squeezed out of a poor household’s budget.
The food-group snapshot is 2021 only; it cannot tell us which component drove the 2022-2024 cost rise.
Is the problem only hunger?
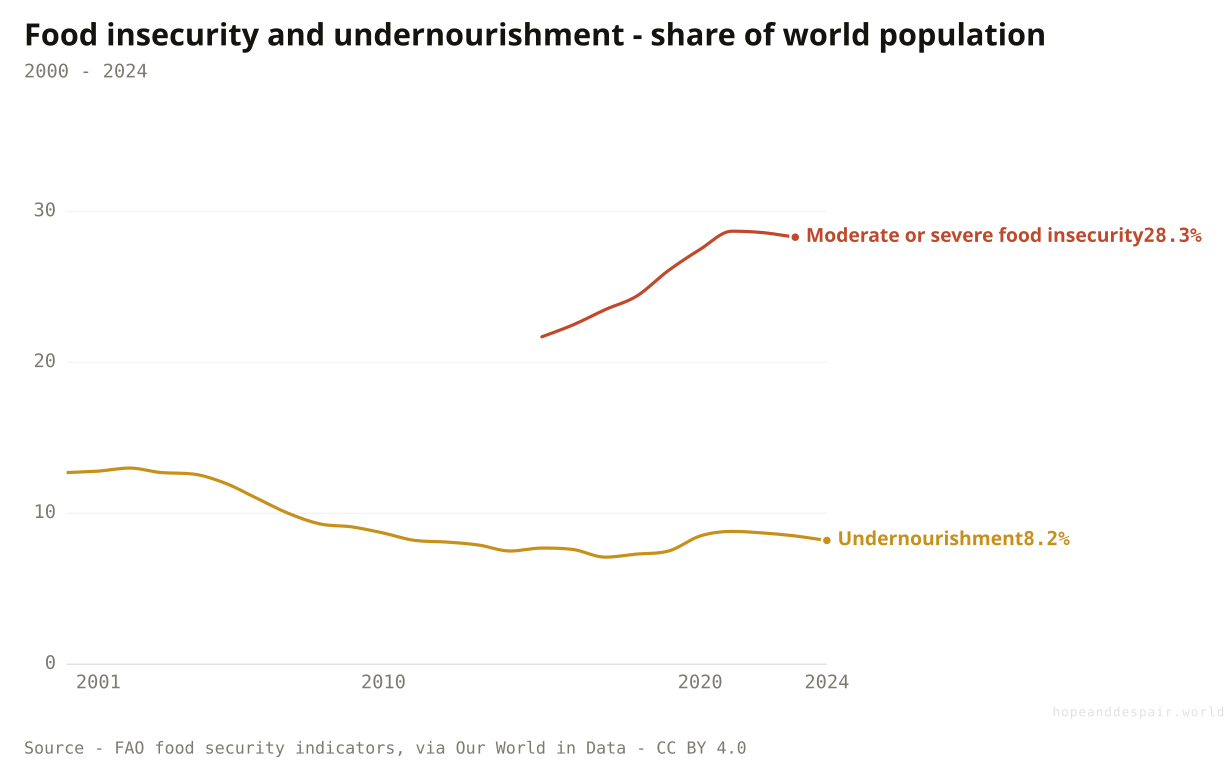
No. Undernourishment is about one in twelve people, while moderate or severe food insecurity reaches more than one in four.
Hunger is the most basic failure: not enough dietary energy for an active life. On the FAO undernourishment measure, the world improved after the pandemic shock and stood at about 8.2 percent in 2024.
Food insecurity is wider. It asks whether people have reliable access to adequate food, not only whether calories are chronically too low. On the moderate-or-severe measure, the world was still around 28 percent in 2023. That is much closer to the healthy-diet unaffordability story than the undernourishment line is.
The gap matters. A person can avoid hunger and still live on a monotonous, cheap, nutrient-poor diet. That is why this article should not end with calories. The real question is not only whether people eat. It is whether they can eat in a way that protects a body over years.
How this number was made
What it measures. Prevalence of moderate or severe food insecurity in the total population, based on the Food Insecurity Experience Scale.
Calculation. Selected World from the OWID/FAO moderate-or-severe food insecurity grapher.
The displayed line is monotone-cubic smoothed for legibility only — it never moves a data point.
The world is better at preventing outright calorie deprivation than it used to be.
A much larger share still lacks reliable access to adequate food.
Different food indicators answer different questions; treating them as one number causes most of the confusion.
Do we have any direct evidence on poor diets?
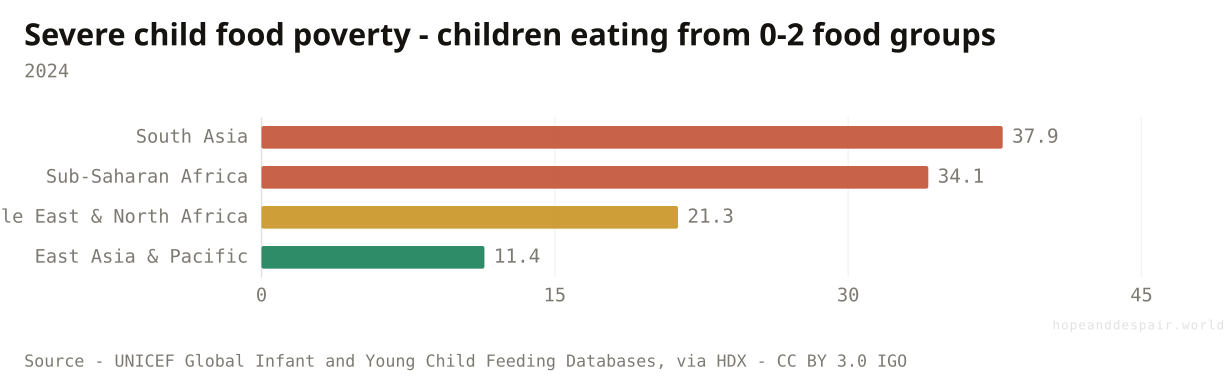
Yes. In UNICEF’s 2024 regional data, severe food poverty affects about 38 percent of children 6-23 months in South Asia and 34 percent in Sub-Saharan Africa.
This is the consumption-side warning. UNICEF’s severe child food poverty indicator counts young children who ate from only zero, one, or two of eight food groups during the previous day. It is not an affordability model. It is closer to the plate.
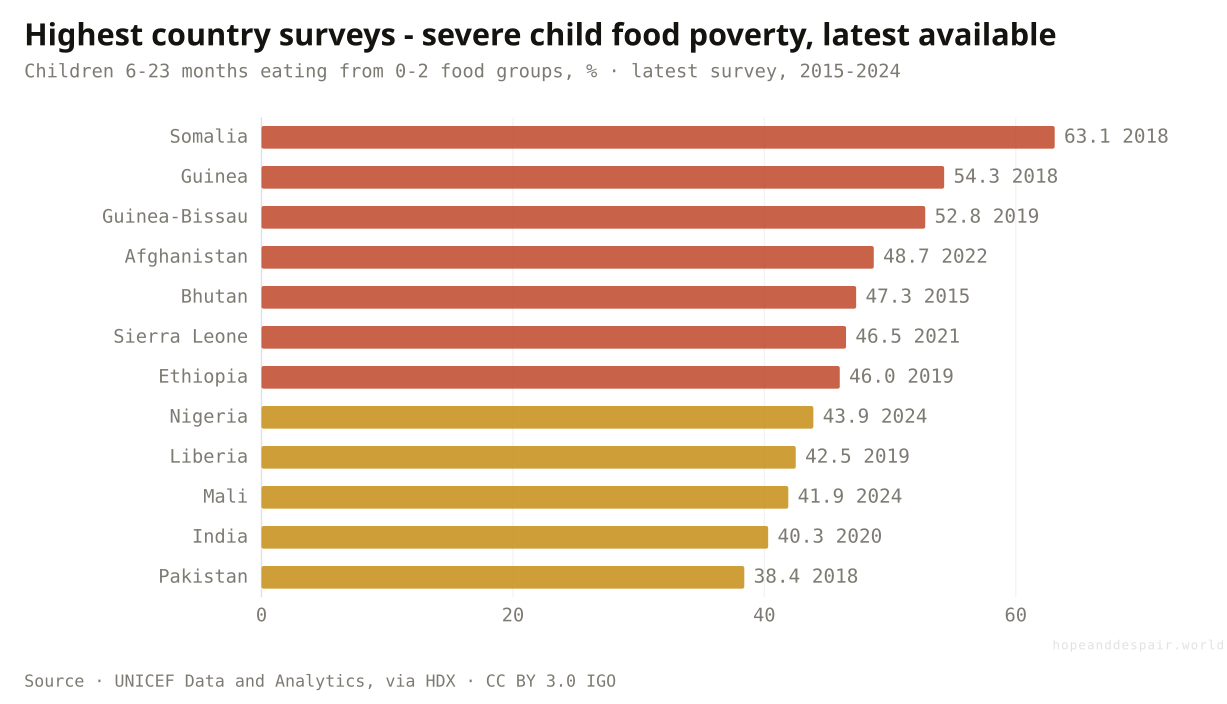
In the 2024 UNICEF regional rows, South Asia is near 38 percent and Sub-Saharan Africa is about 34 percent. The raw pull used here does not include a world row, so the chart should be read as a regional and country-survey lens, not a synchronized global estimate. Among the highest latest country surveys since 2015, Somalia, Guinea, Guinea-Bissau, Afghanistan, Bhutan, Sierra Leone, Ethiopia, Nigeria, Liberia, Mali, India, and Pakistan all show severe restrictions in what young children are fed.
This is why the answer to the headline cannot be "yes" just because the world can produce enough food. A healthy diet is not only calories in the system. It is money, markets, care, time, information, safety, and the daily power to put more than starch in a child’s bowl.
How this number was made
What it measures. Percentage of children 6-23 months who consumed foods and beverages from 0, 1, or 2 out of eight defined food groups during the previous day.
Calculation. Selected total-sex, total-age, total-wealth/residence/maternal-education slice for UNICEF reporting regions, 2024.
Country surveys are from different years, so this is a latest-available ranking, not a synchronized 2024 world table.
Actual diet diversity is measured, not only inferred, and some regions show much lower rates.
For millions of young children, the problem is not abstract affordability. It is yesterday’s bowl.
Child-feeding surveys, CoAHD affordability, and adult diet-quality estimates are related, but they are not interchangeable.
One question, read by the fields that actually study it. Each voice is given both its most hopeful and its darkest honest reading — with a note on how settled the evidence underneath is.
the hopeful readThe CoAHD indicators are unusually clear: price, income, and affordability are defined in a comparable way across countries.
the darker readThe newest estimates depend on food price indexes, poverty-line assumptions, income distributions, and imputation. They are not direct household shopping records.
the hopeful readThe basket is based on food groups and dietary guidelines, so it points beyond calories.
the darker readA least-cost healthy diet can still miss the real barriers: preferences, cooking fuel, time, infant feeding knowledge, food safety, and aggressive marketing of cheap ultra-processed foods.
the hopeful readRising incomes in populous countries can move the global affordability number quickly.
the darker readWhere poverty, conflict, and food inflation overlap, affordability can worsen even while the world improves.
the darker readThe dataset calls it unaffordability. At home it is simpler: the child eats what the money can stretch to.
Strongest case for hope
The strongest case for hope is that the world finally has a concrete, comparable affordability measure for healthy diets, and the global count is moving down again. South Asia’s improvement shows that very large populations can move quickly when incomes and food systems improve together.
Strongest case for despair
The strongest case for despair is that the remaining problem is not small, temporary, or evenly distributed. Roughly one third of humanity is still priced out; the highest-prevalence countries are clustered in the poorest and most fragile places; and direct child-feeding data shows diet poverty on the plate, not only in the model.
The verdict would become more hopeful if the next CoAHD releases showed two things at once: falling global unaffordability and a clear decline in Sub-Saharan Africa and low-income countries. A world average improvement with Africa stuck high should not count as a full win.
It would become darker if food-price inflation returns, if conflict-affected countries keep worsening, or if direct diet-quality surveys show that affordability gains are not turning into more diverse meals.
The biggest missing piece is better direct consumption data. CoAHD tells us who can afford the model basket. To answer who is actually eating well, the world needs more frequent, comparable dietary intake and child-feeding data.
Everything done to the numbers between the source and the chart, disclosed in full. Where a choice is editorial rather than measured, we say so.
- Core dataset
- The article uses FAO/World Bank Cost and Affordability of a Healthy Diet data from World Bank Data360 dataset
FAO_CAHD, pulled on 2026-07-01. The raw pull contains 7,067 observations, 175 reference areas, nine indicators, and years 2017-2024. - Cost line
- Figure 1 averages the national PPP-dollar cost of a healthy diet across countries/economies with data in each year. It is a country mean, not a household-weighted mean.
- People unable to afford
- Figure 2 sums country-level NUA rows where available. The official 2024 headline of about 2.6 billion people comes from the FAO/World Bank/SOFI aggregate; the country-row sum is lower because the raw country table has coverage gaps.
- Regional lines
- Figure 3 uses current World Bank country metadata to group countries and then computes a simple average of country prevalence values within each region. It is meant to show divergence, not to replace official population-weighted regional aggregates.
- Country rankings
- Figure 4 ranks raw 2024 country count rows. Figure 5 computes 2022-2024 percentage-point change among countries with both years available.
- Food-group costs
- Figure 6 uses the six 2021 food-group cost indicators only. These are not updated annually because disaggregated ICP food-price data are not available every year.
- Food security and child diet data
- Figure 7 uses FAO food security indicators as republished by Our World in Data. Figure 8 uses UNICEF severe child food poverty data from HDX/UNICEF SDMX, total-sex and total-subgroup slices. The SDMX pull used here has UNICEF regional rows and country surveys, but no world row for this indicator.
- FAO and World Bank - Cost and Affordability of a Healthy Diet (CoAHD) — data360.worldbank.org/en/dataset/FAO_CAHD ↗ · CC BY 3.0 IGO / FAOSTAT terms · vintage 2026-07-01Raw country/economy data used for CoAHD charts.
- World Bank - Food Prices for Nutrition DataHub — www.worldbank.org/en/programs/icp/brief/foodpricesfornutrition ↗ · World Bank terms · vintage 2026-07-01Official DataHub notes and 2024 headline figures.
- World Bank Data Blog - Can everyone afford to eat healthy? — blogs.worldbank.org/en/opendata/can-everyone-afford-to-eat-healthy--new-data-show-progress--but- ↗ · World Bank terms · vintage 2026-07-01Used for the official 2024 global headline: $4.46/day and about 2.6 billion unable to afford.
- FAO - CoAHD July 2025 release note — www.fao.org/statistics/events/events-detail/cost-and-affordability-of-a-healthy-diet-%28coahd%29.-july-2025-update/en ↗ · FAO terms · vintage 2026-07-01Release cadence and definitions.
- Our World in Data - FAO food security indicators — ourworldindata.org/grapher/share-of-population-with-moderate-or-severe-food-insecurity ↗ · CC BY 4.0 · vintage 2026-07-01Food insecurity and hunger world series.
- UNICEF - Severe food poverty — data.humdata.org/dataset/unicef-nt-cf-fg-0-t-2 ↗ · CC BY 3.0 IGO · vintage 2026-07-01Children 6-23 months consuming foods from 0-2 of eight food groups.
- Global Nutrition Report 2021 - Health and environmental impacts of diets worldwide — globalnutritionreport.org/reports/2021-global-nutrition-report/health-and-environmental-impacts-of-diets-worldwide ↗ · Global Nutrition Report terms · vintage 2026-07-01Context on global shortfalls in fruit, vegetable, legume, nut, and seed intake.
- World Health Organization - Healthy diet fact sheet — www.who.int/news-room/fact-sheets/detail/healthy-diet ↗ · WHO terms · vintage 2026-07-01Plain definition of healthy diet and fruit/vegetable guidance.
Cite this page
Reference
Hope & Despair. “Can the world afford to eat healthy?.” Hope & Despair, 2026. https://hopeanddespair.world/questions/can-the-world-afford-to-eat-healthy.
BibTeX
@misc{hopeanddespair:can-the-world-afford-to-eat-healthy,
  author       = {{Hope & Despair}},
  title        = {{Can the world afford to eat healthy?}},
  year         = {2026},
  howpublished = {\url{https://hopeanddespair.world/questions/can-the-world-afford-to-eat-healthy}},
  note         = {hopeanddespair.world}
}
Original prose, code, and chart designs are released under CC BY 4.0 ↗ — reuse freely with attribution. Source datasets keep their own licences, listed above. Add your access date when citing.
- First published from FAO/World Bank CoAHD, FAO food security indicators, and UNICEF severe child food poverty data.
Generated from the commit history — every edit to a number, a word, or a chart is tracked in the open. Browse the full history & diffs on GitHub →
in plain words
Still lost? Read this.
The world now has a price tag for the cheapest healthy diet in each country. In 2024, that diet cost about $4.46 per person per day on average. Around 2.6 billion people still could not afford it.
That does not mean 2.6 billion people ate no food. It means that after allowing for other basic needs, they did not have enough income to buy the cheapest basket that meets healthy-diet guidelines. Many people can afford calories before they can afford variety.
The hopeful part is that the global number is improving again. The hard part is where it is not improving: the poorest countries, especially in Sub-Saharan Africa, remain stuck with very high unaffordability. And when you look at young children in the UNICEF regional and country-survey data, the problem shows up directly on the plate: too many are eating from only one or two food groups.
So the honest answer is: the world is getting a little better at making healthy diets affordable, but no, the world cannot yet afford to eat healthy. Not in any meaning of “world” that includes the people most exposed to hunger, poverty, and high food prices.