Question 01 · War & Peace
Is humanity becoming less violent?
One question, fifteen charts, every one real. The long arc of violence falls hard — and the closer you stand, the worse it looks. This is the verdict read at every distance at once.
you read
- “Violence” here means mostly direct lethal violence — homicide and war dead. Coercion, structural harm, and much violence against women, especially inside the home, sit outside these lethal-violence curves.
- Pre-1900 numbers are regional and sparse. The deep arc is reconstructed from European records and archaeology — reliable in direction, rough in level.
- Every chart here runs on real ingested data from openly-licensed sources (Our World in Data, UCDP, the World Bank, UNHCR, SIPRI), with the source, data package, and lineage downloadable under each figure. The evidence-panel overview up top — the hero curve and the four small signal sparklines — is a hand-composited orientation graphic, not a single measured series.
- The composite verdict is an editorial reading of the signals, not a computed index. Full method below.
evidence
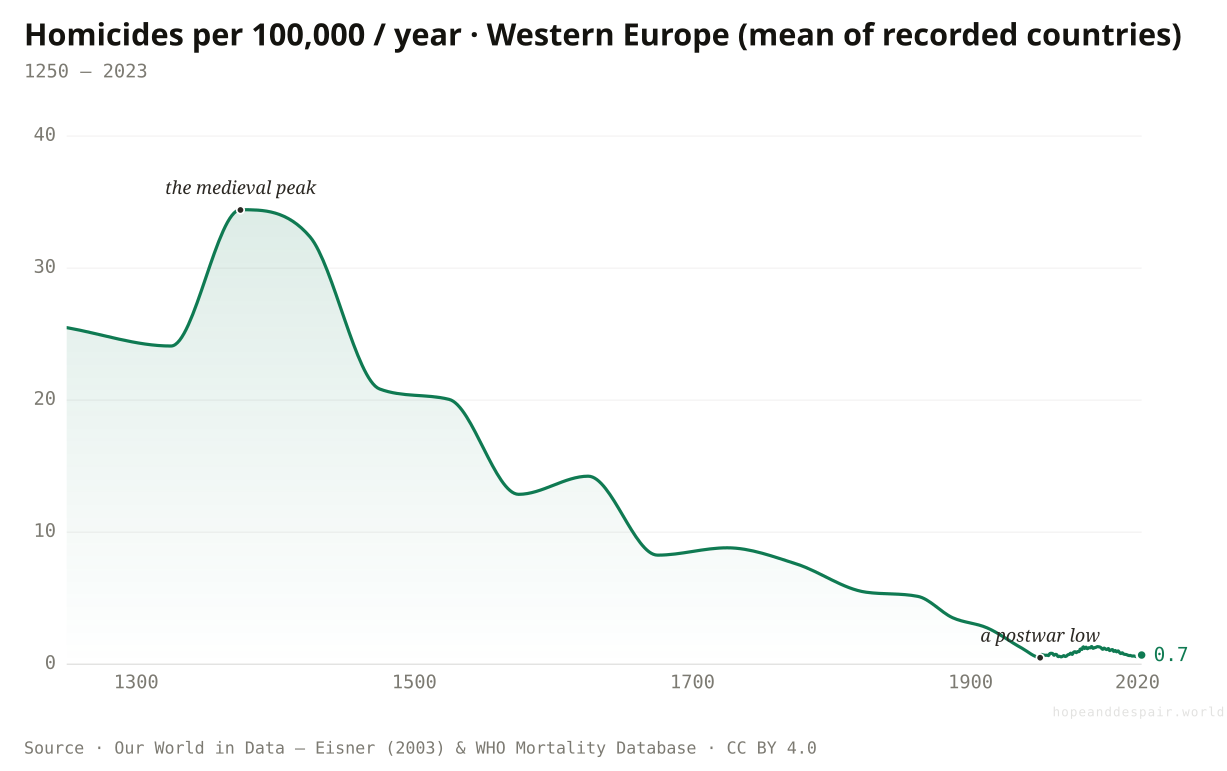
Zoom out to the millennium and the story is clear: homicide in Europe fell from about 25 per 100,000 people in 1250 to under 1 today. Zoom in to the last few years and the picture flips: conflict deaths and nuclear threats are rising, and the global decline of the past century is stalling.
Battle deaths, active conflicts, displacement, and military spending have all turned upward at once, which is what makes the recent pattern look like the long peace fraying rather than a single bad year.
2 of 4 signals point to deterioration · 2 toward progress
A calm world average tells you nothing about a street in Khartoum today, where war has pushed violent death far above anything the global line would suggest.
the lived now
A global average is no comfort under a drone. My street is the only dataset that matters.
Over centuries, has everyday violence actually fallen?
Homicide has fallen for seven centuries.
In a medieval town of forty thousand, ten people might be murdered in an ordinary year, and in the worst decades nearer fourteen. A town that size today could go three or four years between killings. A medieval European was something like thirty-five times more likely than you to die at another’s hand — a gap so wide it is less a number than a different climate of life, one in which sudden violence was part of the weather.
What closed it was not a change in the human heart but in who was allowed to answer an insult. Over centuries, kings and courts took the settling of scores out of private hands; the feud and the duel gave way to the magistrate, and killing a rival stopped being a point of honour and became a crime you could hang for. That is how Manuel Eisner, the criminologist whose court records run beneath this chart, reads the long descent: fewer men reaching for a blade, more of them reaching for the law. The small rise since its low around 1950 is the reminder underneath it all — this was hard-won, and it is reversible, never a law of nature.
How this number was made
What it measures. Homicide rate, Western Europe (long run) — unweighted mean across 12 Western European countries per year
Calculation. Unweighted mean of the homicide rate across 12 Western European countries, by year (min 1 country present).
The displayed line is monotone-cubic smoothed for legibility only — it never moves a data point.
The deadliest everyday threat our ancestors lived with has all but vanished from modern life.
This clean line is European; most of the world has no record this deep, and the global rate has nudged up since 1950.
Old counts come from coroners and court rolls; the direction is solid, but the exact numbers are not.
Across the centuries, has war grown more or less deadly?
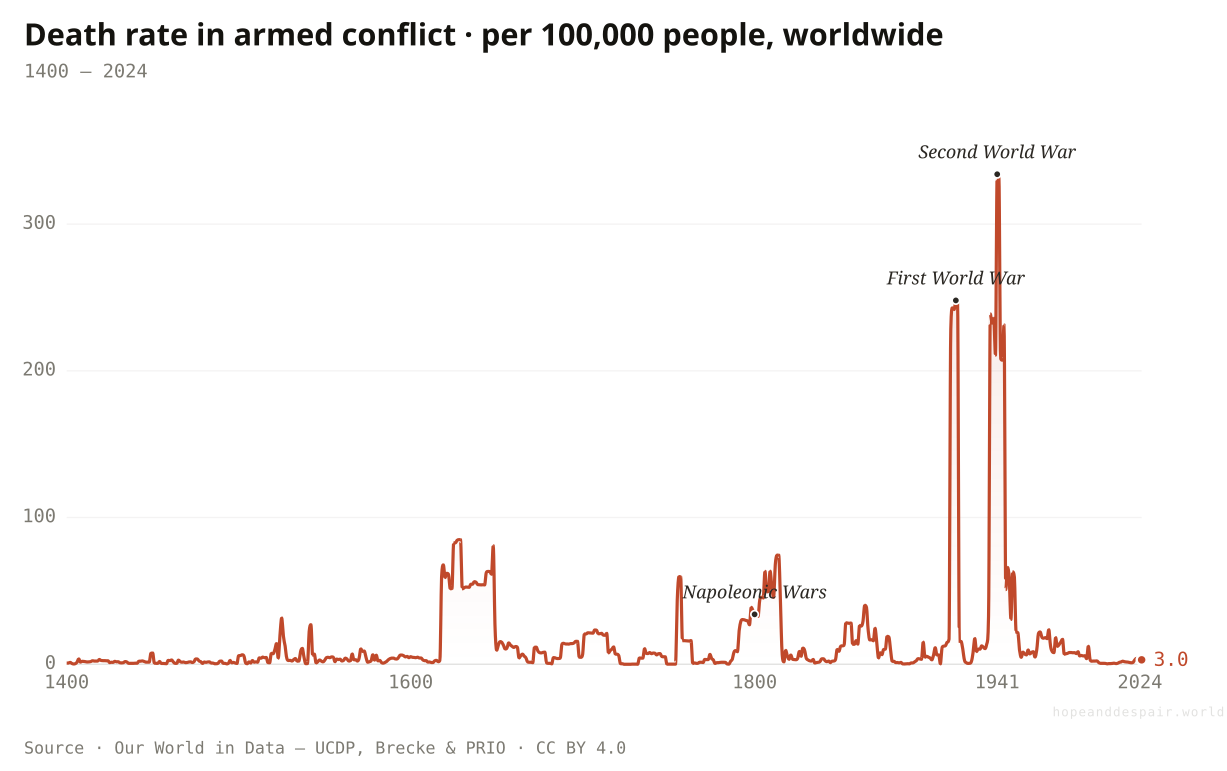
War’s deadliest century is the one we just left.
Measured against the number of people alive, the twentieth century was the most violent in six hundred years of record. The two world wars drove the global death rate from armed conflict to a peak in 1941, over 300 deaths a year for every 100,000 people, a level with no rival going back to 1400. Even the wars of the 2020s have pushed today’s rate only to around two.
Then it broke the other way. After 1945 the rate collapsed and stayed low for the rest of the century, the long stretch historians call the Long Peace: no war between the great powers, and nothing close to the world wars’ toll. The line is two stories at once. War became, for a while, more industrial and more lethal than ever, and then more avoided than ever. Which of those is the real trend is what the last few years are testing. The line stops in 2024, but the story has not: Ukraine pushed the rate sharply upward in 2022, and the wars still burning in 2025, in Sudan, Gaza, and the Sahel, have held it well above the lull of the 2000s. The charts that follow carry that recent toll in full.
How this number was made
What it measures. The estimated number of deaths in ongoing armed conflicts that year.
Calculation. Selected entity World. Extended with death-rate-in-armed-conflicts-by-type after 2000.
The displayed line is monotone-cubic smoothed for legibility only — it never moves a data point.
Since 1945 the per-capita toll of war has stayed a fraction of what the world wars exacted.
The bloodiest year on this six-century chart is within living memory, and the recent line is rising.
Per-capita rates flatten the deep past, where one local war could devastate a region while the world average stayed low.
Are the world’s wars killing fewer people?
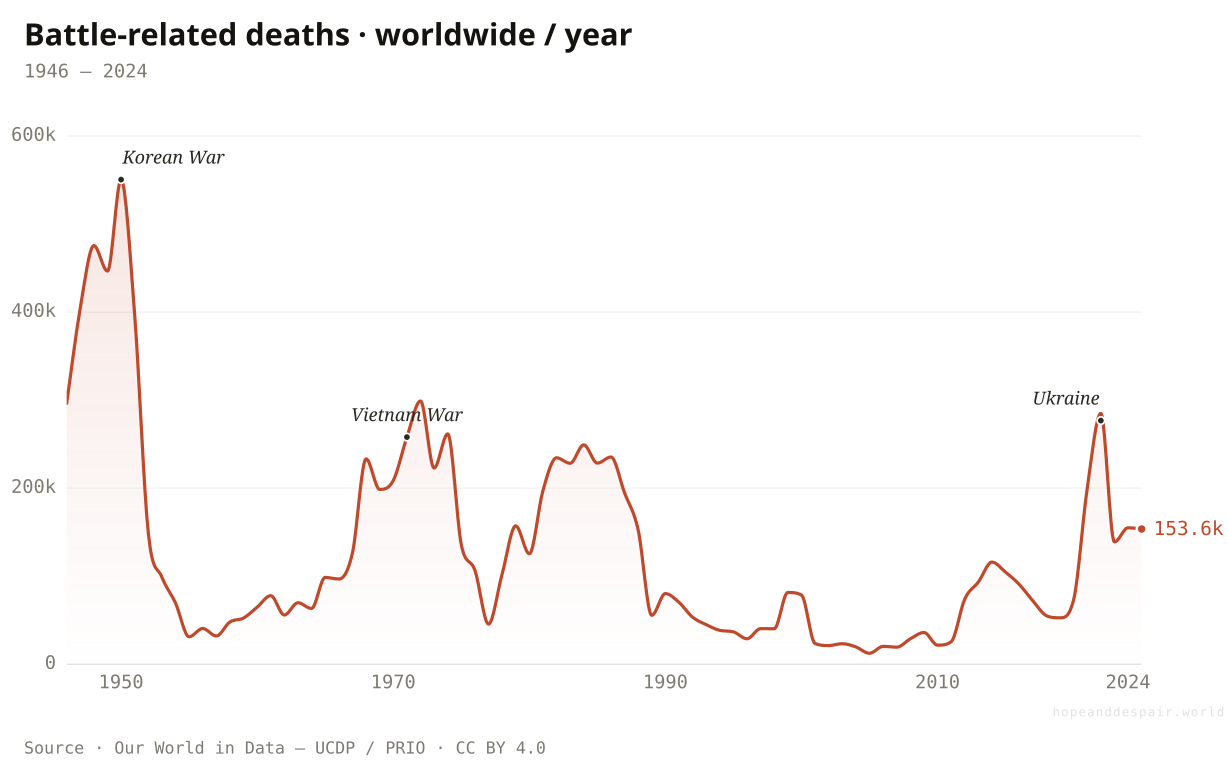
War deaths fell far below their Cold-War peaks — then turned back up.
In 1950, about half a million people died in battle, most of them in the Korean War. The toll then fell for half a century, down to roughly twelve thousand by 2005, a forty-fold drop that looked like proof the world had left mass warfare behind.
That fall had a cause worth naming. After 1945 the great powers stopped fighting each other head-on, held back partly by the fear of nuclear weapons, and the wars that remained were mostly smaller civil and proxy conflicts. What the right of the chart shows is that arrangement straining: Syria, then Ethiopia’s Tigray war, then Russia’s invasion of Ukraine and the war in Gaza have pushed the annual toll back above a hundred thousand. One thing the line hides is that it counts only deaths in combat, not the larger numbers who die from the hunger and disease that war drags behind it.
How this number was made
What it measures. Battle-related deaths, World
Calculation. Selected entity World.
The displayed line is monotone-cubic smoothed for legibility only — it never moves a data point.
For most of the last eighty years, the global toll of war has fallen, and even today’s number is barely a quarter of the Cold War peak.
The direction has reversed, and no one can say whether the new wars will burn out or keep climbing.
Battle-death counts miss the far larger toll of displacement, hunger, and disease that wars cause — so the full human cost may be rising even when the fighting shrinks.
How much did the last five years actually undo?
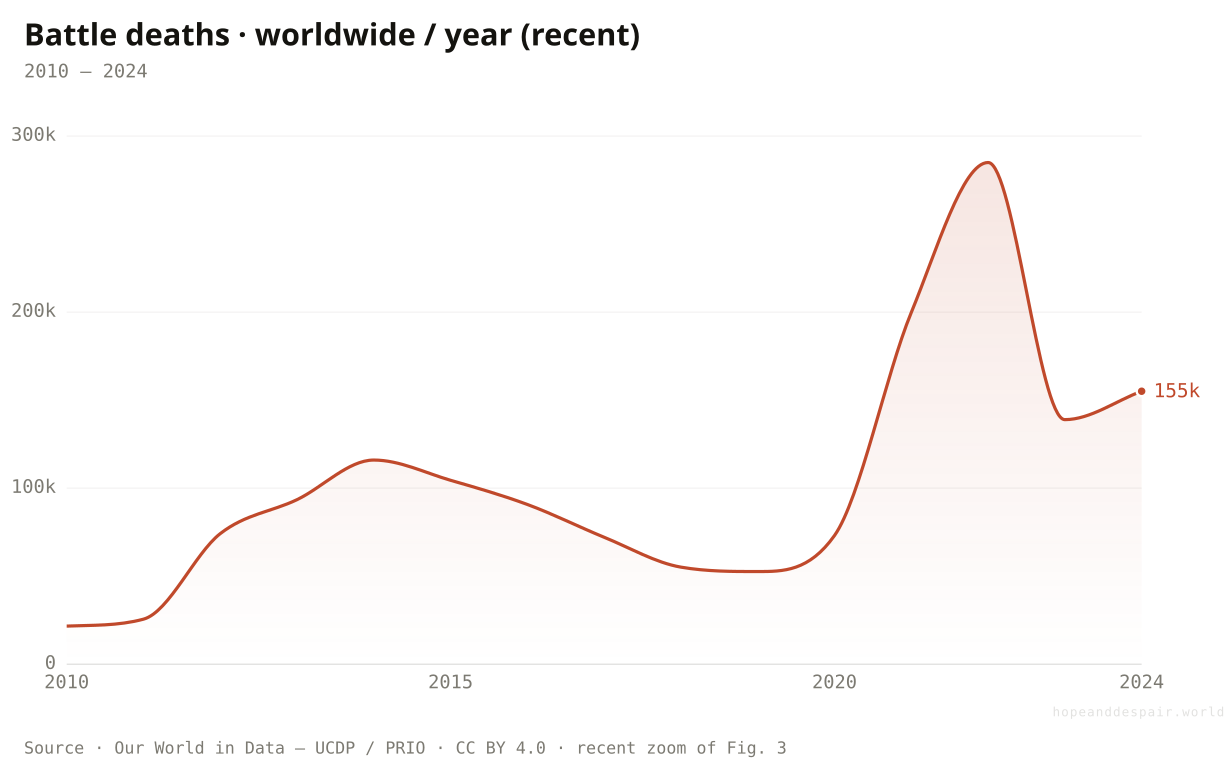
Three wars reversed two decades of progress.
In 2010, about 21,000 people died in the world’s wars. Then came Syria, Yemen, Ethiopia, Ukraine, and Gaza. By 2022 the annual toll had hit 276,893, and even after easing it sat above 128,000 in 2024. That is still well short of the 550,000 killed in 1950, but the line on this zoomed-in view climbs more than tenfold in a decade. The long decline historians celebrate is real; these last years show how fast it can be undone.
How this number was made
What it measures. Battle-related deaths, World
Calculation. Selected entity World.
The displayed line is monotone-cubic smoothed for legibility only — it never moves a data point.
The 2024 figure is still below the Cold War average, and most of the world remains far more peaceful than it was.
Three wars — Syria, Ukraine, and Gaza — account for most of the rise, and none shows signs of ending soon.
How much of the post-2005 rise reflects better data collection and counting, not more actual killing.
If deaths fell, why does the world feel more violent?
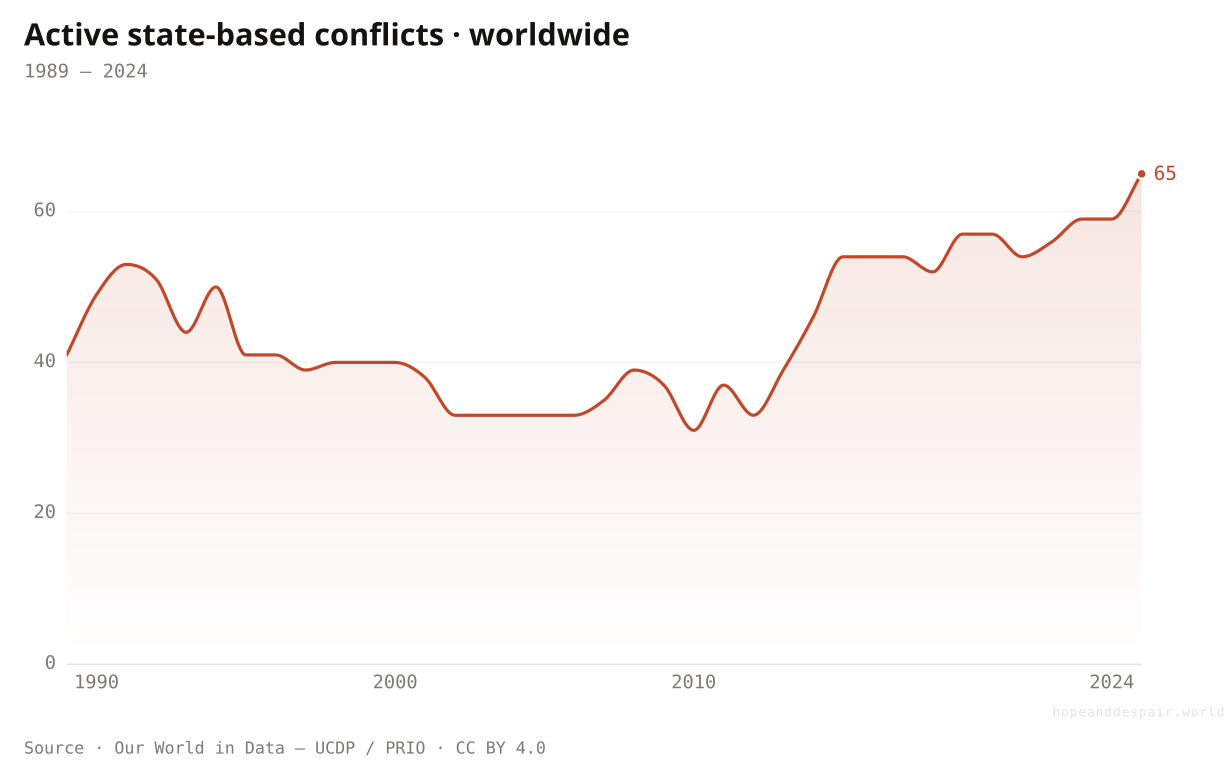
There are more active conflicts now than at any point in the record.
In 2010 the world had 31 state-based conflicts running, the fewest in the modern record. By 2024 it had 61, the most in the thirty-six years anyone has counted this way; the number nearly doubled even through stretches when the death toll was falling.
Two things drive the multiplication. Insurgencies spread: the jihadist war that began in Mali in 2012 now burns across its neighbours, and every border it crosses adds another conflict to the ledger. And outside powers keep joining other people’s civil wars, with money, drones, and mercenaries, which is precisely what makes wars longer and harder to settle. So a falling death toll and a rising conflict count are not a contradiction. The world is not always fighting bigger wars. It is fighting more of them, in more places, with more hands in each.
How this number was made
What it measures. Active state-based conflicts, World
Calculation. Selected entity World.
The displayed line is monotone-cubic smoothed for legibility only — it never moves a data point.
The rise is concentrated in a small number of countries, not spread everywhere — most of the world remains in a long peace.
The number of active conflicts has doubled in fourteen years, and the record keeps breaking in the wrong direction.
Conflict counts treat a skirmish and a full war the same way, so the rise may be more about fragmentation than a true increase in killing.
If the death rate is falling, why are the human totals rising?
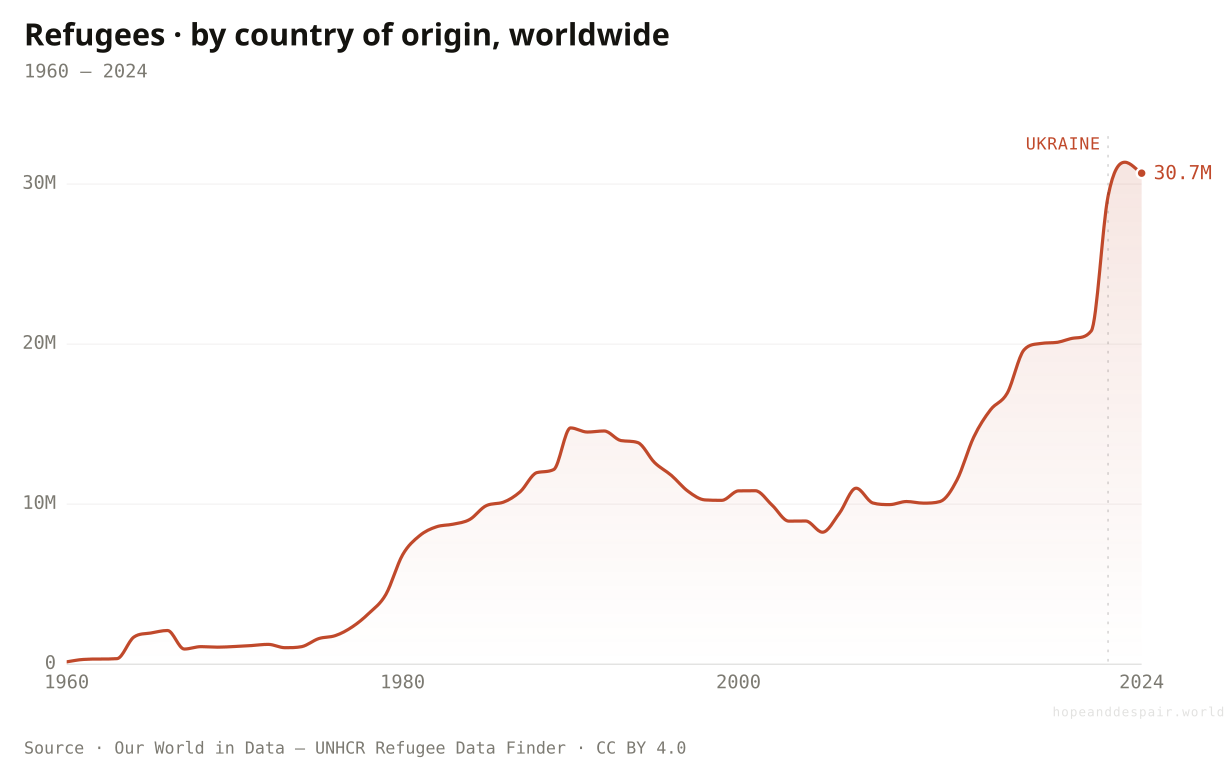
More people are refugees now than at any time on record.
In 1960, the world counted 150,000 refugees. Today the figure has crossed 30 million, a two-hundred-fold rise, and it has roughly tripled just since 2010. The surge is not mainly that the world grew more violent per person; it is that more states have shattered and more people have somewhere worse to flee. The death rate from violence has fallen. The number of people forced across a border to escape it has never been higher.
How this number was made
What it measures. Refugees by country of origin, World — summed across 211 countries per year
Calculation. Sum over 211 ISO3 countries of origin, by year.
The displayed line is monotone-cubic smoothed for legibility only — it never moves a data point.
The refugee count is also a measure of survival: more people escape death and make it across a border to be counted.
Thirty million is the highest number on record, and it is still rising.
How many of those 30 million would have died in earlier eras rather than fleeing is unknowable — the same violence now produces refugees where it once produced corpses.
Where are the world’s wars actually killing people?
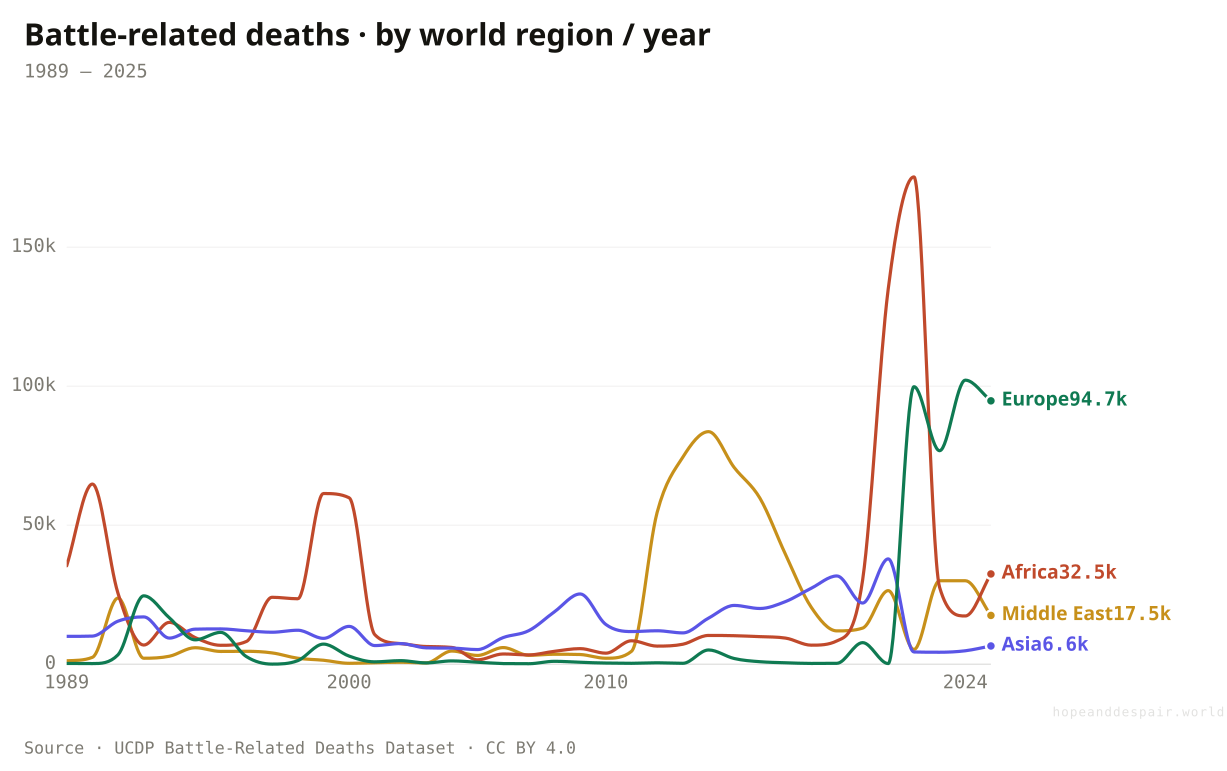
War never spreads evenly. It concentrates, and the place keeps moving.
Follow the deadliest place to fight a war and it keeps moving. In the mid-2010s it was the Middle East, where Syria and the war against ISIS killed more than 80,000 people in 2014 alone. Then the centre of gravity slid to Africa: Ethiopia’s Tigray war helped make 2022 the deadliest year on this chart, with around 175,000 killed. By 2024 it had moved again, to Europe, where the trenches of Ukraine were taking more than 100,000 lives a year.
This is what a flat global line hides. The world’s total can hold almost steady while underneath it the killing migrates from one region to the next, each taking its turn to carry most of the dead. For the people living through it there is no global average — only the war on their own doorstep, which in that moment is the entire world. The map of war is never blank; it just keeps redrawing where the darkest patch falls.
How this number was made
What it measures. Best estimate of deaths in state-based armed conflict (combatants and civilians killed in the fighting).
Calculation. Selected entity Middle East.
The displayed line is monotone-cubic smoothed for legibility only — it never moves a data point.
No region stays the epicentre for long; the worst place to be is never fixed.
There is always an epicentre, and the most recent one is among the deadliest in the whole record.
Where a war’s deaths land depends on how its region is coded; a conflict that spills across borders can sit in one bucket or be split.
What are the world’s wars actually killing people right now?
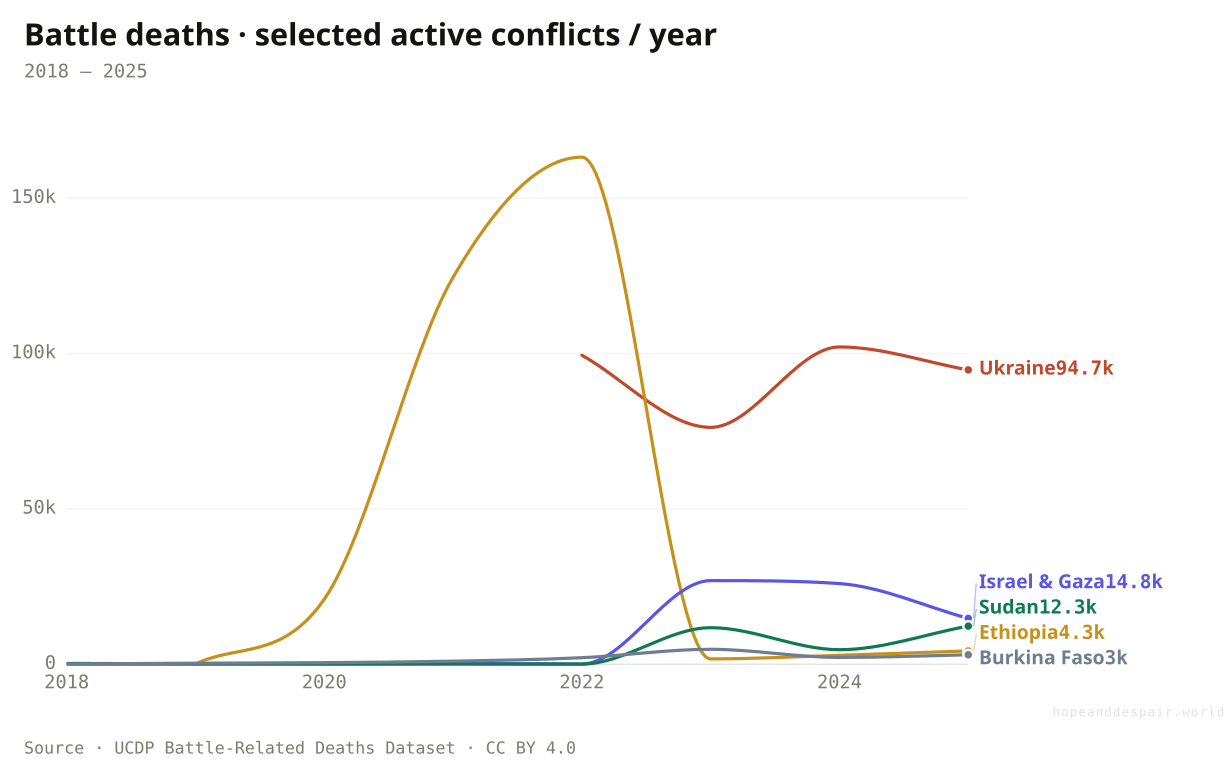
A cluster of wars broke out in the 2020s, and most are still burning.
Name the deadliest wars of the decade and you have named most of the recent rise. Ethiopia’s Tigray war was, for a moment in 2022, the bloodiest on earth: more than 160,000 people killed in a single year before a ceasefire ended it. Russia’s invasion of Ukraine has been the most relentless, taking close to 100,000 lives a year since 2022 with no end in sight. Since 2023, Sudan’s civil war and Israel’s war in Gaza have each killed tens of thousands more, while a jihadist insurgency keeps spreading across the Sahel.
What makes this stretch dangerous is not any single war but the pile-up. For two decades after the Cold War the world rarely had more than one conflict killing at this scale; now several burn at once, on three continents, and the chart names only the largest. Beyond it, eastern Congo is sliding back toward full-scale war, Myanmar’s junta is losing a civil war almost no one watches, and al-Shabaab still bleeds Somalia. A few are winding down: Syria’s long war collapsed when Assad fell in late 2024, and the Israel-Iran strikes of 2025 flared and then stopped short of the regional war everyone feared. The through-line is a world with too many fires lit at once, and not enough being put out.
How this number was made
What it measures. Best estimate of deaths in state-based armed conflict (combatants and civilians killed in the fighting).
Calculation. Selected entity Russia (Soviet Union), Ukraine.
The displayed line is monotone-cubic smoothed for legibility only — it never moves a data point.
Several of these wars have already burned out; Tigray’s ceasefire took the deadliest of them off the map within a year.
Not since the Cold War have so many large wars run at once, and the two biggest show no sign of ending.
Battle-death counts in active wars are contested and usually revised upward later; these numbers are likely floors.
What about the wars no state is fighting?
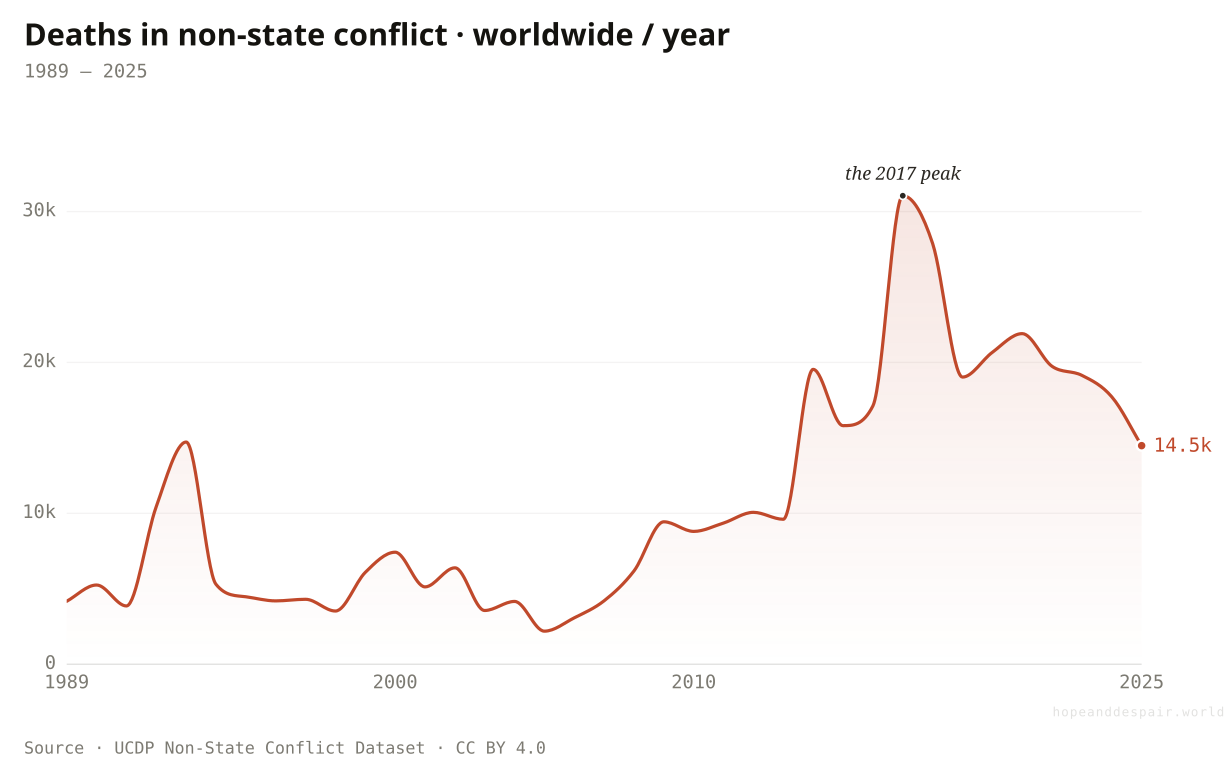
Between war and murder sits a violence the categories barely name.
When two cartels fight over a smuggling route, no state is at war and no murder is ordinary. Researchers call it non-state conflict: organised armed groups killing each other, with the government on neither side. In 1989 this kind of fighting took about 4,200 lives worldwide. In 2017, its worst recorded year, it took just over 31,000, much of it in Mexico’s cartel wars and in militia fighting across Africa.
It is the violence our categories are built to miss. Too organised to sit among ordinary murders, too stateless to count as war, it fell between the lines of both for decades, which is why this chart starts only in 1989. The toll has eased since the peak, to around 14,500 last year, but it never goes quiet. Whether the world is at peace depends a great deal on whether you count the wars nobody declares.
How this number was made
What it measures. Best estimate of deaths in conflicts between two armed groups, neither of them a state.
Calculation. Selected entity World.
The displayed line is monotone-cubic smoothed for legibility only — it never moves a data point.
Even at its worst, this fighting kills a fraction of what state wars take, and the toll has fallen by more than half since 2017.
The deadliest years in this record are recent ones, and the gangs and militias doing the killing answer to no peace treaty.
Whether a body lands in this column or in the homicide column is a coder’s judgment call, made in places where counting anything is hard.
Is “the homicide rate” even a single number?
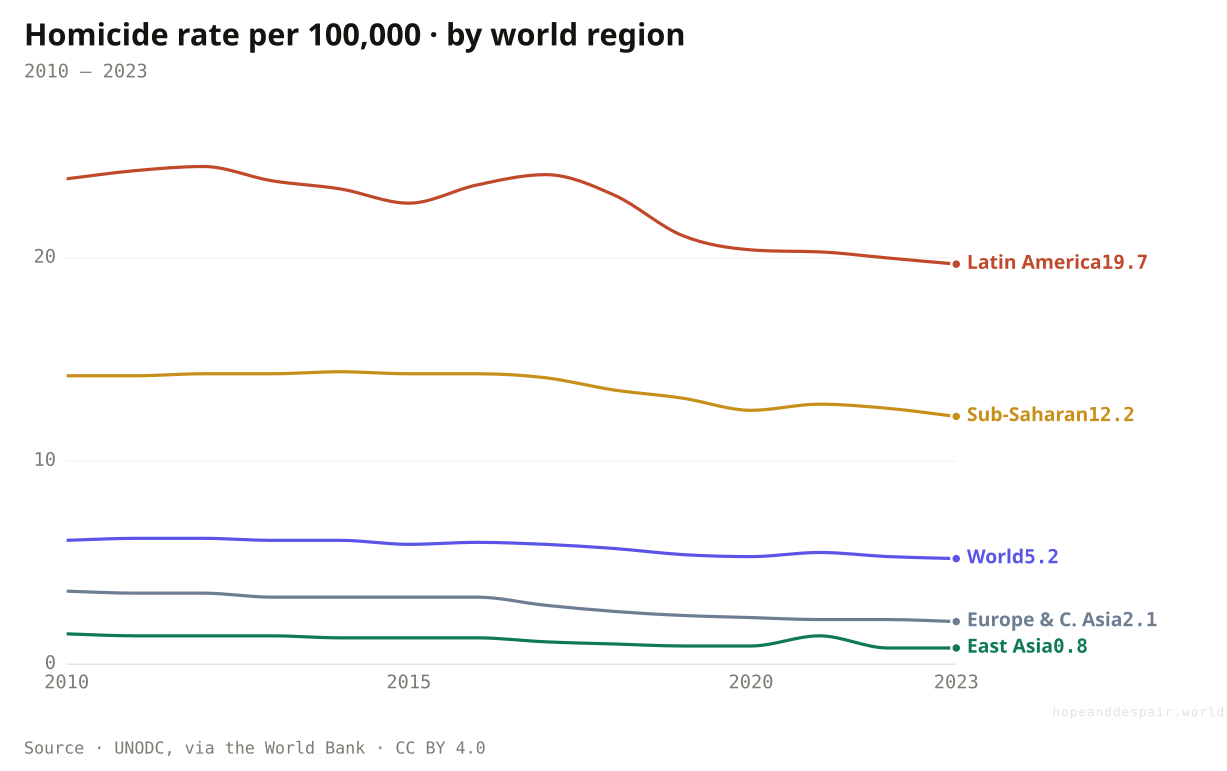
Where you live changes your odds more than anything else about you.
Wars cluster in a handful of places, and so does ordinary murder. There is no such thing as the homicide rate. In Latin America and the Caribbean, around twenty people per 100,000 are murdered every year; in East Asia and the Pacific, fewer than one. That is a twenty-fold gap between whole regions, and country to country it stretches past a hundredfold. Your odds of being killed are set more by where you were born than by almost anything else about you.
These are recent numbers, and they cut against the comfortable global average of about five. Latin America’s toll is driven by organised crime and overwhelmed courts, not war; Sub-Saharan Africa sits high too, while Europe and East Asia have pushed murder to the edge of statistical noise. The single world figure everyone quotes is a fiction no one actually lives in. It averages Caracas into Tokyo, and so describes neither.
How this number was made
What it measures. Intentional homicides (per 100,000 people)
Calculation. Selected entity LCN.
The displayed line is monotone-cubic smoothed for legibility only — it never moves a data point.
Several countries that were among the most violent a generation ago have brought murder down to European levels; the gap is not fixed.
Where you are born still decides, more than almost anything, whether you will be killed by another person.
Part of the gap is real and part is policing and counting, and the worst-affected places are often where the data is weakest.
Who does the remaining violence actually kill?
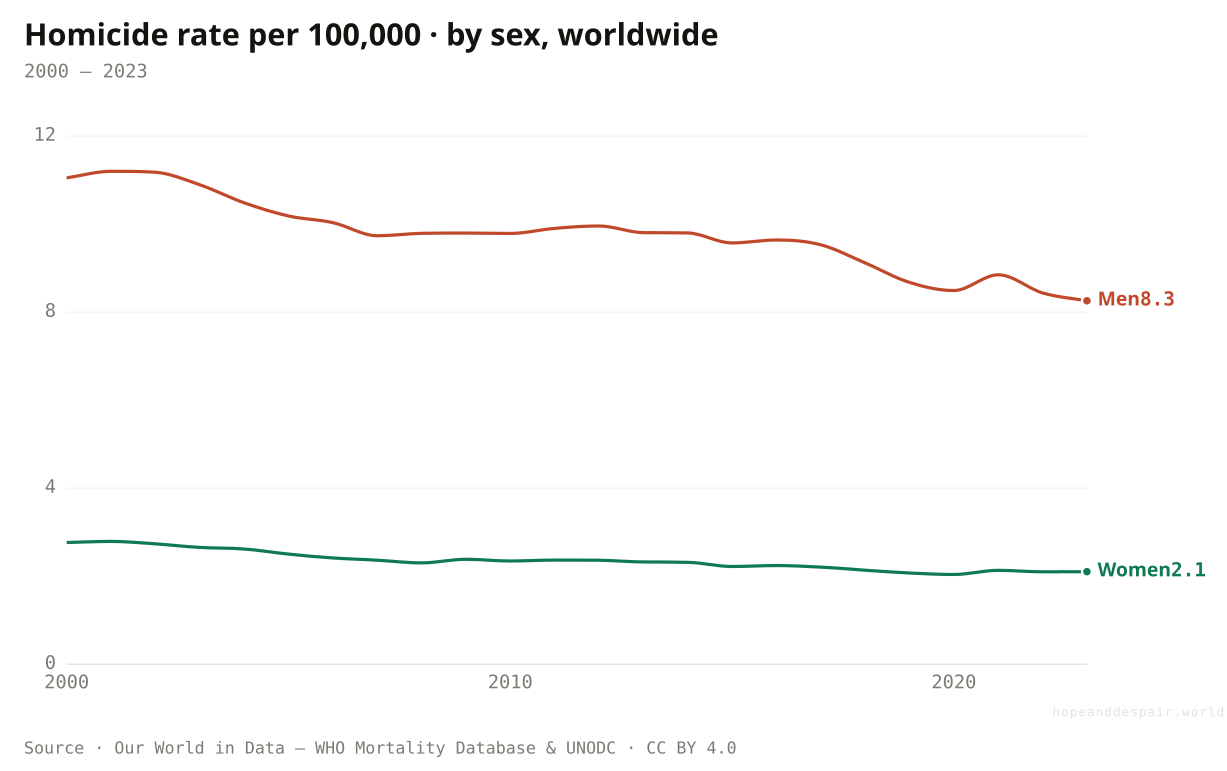
The world’s murder victims are overwhelmingly men.
The average homicide rate hides who is dying. Worldwide, men are killed at about four times the rate of women: roughly eight per 100,000 against two. Most of those men are young, and most are killed by other men, in fights, feuds, and the business of organised crime. The single global figure averages a relatively safe group and a far more dangerous one into a number that fits neither.
This is not the whole of gendered violence, only its lethal, public part. Women are far more likely to be killed at home, by a partner or a relative, than by a stranger in the street, a kind of killing the headline rate barely distinguishes. So the chart says something true and narrow: in the open, among strangers, it is mostly men who kill and men who die. The violence aimed at women tends to happen behind a door the data struggles to see.
How this number was made
What it measures. Intentional homicide rate per 100,000 populationof male victims.
Calculation. Selected entity World.
The displayed line is monotone-cubic smoothed for legibility only — it never moves a data point.
Knowing exactly who is most at risk, young men in specific places, is what makes the violence preventable.
For young men in the most dangerous cities, homicide is not a rare event but a leading way to die.
The street/home split is blurry; a killing recorded as a homicide can hide a long history of domestic abuse.
Has humanity stepped back from the ultimate violence?
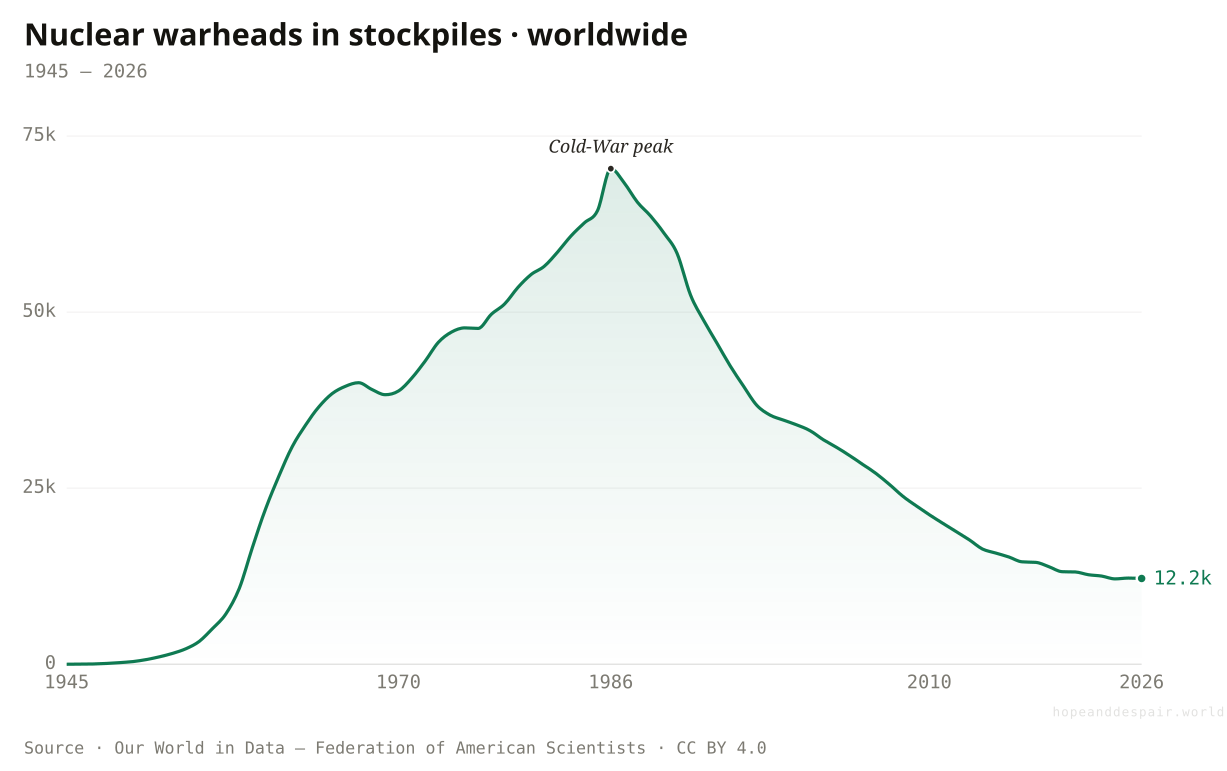
The world’s nuclear stockpile is a fifth of its Cold-War peak.
In 1945 the world held six nuclear warheads, all American. By 1986 the two superpowers had built 70,374 between them, enough to end civilization several times over. Since then the stockpile has fallen to roughly 12,000, about a fifth of the peak.
This is the largest deliberate disarmament in history, and it had names and dates: the end of the Cold War, and a run of arms-control treaties from the 1987 INF agreement to START, under which the United States and Russia cut the arsenals that make up most of the world’s warheads. The reduction was political, not technological; the weapons never became less terrible. And it has stalled. Twelve thousand warheads is still enough to kill hundreds of millions, and what remains is being modernised rather than retired.
How this number was made
What it measures. Estimated number of nuclear warheads in the stockpiles of nuclear powers.
Calculation. Selected entity World.
The displayed line is monotone-cubic smoothed for legibility only — it never moves a data point.
The peak is behind us, and the trend has been downward for nearly forty years.
Twelve thousand warheads is still a number with no human scale—it only takes a few hundred to cause a nuclear winter.
How many of the remaining warheads are truly operational, and how quickly could the stockpile be rebuilt if treaties unravel?
Is the world disarming, or just rearming differently?
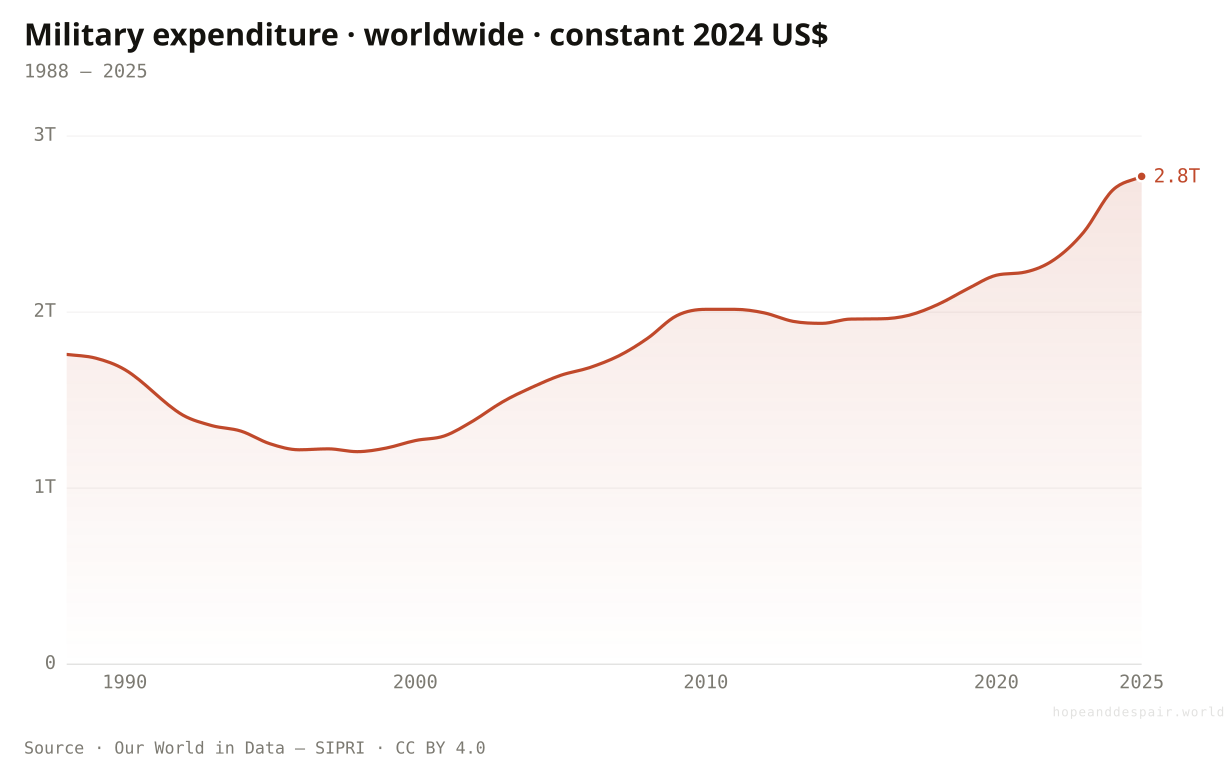
Even as warheads fell, military spending hit an all-time high.
In 1998, the world spent about 1.2 trillion dollars on armies, navies, and air forces. That was the low point after the Cold War. By 2025, the bill had climbed past 2.7 trillion, an all-time high. Warhead counts fell, treaties were signed, but the money never stopped flowing. The planet is not disarming; it is spending more than ever, just on different things — drones, cyber, special forces, the quiet machinery of modern conflict.
How this number was made
What it measures. This data is expressed in US dollars. It is adjusted for inflation but does not account for differences in the cost of living between countries.
Calculation. Selected entity World.
The displayed line is monotone-cubic smoothed for legibility only — it never moves a data point.
The peak spending comes from richer countries, not from the places where people are actually dying.
Nearly three trillion dollars a year buys a lot of violence, even if the weapons look different than they used to.
Whether this spending buys more security or just more fear depends on who is spending it and why, and the data alone cannot say.
What about the violence aimed at civilians on purpose?
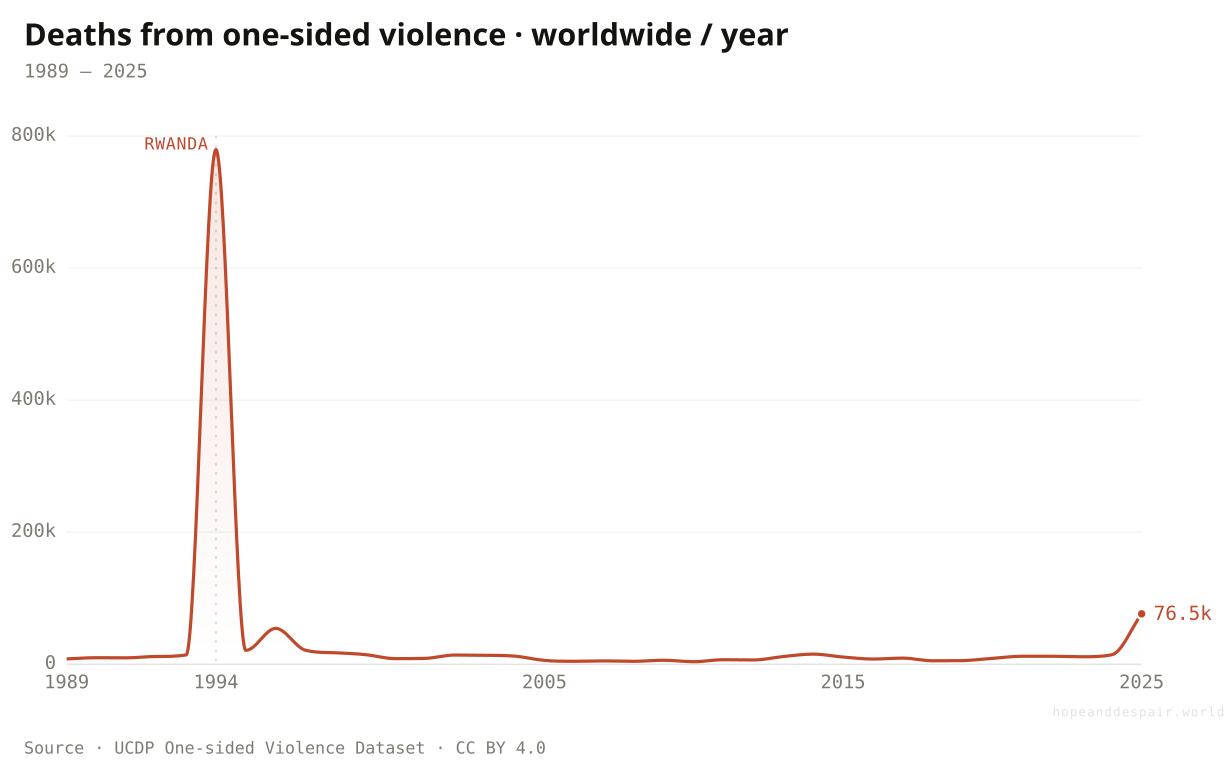
Sometimes the killing has no battlefield.
In a hundred days in 1994, close to 780,000 people were killed in Rwanda — not in battle, but hunted down, mostly with machetes, for belonging to the wrong group. That single year towers over everything else on this chart. One-sided violence is the deliberate killing of people who cannot fight back, and at its extreme it is the arithmetic of genocide.
This kind of killing has no front line and no symmetry: a state or a militia on one side, unarmed civilians on the other. In most years the global toll runs in the low tens of thousands, far beneath the Rwandan peak, and yet it never settles at zero. It rises whenever a government turns on its own people, or the losing side of a war is made to pay, and it has climbed sharply again these last two years. The capacity for massacre did not die in the twentieth century. It only went quiet.
How this number was made
What it measures. Best estimate of civilians deliberately killed by a government or a formally organised armed group.
Calculation. Selected entity World.
The displayed line is monotone-cubic smoothed for legibility only — it never moves a data point.
The genocidal scale of 1994 has not been matched since; the worst case has become the rare case.
It never falls to zero, and it has climbed sharply again in the last two years.
The line counts only the deaths that get documented; in the chaos of a massacre the true number is often unknowable.
Does the violence we fear most match what actually kills us?
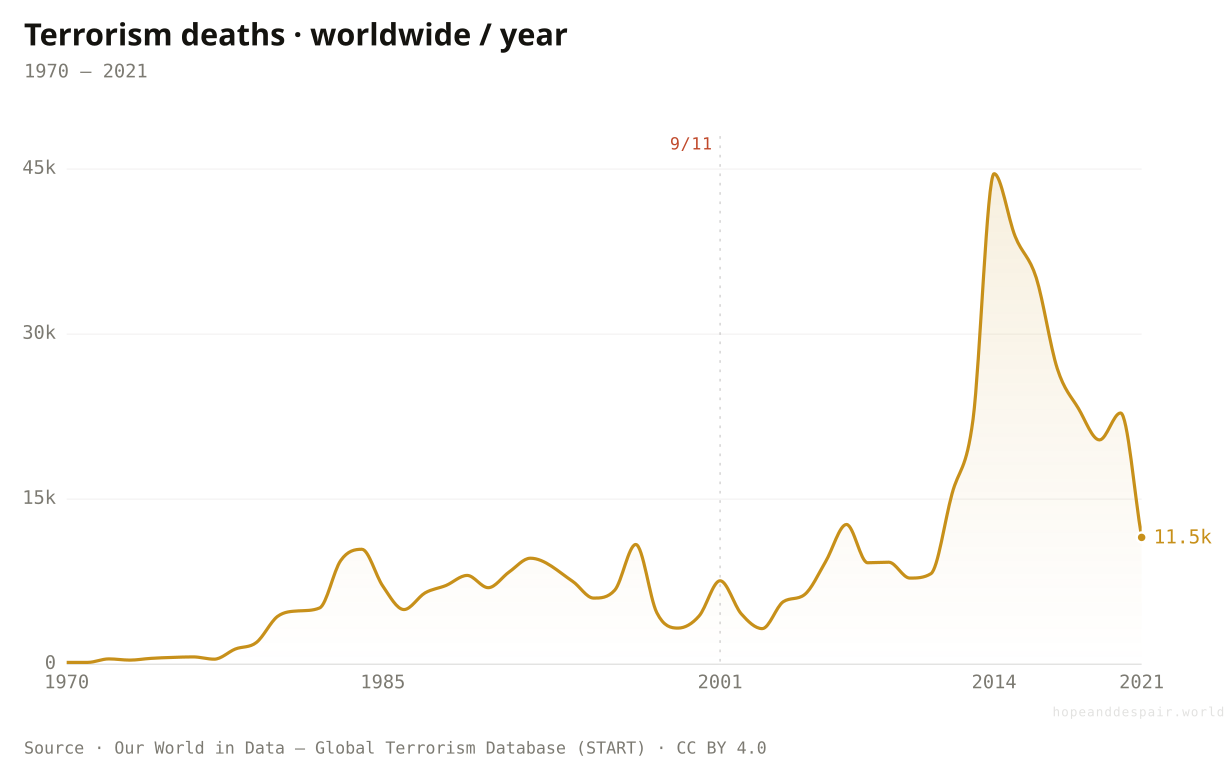
Terrorism kills a rounding error of the violent dead — and rules the fear.
In 1970, 174 people died in terrorist attacks worldwide. In 2014, the deadliest year on record, the toll was 44,581. That sounds like a lot until you set it beside the rest of this article: the wars of that same year killed more than twice as many people, and everyday homicide quietly takes more lives than either. Terrorism dominates headlines, security budgets, and the fear of violence, yet for any one person the risk is vanishingly small. The gap between what we fear and what actually kills us is its own kind of damage, the one that warps how we spend money, attention, and freedom.
How this number was made
What it measures. Confirmed deaths, including all victims and attackers who died because of a terrorist attack.
Calculation. Selected entity World.
The displayed line is monotone-cubic smoothed for legibility only — it never moves a data point.
Even terrorism’s worst year on record killed fewer than half as many people as the wars of that same year; for any one person, the risk is vanishingly small.
The trend is upward: 174 deaths in 1970 became 11,528 in 2021, and the fear it sows distorts policy and public life far beyond the body count.
How many of those deaths are counted as terrorism depends on who is defining the term — one state’s terrorist is another’s freedom fighter, and the data carries that political weight.
Humanity is not a line chart. A single average can bury a million tragedies.— Progress and catastrophe coexist
One question, read by the fields that actually study it. Each voice is given both its most hopeful and its darkest honest reading — with a note on how settled the evidence underneath is.
the hopeful readThe organized state slowly crowded out the raid, the feud, and the duel.
the darker readThe same state perfected industrial war when it chose to wage it.
the hopeful readPer-capita death rates sit far below their historical band.
the darker readThe denominator hides the dead; rare mega-wars dominate true risk.
the hopeful readHomicide is concentrated, which means it is preventable where we focus.
the darker readMost violence against women never reaches a statistic at all.
the darker readA global average is no comfort under a drone. My street is the only dataset that matters.
the hopeful readThe nuclear taboo and economic entanglement still raise the cost of total war.
the darker readCheap drones, autonomy, and disinformation lower the cost of mass harm.
Strongest case for hope
The long view is the real story. Homicide has fallen more than thirty-fold over the centuries, and nuclear arsenals, though still enormous, are down to about a fifth of their Cold-War peak. The forces that drove violence down, from stronger states to economic growth to a hardening norm against killing, have not vanished. A bad five years does not erase a better five hundred.
Strongest case for despair
The recent upturn in battle deaths and the reversal of nuclear disarmament show that the peace is fragile and reversible. The same forces that brought violence down could unwind in a generation, and the global average hides the places where violence is already catastrophic.
A sustained rise in homicide rates across multiple world regions over a decade would challenge the hope narrative. A verified, verifiable reduction in nuclear warheads below 5,000 and a decade of declining battle deaths would weaken the despair case.
Everything done to the numbers between the source and the chart, disclosed in full. Where a choice is editorial rather than measured, we say so.
- Every figure is real
- Every chart runs on data ingested through our open pipeline, with downloadable source, data package, and lineage files under each. The only hand-made element is the evidence-panel overview at the top (the hero curve and the four signal sparklines), a composited orientation graphic flagged as such.
- Derived totals
- Where a source has no single “World” line, we build one and record the recipe: battle deaths and active conflicts are summed across conflict types; refugees are summed across every country of origin. The recipe travels with each chart’s downloadable lineage.
- Source & vintage
- Each real series is pinned to a snapshot at a fixed vintage with a recorded checksum. The vintage and the source’s own revision travel with the figure’s metadata.
- Transformations
- Counts are reported as the source provides them, or converted to rates per 100,000 using mid-year population. Currencies are in constant 2024 US$. No series is re-based, capped, or seasonally adjusted.
- Display smoothing
- Lines use monotone-cubic interpolation purely for legibility. It is cosmetic — it never moves, adds, or hides a data point.
- Re-host vs. link-only
- We re-host only openly-licensed data (CC BY / CC0). Some sources — UNODC homicide, IHME, Amnesty, the World Values Survey — restrict redistribution, so we cite and link them rather than re-publishing the numbers.
- The verdict
- Each signal is classed improving or worsening by the sign of its change across the visible window. The headline verdict is an editorial reading of those signals — deliberately not a single computed index.
- Our World in Data — War & Peace — ourworldindata.org/war-and-peace ↗ · CC BY 4.0 · vintage 2026-06Keystone aggregator; long-run homicide after Eisner (2003).
- Uppsala Conflict Data Program (UCDP / PRIO) — ucdp.uu.se ↗ · CC BY 4.0 · vintage 2026Battle-related deaths, active conflicts, one-sided violence.
- Federation of American Scientists — Nuclear Notebook — fas.org/initiative/nuclear-information-project ↗ · CC BY 4.0 (via OWID) · vintage 2026Nuclear warhead stockpile estimates.
- Stockholm International Peace Research Institute (SIPRI) — www.sipri.org/databases/milex ↗ · CC BY 4.0 (via OWID) · vintage 2026Global military expenditure, constant USD.
- Global Terrorism Database (START, U. Maryland) — www.start.umd.edu/gtd ↗ · CC BY 4.0 (via OWID) · vintage 2026Deaths from terrorism worldwide, 1970–2021.
- UNODC Global Study on Homicide — www.unodc.org/unodc/en/data-and-analysis/global-study-on-homicide.html ↗ · Link-only (non-redistributable) · vintage 2025Homicide rates by country and region.
- UNHCR Refugee Data Finder — www.unhcr.org/refugee-statistics ↗ · CC BY 4.0 (via OWID) · vintage 2026Refugees by country of origin; world total summed across countries.
- World Bank — World Development Indicators — data.worldbank.org/indicator/VC.IHR.PSRC.P5 ↗ · CC BY 4.0 · vintage 2026Homicide rate by world region (re-hosts UNODC under an open licence).
- WHO Mortality Database / UNODC — platform.who.int/mortality ↗ · CC BY 4.0 (via OWID) · vintage 2026Homicide rate by sex, World.
- UN OCHA — occupied Palestinian territory — www.ochaopt.org/data/casualties ↗ · Cited (not re-hosted) · vintage 2026Authoritative count of all conflict-related deaths in Gaza and the West Bank; the fuller toll behind the battle-death figure.
Cite this page
Reference
Hope & Despair. “Is humanity becoming less violent?.” Hope & Despair, 2026. https://hopeanddespair.world/questions/is-humanity-becoming-less-violent.
BibTeX
@misc{hopeanddespair:is-humanity-becoming-less-violent,
  author       = {{Hope & Despair}},
  title        = {{Is humanity becoming less violent?}},
  year         = {2026},
  howpublished = {\url{https://hopeanddespair.world/questions/is-humanity-becoming-less-violent}},
  note         = {hopeanddespair.world, updated 2026-06-14}
}
Original prose, code, and chart designs are released under CC BY 4.0 ↗ — reuse freely with attribution. Source datasets keep their own licences, listed above. Add your access date when citing.
- Mobile-first chart system + redesign branch snapshot View diff →
- Build the data pipeline; wire the article's long-arc chart to real OWID data View diff →
- Scaffold the static-first Astro site (foundation milestone) View diff →
Generated from the commit history — every edit to a number, a word, or a chart is tracked in the open. Browse the full history & diffs on GitHub →
in plain words
Still lost? Read this.
If you had to live in any century before your own, pick the one you’re in. The chance that someone kills you has fallen, century after century, for a thousand years. A medieval European was about thirty-five times more likely to be murdered than you are. Your ancestors lived with a risk that would feel like a war zone to you.
But here is the catch. That long, beautiful decline mostly measures one kind of violence: men killing other men in public, in fights and feuds and raids. The violence that happens behind a locked door, against women and children and enslaved people, barely shows up on that chart because for most of history nobody thought to count it. And the last five years have broken the trend. The world got more violent, not less, for the first time in living memory.
So the honest answer is both. Over the long arc of history, we are astonishingly less violent than our ancestors. Over the last five years, we are more violent than we were. And for whole categories of cruelty, we never had a chart at all. The one thing you can say at dinner, and be right: the story of violence is not one line. It is a handful of different stories, and they do not all go the same direction.