Question 07 · Energy
Is the electric-car revolution real?
One in four new cars sold in the world is now electric, and in China it is more than half. Yet most cars on the road still burn petrol, and an electric car is only as clean as the grid that charges it. The revolution is real; it is also just beginning.
you read
- This is about cars, and mostly about new ones. The headline number is the electric share of new car sales, not of all the cars on the road, and not of trucks, buses, ships, or planes. Sales flip years before the fleet does.
- The EV data is CC BY 4.0, with downloads. Sales, stock, and share come from the IEA’s Global EV Data Explorer, which is licensed CC BY 4.0, so every figure is re-hosted with its data downloadable below it and credited to the IEA. One caveat on the licence: the separate Global EV Outlook report is restricted (Non-CC); we take the data only from the CC BY Explorer and cite the report. The grid chart is from Ember, also CC BY 4.0.
- An electric car is not zero-carbon. It moves the emissions from the tailpipe to the power plant, and to the mine and factory that built the battery. How clean it really is depends on the grid that charges it and how the battery was made.
- Figures are 2025, the latest IEA estimate. Some country series begin in 2011 or 2012, where earlier sales were too small to register.
Are electric cars actually selling?
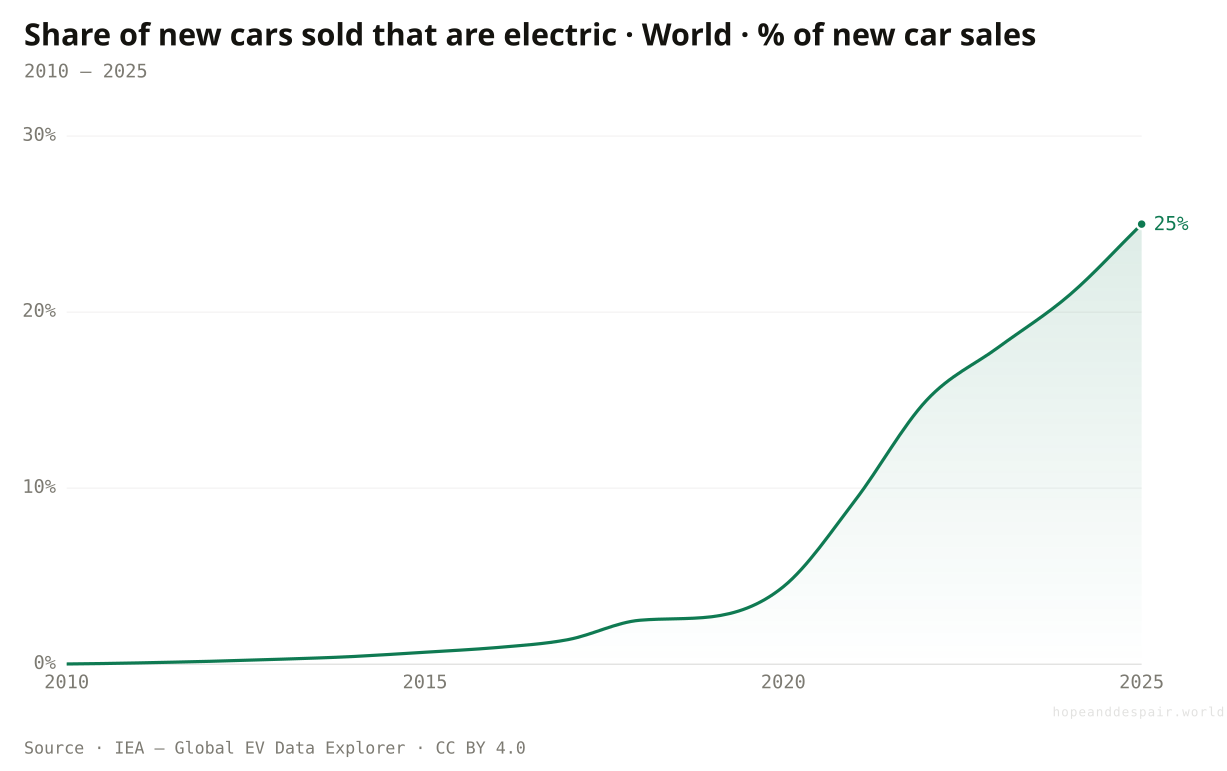
One in four new cars sold in the world is now electric.
Fifteen years ago you could count the world’s electric cars in the thousands. In 2010 they were about one in every eight thousand new cars sold, a curiosity for early adopters and city pilots. By 2025 they were one in four. Nothing else on four wheels has climbed an adoption curve this steep, not the automatic gearbox, not the airbag. The shift came when an electric car stopped being an environmental statement and became, in many markets, simply the better car: quieter, quicker off the line, cheaper to fuel and to service. This is the classic S-curve of a technology tipping over from novelty to default. Where it bends next, and in which countries, is the rest of the story.
How this number was made
What it measures. Share of new cars sold that are electric, World
Calculation. Selected entity World.
The displayed line is monotone-cubic smoothed for legibility only — it never moves a data point.
Electric cars went from a rounding error to a quarter of the global market in fifteen years, an adoption curve as fast as any in the car’s history.
A quarter of new sales still means three of every four new cars burn petrol or diesel, locking in tailpipe emissions for the next fifteen years.
Whether the S-curve keeps climbing or stalls near a third depends on charging, prices, and policy that differ wildly by country.
Who is actually driving the boom?
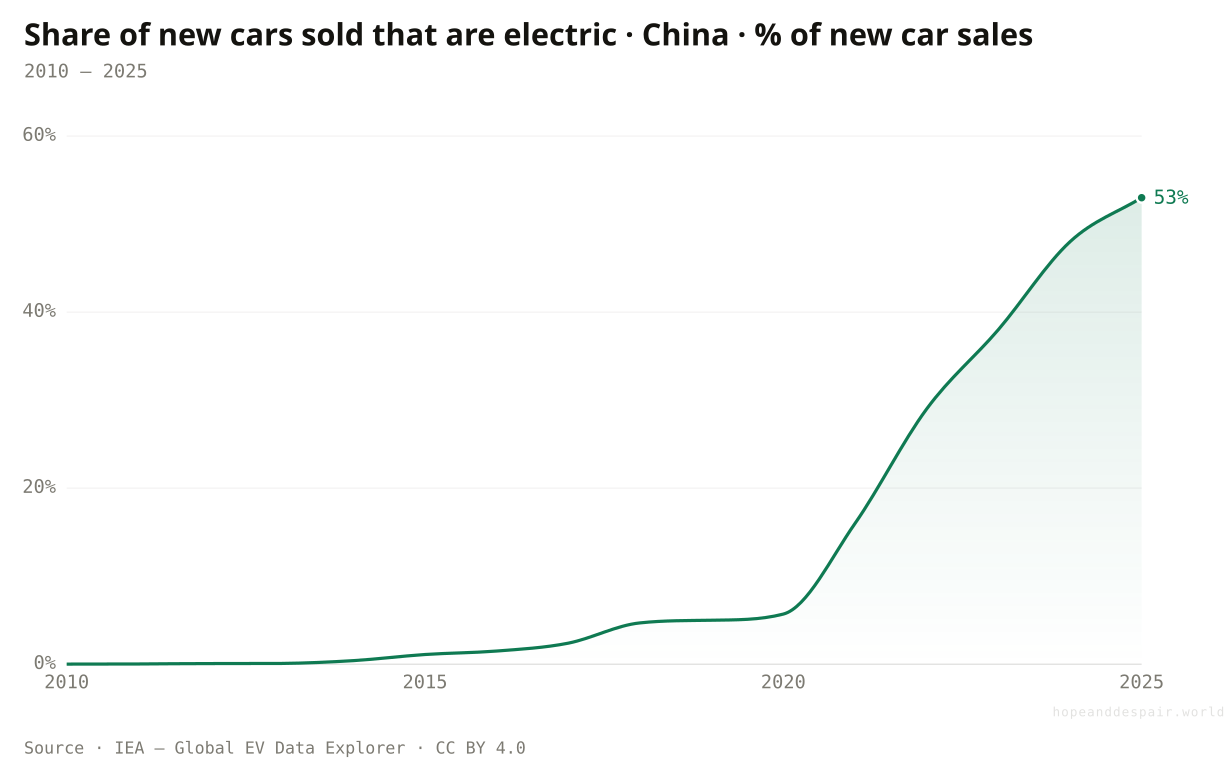
In China, most new cars are now electric.
A decade ago the world’s largest car market barely made a single plug-in; today you would struggle to buy a petrol model on some forecourts in Shanghai. More than half of every new car sold in China in 2025 runs on a battery, up from about one in ten thousand in 2010. No large market has crossed the halfway line before, and it happened from a standing start in fifteen years. The push was deliberate: a decade of subsidies and sales quotas, a near-total grip on the battery supply chain, and homegrown makers like BYD turning out plug-in models that undercut the petrol cars they replace. The result is a market where the default new car increasingly has a plug, and a battery industry that now sets the price for everyone else. To a large degree, the rest of the world is buying what China built.
How this number was made
What it measures. Share of new cars sold that are electric, China
Calculation. Selected entity China.
The displayed line is monotone-cubic smoothed for legibility only — it never moves a data point.
China proved a giant car market can flip to majority-electric in a single decade, and built the cheap models that make it possible elsewhere.
A transition this concentrated in one state-directed market is fragile, and ties the world’s clean-car future to one country’s industrial policy.
How much was subsidy and how much is now self-sustaining demand is genuinely unclear, and matters for whether others can copy it.
Where on Earth are the electric cars actually sold?
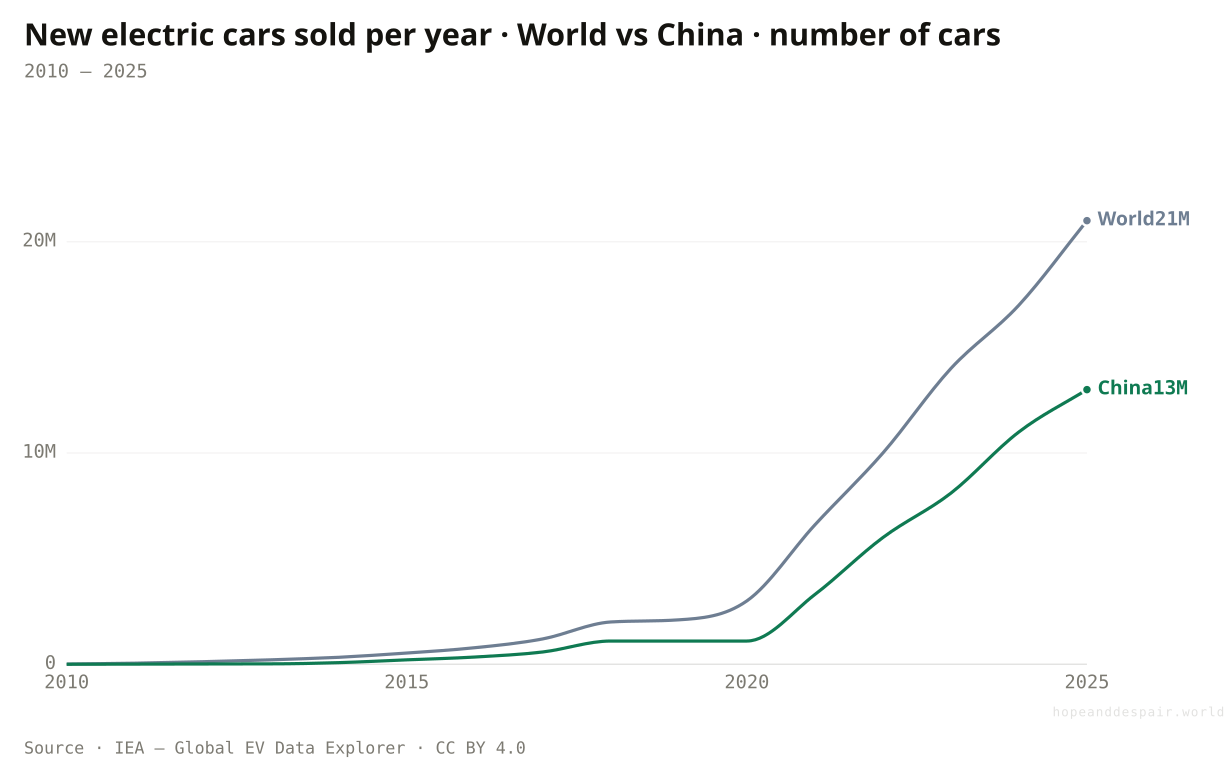
Almost two of every three electric cars sold on Earth are sold in China.
Share percentages can hide where the metal actually moves. In 2025 the world bought about 21 million new electric cars, and China alone bought roughly 13 million of them. That is close to two in every three, sold in a single country. Set that volume beside the leaders’ headline percentages and the geography snaps into focus: Norway has the highest electric share on Earth, yet on raw numbers it barely registers next to China’s output. The boom is not spread evenly across the map. It is concentrated, overwhelmingly, in the one country that set out to win it, which is why a wobble in Chinese demand or policy would be felt in every carmaker’s plan.
How this number was made
What it measures. New electric cars sold per year, World
Calculation. Selected entity World.
The displayed line is monotone-cubic smoothed for legibility only — it never moves a data point.
China’s sheer volume is dragging down the price of every electric car and battery on the planet, for everyone.
With the boom this concentrated, a slowdown or trade war in one country could stall the global transition overnight.
Whether other large markets can build their own volume, or only import China’s, is the open industrial question of the decade.
What does a finished transition look like?
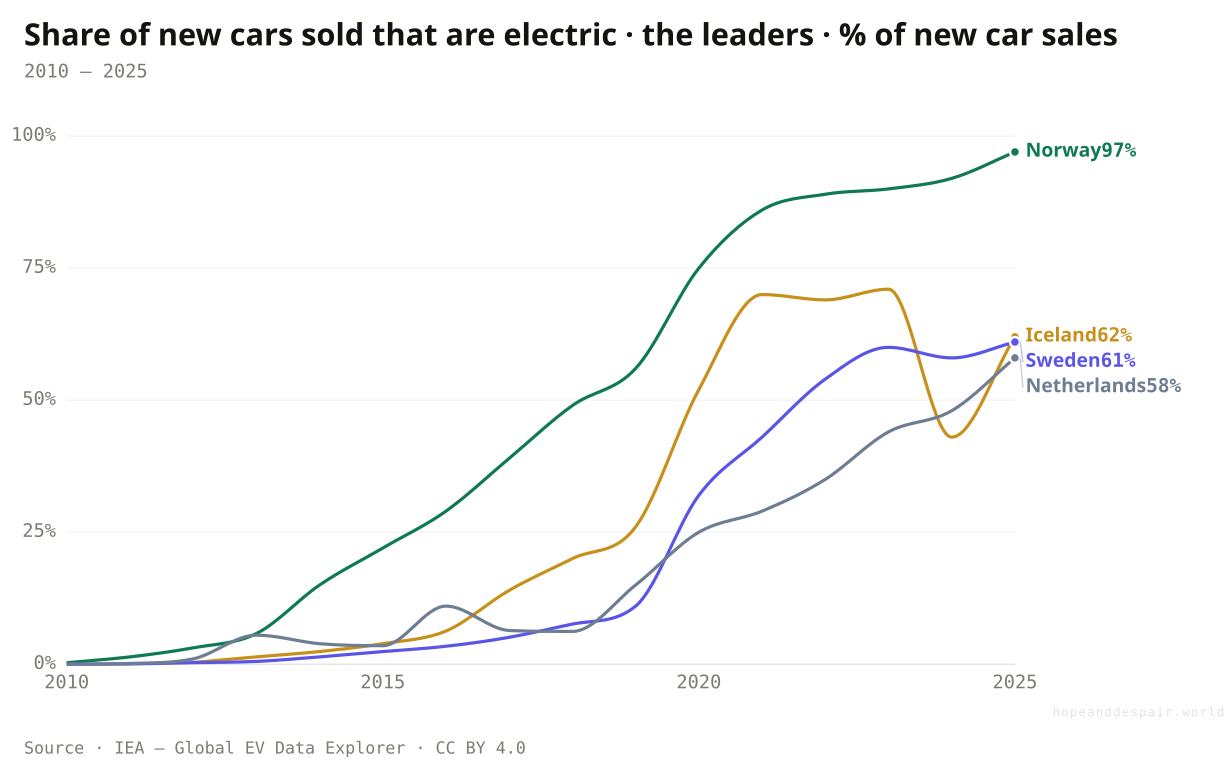
In the leading countries, the new petrol car is already nearly extinct.
Norway is the country that has effectively finished. In 2025, 97 of every 100 new cars sold there are electric, and a new petrol car has become an oddity on the forecourt. It got there with two decades of patient policy, exempting electric cars from the steep taxes that make any car expensive in Norway until plugging in was simply the obvious buy. Iceland, Sweden, and the Netherlands sit a step behind, all past the point where electric is the majority choice. These are small, rich, cold countries, and that is part of the catch: their route leaned on generous public money and high baseline car prices most of the world does not share. They prove the destination is reachable. They do not prove the road there is the same for everyone.
How this number was made
What it measures. Share of new cars sold that are electric, Norway
Calculation. Selected entity Norway.
The displayed line is monotone-cubic smoothed for legibility only — it never moves a data point.
A fully electric new-car market is not a fantasy; Norway is living in it now, with no loss of mobility.
The leaders won with subsidies and taxes that depend on small, wealthy populations, a model that does not transfer to most of the world.
How fast the last few percent of petrol holdouts disappear, even in Norway, is harder than the first ninety.
Why do equally rich countries differ so much?
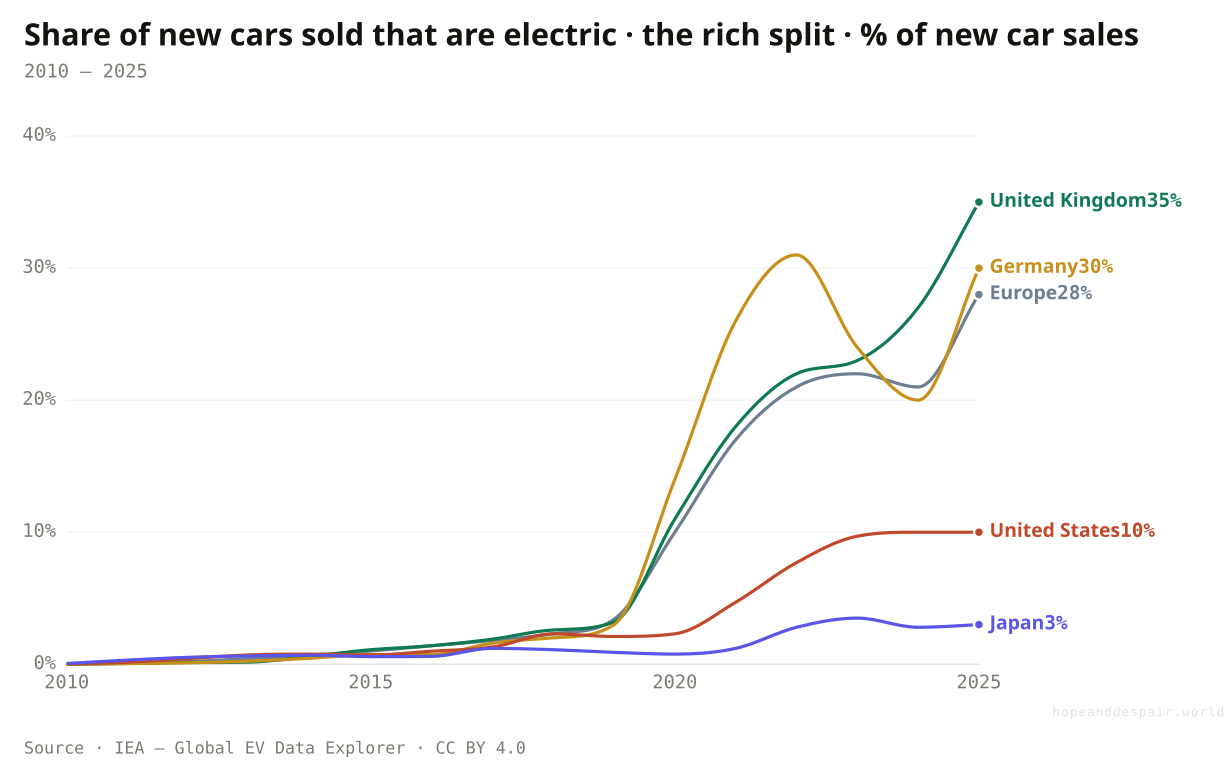
Among wealthy countries, the gap between leaders and laggards is enormous.
Wealth does not predict who electrifies. Western Europe is most of the way into the switch (the United Kingdom at 35 percent of new sales, Germany at 30, the bloc as a whole near 28), while two of the richest countries on the planet sit near the bottom. The United States, home to both the assembly line and Tesla, electrifies only about one new car in ten. Japan, which more or less invented the modern hybrid, makes barely three in a hundred new cars fully electric. The split is politics and product, not money: Europe set hard targets and built dense charging, America’s incentives lurched with each election, and Japan’s carmakers bet on hybrids and hydrogen instead. Being rich is not the same as being ready.
How this number was made
What it measures. Share of new cars sold that are electric, Europe
Calculation. Selected entity Europe.
The displayed line is monotone-cubic smoothed for legibility only — it never moves a data point.
Where governments set clear targets and built charging, adoption followed fast, which means the laggards know exactly what works.
The world’s largest rich economy is barely electrifying, and policy whiplash there can stall investment across the whole industry.
Whether the US and Japan are merely late or have chosen a different path entirely, through hybrids, is not yet settled.
Is the rest of humanity in this, or locked out?
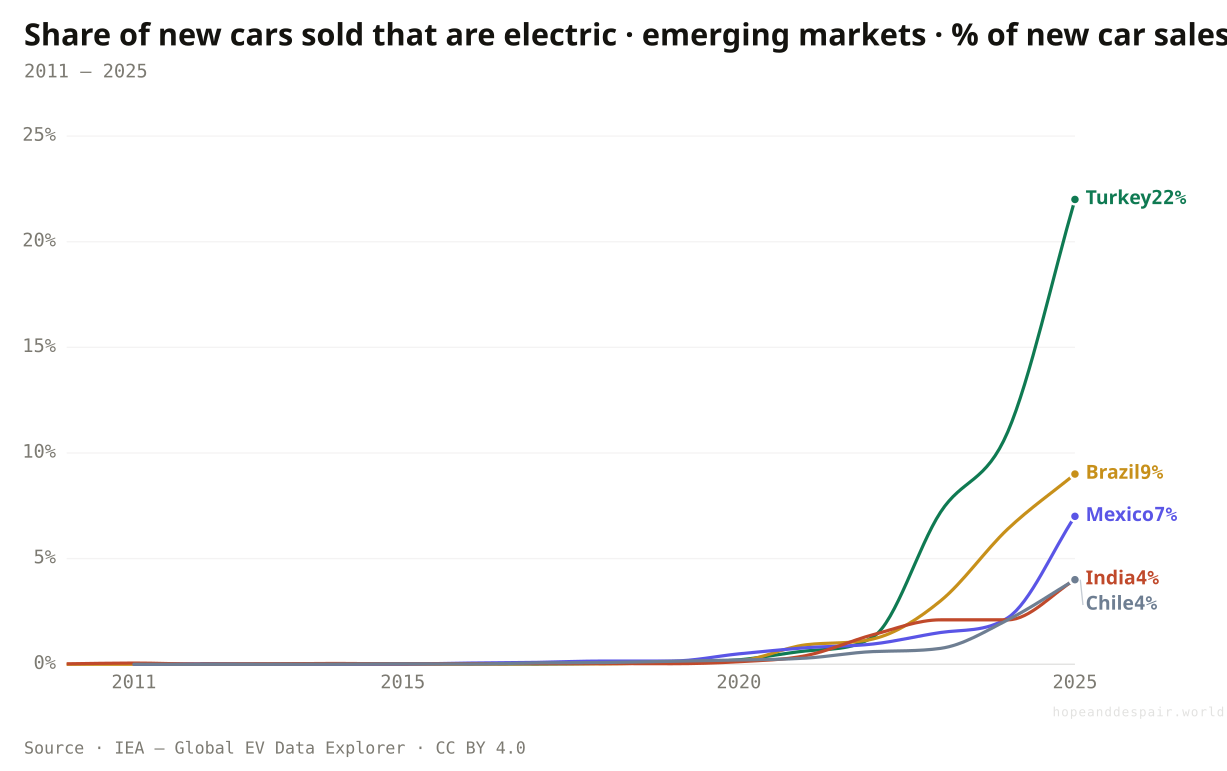
In the emerging world the car is barely electric, which misses the real revolution.
Outside the rich world the picture looks thin, and the numbers are easy to misread. Turkey has jumped to 22 percent of new cars, lifted by its homegrown brand Togg, but Brazil sits near 9, Mexico 7, and India and Chile around 4. For India that figure badly understates what is happening, because India’s electric revolution is not in cars at all. It is in the two- and three-wheelers, the scooters and auto-rickshaws that most Indians actually drive, where electric models far outsell electric cars and never show up in a car statistic. The lesson cuts both ways. Emerging markets are years behind on electric cars, and they may leapfrog the car entirely, the way they leapfrogged landlines for mobile phones.
How this number was made
What it measures. Share of new cars sold that are electric, Turkey
Calculation. Selected entity Turkiye.
The displayed line is monotone-cubic smoothed for legibility only — it never moves a data point.
Emerging markets can buy cheap Chinese EVs and electrify their scooters and rickshaws, skipping the petrol era as they skipped landlines.
On cars alone, most of the developing world is a decade or more behind, and importing EVs means importing the industry’s jobs too.
Because the car metric misses two-wheelers, the true pace of electrification across the emerging world is genuinely hard to read.
If not cars, then what is the emerging world electrifying?
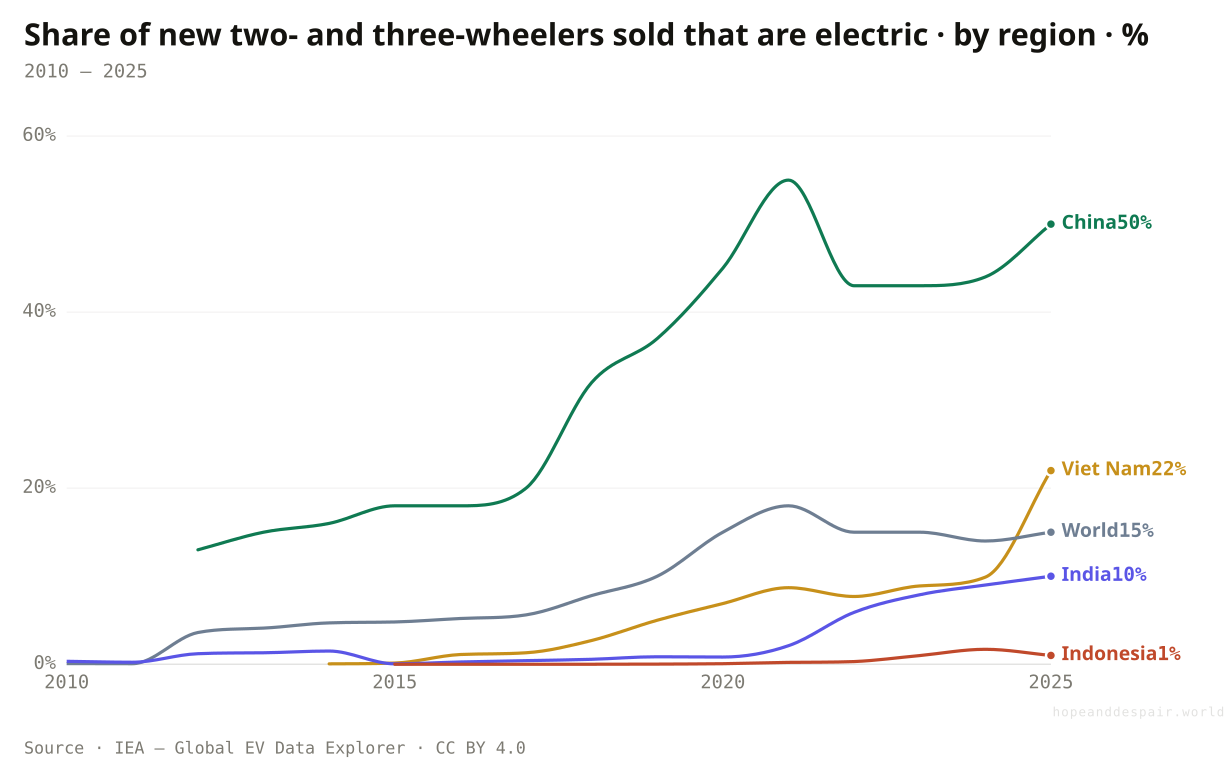
Where the emerging world electrifies fastest, it is on two wheels, not four.
Look at scooters and rickshaws instead of cars and the map turns over. In China, half of the two- and three-wheelers sold in 2025 were electric; in Viet Nam, where the motorbike is the family car, more than a fifth were. India, stuck near 4 percent on cars, is already at 10 percent on its two- and three-wheelers and climbing fast, because an electric scooter costs little, charges from a wall socket, and earns its price back in saved fuel within a couple of years. This is the vehicle most of humanity actually rides. The rich world’s car-first story does not describe how most of the planet will go electric, and on two wheels much of it already is.
How this number was made
What it measures. Share of new two/three-wheelers sold that are electric, China
Calculation. Selected entity China.
The displayed line is monotone-cubic smoothed for legibility only — it never moves a data point.
In the markets where most people ride two and three wheels, electric is already mainstream: half of China’s, a fifth of Viet Nam’s.
Outside Asia the two-wheeler shift is barely starting, and electric scooters do nothing about the cars and trucks that dominate rich-world emissions.
Two-wheeler data is patchy and recent, so the true global pace of small-vehicle electrification is harder to pin down than the car numbers.
Is the whole road electrifying, or mostly the cars?
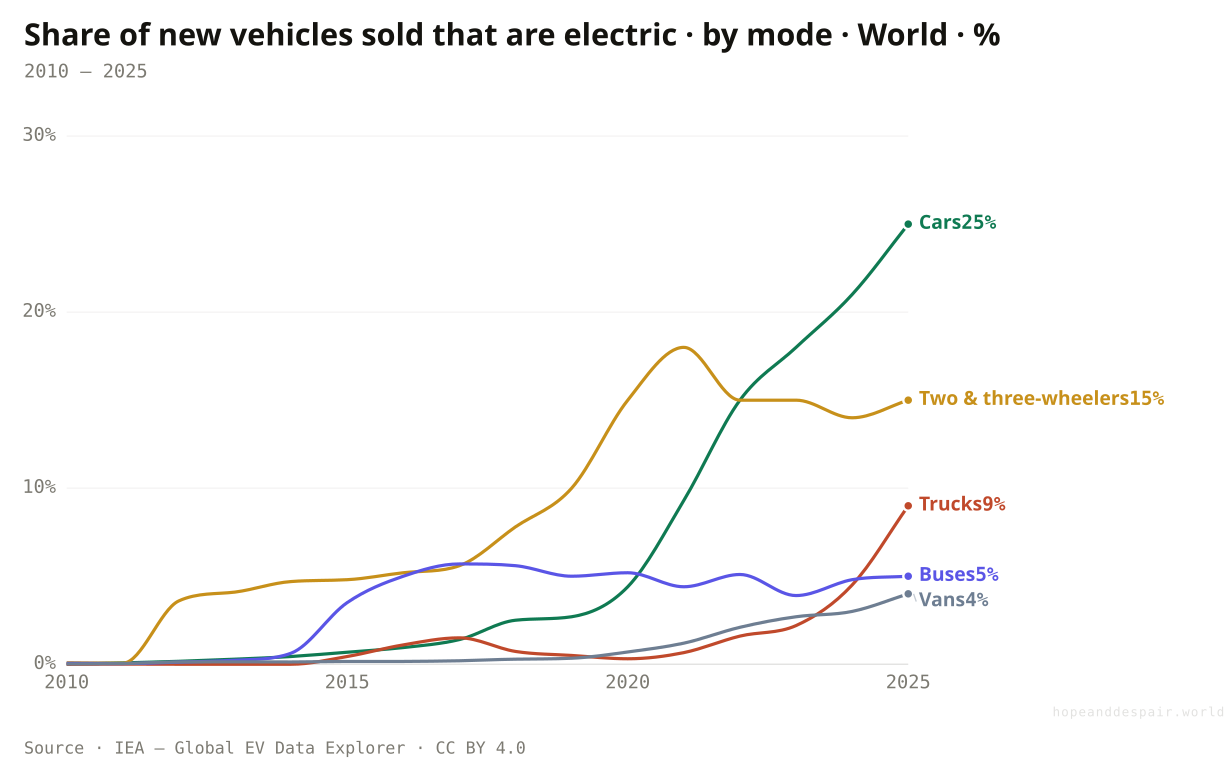
Cars and scooters are electrifying fast; the trucks and vans that move freight are not.
The revolution has a clear pecking order, set by what each vehicle is for. About a quarter of new cars and a sixth of new two- and three-wheelers are electric, but only some 9 percent of trucks, 5 percent of buses, and 4 percent of vans. The split follows the physics and the money: a battery big enough to haul forty tonnes all day still costs and weighs too much, while a city car or a scooter is an easy electric win. Buses are the quiet success in between, because a fixed route and a depot to charge at overnight suit a battery well. The freight that moves the economy is the hard part, and it has barely started to move.
How this number was made
What it measures. Share of new cars sold that are electric, World
Calculation. Selected entity World.
The displayed line is monotone-cubic smoothed for legibility only — it never moves a data point.
The two biggest vehicle categories by number, cars and two-wheelers, are the ones electrifying fastest, so the volume win is real.
Heavy trucks, the backbone of freight emissions, are stuck in single digits, and they are the hardest battery problem of all.
Whether trucks follow cars down the cost curve or need a different fix entirely, like hydrogen or overhead wires, is unresolved.
How many of the cars on the road are actually electric?
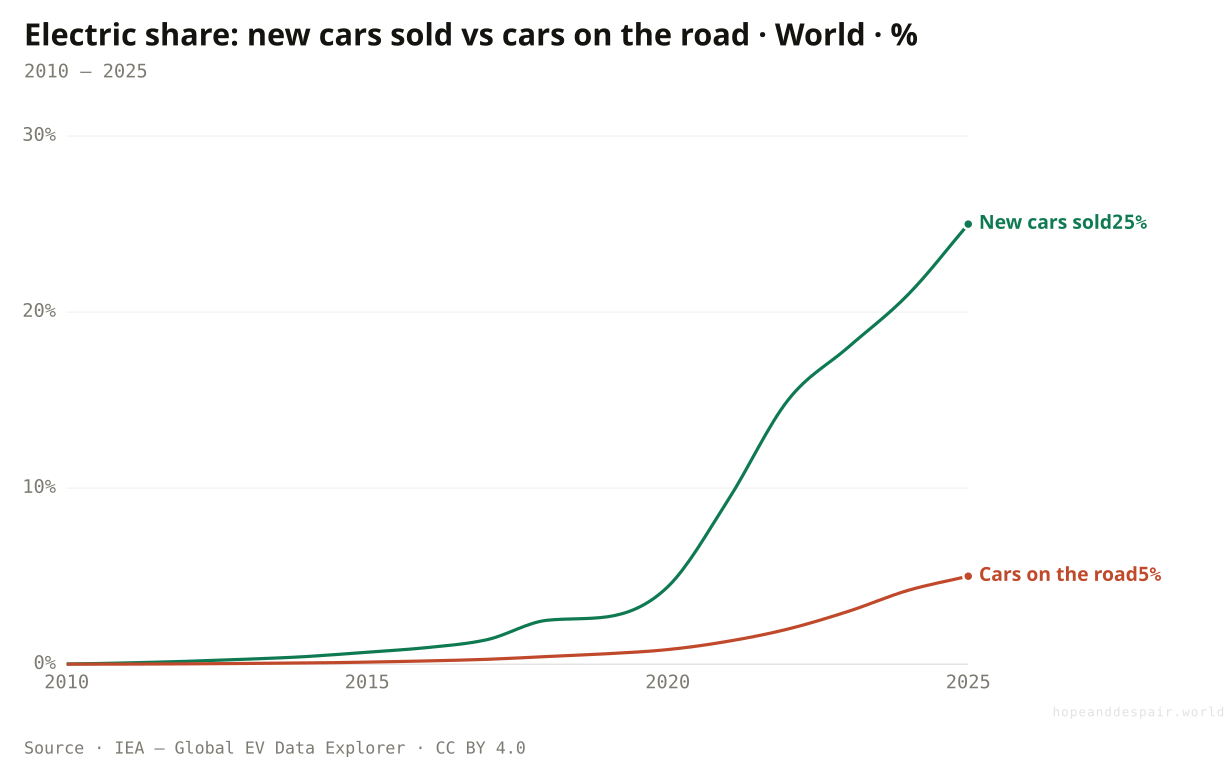
A quarter of new cars are electric. Only a twentieth of the cars on the road are.
This is the gap every headline skips. In 2025 a quarter of the cars rolling out of showrooms were electric, but only about one in twenty of the cars actually on the road were. The two lines measure different things: one is what people are buying now, the other is what they bought over the last fifteen years and are still driving. A car is a long-lived thing, kept for a decade or more and then sold on rather than scrapped, so the fleet turns over slowly even when the showroom flips fast. The sales line is the future arriving. The fleet line is the past refusing to leave. Closing the distance between the two is the whole job, and it takes about as long as a car lasts.
How this number was made
What it measures. Share of new cars sold that are electric, World
Calculation. Selected entity World.
The displayed line is monotone-cubic smoothed for legibility only — it never moves a data point.
The fleet share is rising for the most durable of reasons: every year’s record sales become next year’s cars on the road, and they stay there for over a decade.
Only one car in twenty on the road is electric, so the tailpipe emissions from the existing fleet are barely dented yet.
How fast the fleet share climbs depends on scrappage rates and second-hand markets, which almost no one tracks closely.
Where has the fleet itself actually gone electric?
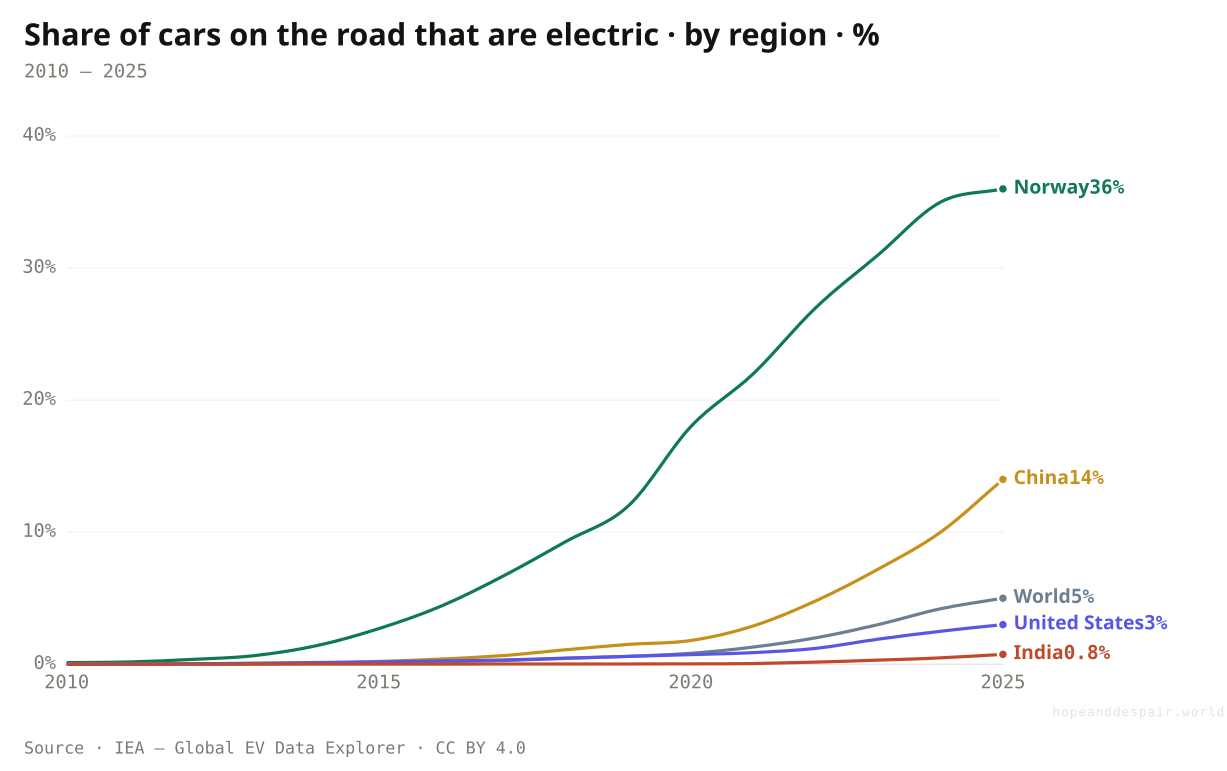
Even in Norway, only about a third of the cars on the road are electric.
Saturation in the showroom is not the same as saturation on the street. After years of near-total plug-in sales, only about 36 percent of the vehicles on Norwegian roads actually run on a battery, and Norway is the world leader by a distance. China, the sales juggernaut, sits at 14 percent of its fleet; the world is around 5; the United States is at 3; India is below 1. The pattern is identical everywhere, just frozen at different stages, because what is on the road always trails what is being sold by a wide margin. A country has to keep selling mostly-electric for a decade or more before its fleet catches up. Even the front-runners are closer to the start of that wait than its end.
How this number was made
What it measures. Share of cars on the road that are electric, Norway
Calculation. Selected entity Norway.
The displayed line is monotone-cubic smoothed for legibility only — it never moves a data point.
Norway proves a fleet can be turned over within a generation, not a century, once sales stay high for long enough.
Outside a handful of small leaders, the share of cars on the road that are electric is still in the low single digits.
Whether the laggards follow Norway’s curve or stall partway is the difference between a transition that finishes and one that plateaus.
How many electric cars are actually out there?
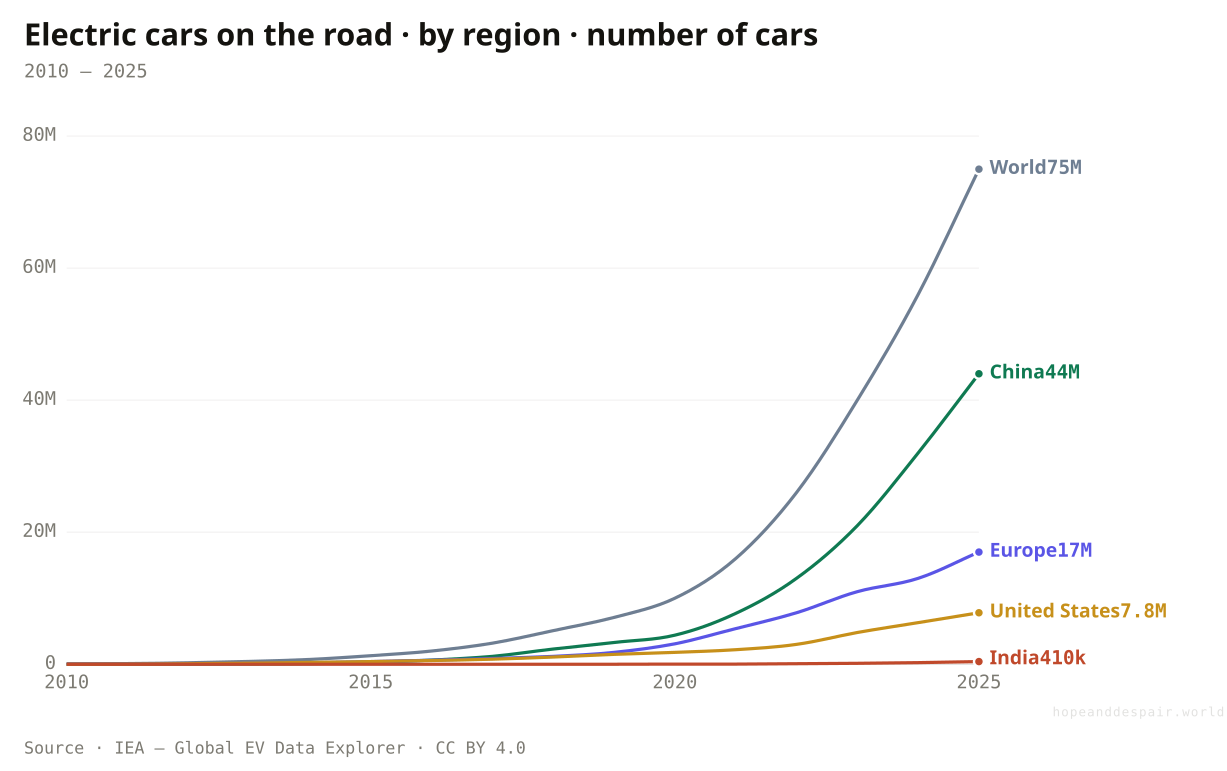
Seventy-five million electric cars are on the road, and well over half are in China.
Behind the percentages are real cars, tens of millions of them. About 75 million electric cars were on the world’s roads in 2025, up from some 39,000 in 2010, a nearly two-thousandfold rise in fifteen years. Well over half of them, about 44 million, are in China; Europe and the United States trail with a fraction each, and India, for all its size, has only a few hundred thousand. This is the same lopsidedness as the sales, now hardened into the fleet: the country that bought the most is the country that drives by far the most electric cars. The absolute count is enormous and the growth is relentless. Set against the size of the world’s car fleet, it is also still early days.
How this number was made
What it measures. Electric cars on the road, World
Calculation. Selected entity World.
The displayed line is monotone-cubic smoothed for legibility only — it never moves a data point.
Seventy-five million electric cars on the road is a real, growing dent, and it compounds every year as sales climb.
Electric cars are still a small slice of the world’s fleet; the billion-plus petrol cars already built will burn fuel for decades.
How fast old cars get scrapped, not how fast new ones sell, sets the real pace, and that is mostly invisible in the headlines.
Is an electric car always engine-free?
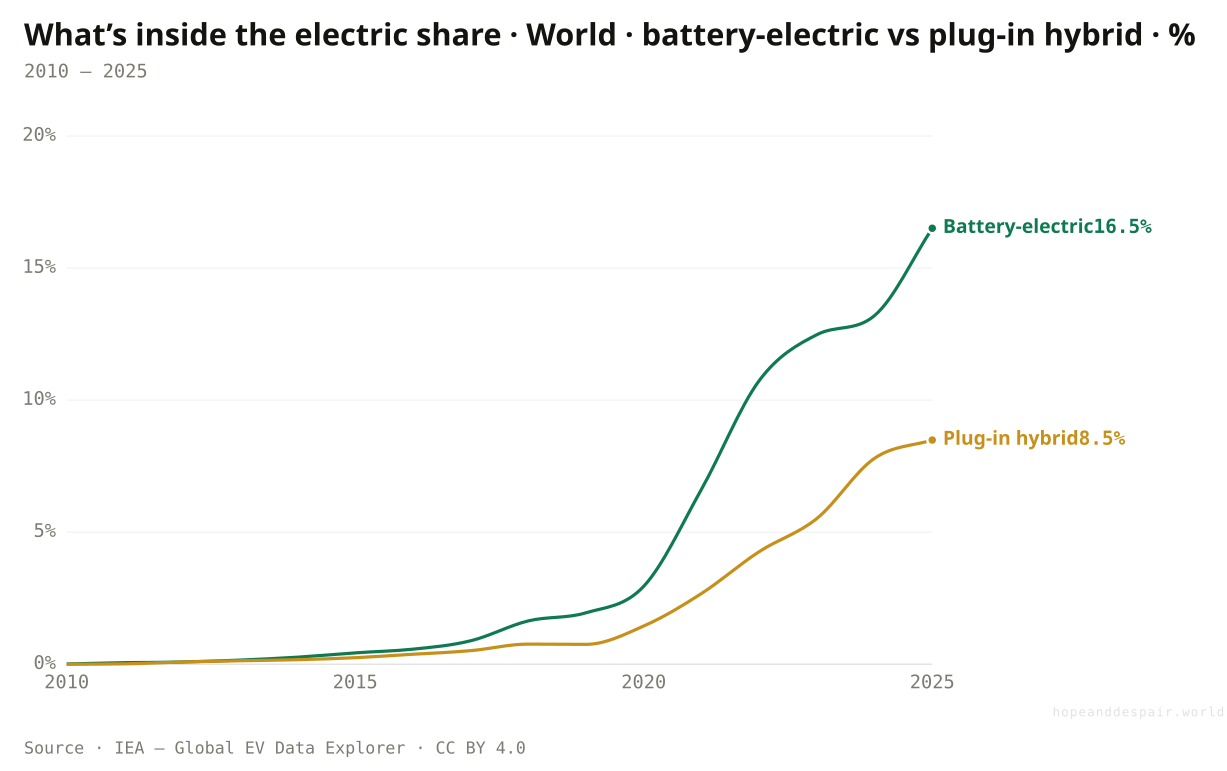
About a third of the world’s electric cars still carry a petrol engine.
The word electric hides a split. Of the quarter of new cars that counted as electric in 2025, about 16 percent were fully battery-powered with no engine at all, while another 8 percent were plug-in hybrids that carry both a battery and a petrol engine. That second group is the asterisk on the headline: a plug-in hybrid is only clean if its owner actually plugs it in, and studies keep finding that many do not, driving on petrol with a dead battery in the boot. China leans on these cars harder than most, with a fifth of its new cars being plug-in hybrids. They are a genuine bridge for buyers nervous about range, and a genuine loophole for anyone counting tailpipes. How much of the electric boom is truly engine-free depends on which half of this chart you trust.
How this number was made
What it measures. Battery-electric share of new cars sold, World
Calculation. Selected entity World.
The displayed line is monotone-cubic smoothed for legibility only — it never moves a data point.
Most of the electric share, and a rising majority of it, is fully battery-powered cars that never burn a drop of fuel.
A growing slice is plug-in hybrids that still have an engine and, too often, run on it; the clean-car number is flattered by them.
Whether plug-in hybrids are a useful bridge or a delay tactic is genuinely disputed, and the honest answer depends on whether owners charge them.
Does an electric car actually cut carbon?
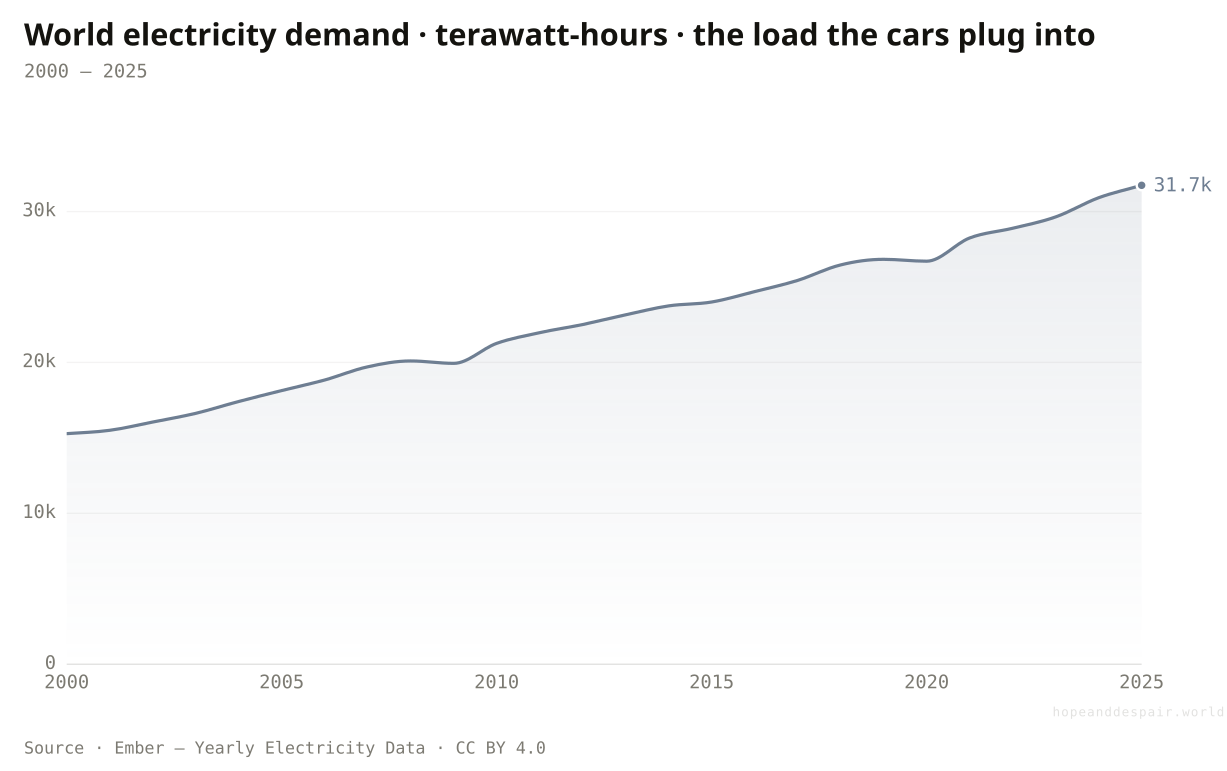
An electric car is only as clean as the electricity that charges it.
An electric car has no tailpipe, but it does have a power cord, and that cord runs back to a grid that is still more than half fossil-fueled. Charge a car on coal power and you have not erased the emissions so much as moved them from the street to the smokestack, where at least they can be cleaned up at one big source rather than a million small ones. This is why the electric car and the clean grid are one project, not two. Plugging in hundreds of millions of cars also adds to electricity demand, which has already more than doubled this century, from about 15,300 to nearly 31,700 terawatt-hours. The car gets cleaner every year only because the grid behind it does too. The honest verdict on the electric car is, in the end, the verdict on the power station it draws from.
How this number was made
What it measures. Electricity demand, World
Calculation. Selected entity World.
The displayed line is monotone-cubic smoothed for legibility only — it never moves a data point.
As the grid cleans up, every electric car already on the road quietly gets greener with it, with no new purchase needed.
On a fossil-heavy grid an electric car’s climate gain is partial, and the new charging load can itself lean on coal and gas.
The net carbon saving depends on local grid mix and battery manufacturing, so it varies enormously from one country to the next.
One in four new cars is electric, and most cars on the road still are not. The first number is the revolution; the second is how long revolutions take.— Flow versus fleet
One question, read by the fields that actually study it. Each voice is given both its most hopeful and its darkest honest reading — with a note on how settled the evidence underneath is.
the hopeful readIn many markets an electric car is now cheaper to own over its life, and nicer to drive: instant torque, no fuel stops, almost no servicing.
the darker readThe sticker price is still higher, public charging is patchy outside rich cities, and a flat battery on a long drive is a real fear, not an imagined one.
the hopeful readEvery petrol car not sold is roughly fifteen years of tailpipe CO₂ that never happens; the sales shift is locking in future savings now.
the darker readMore than a billion combustion cars are already on the road, and they will keep burning fuel for decades whatever the new-sales number does.
the hopeful readCars sit parked 95 percent of the time, so a smart fleet is a giant, distributed battery that can charge on cheap midday solar and steady the grid.
the darker readHundreds of millions of chargers are an enormous new load, and if everyone plugs in at 6pm the peaks could strain networks built for less.
the hopeful readCheap Chinese EVs and electric two-wheelers let poor countries skip the petrol era the way they skipped landlines, cutting both emissions and oil import bills.
the darker readWithout a domestic industry, going electric means importing finished cars and the jobs and value that come with them, deepening dependence on China.
Strongest case for hope
The hard part, getting people to want the thing, is done. An electric car is now the better product in a growing list of markets: cheaper to run, quicker, quieter, simpler. That is why sales went from a rounding error to a quarter of the world’s new cars in fifteen years, the steepest adoption curve in the car’s history, and why China, the largest market on Earth, is already majority-electric. The cost curve that did this to solar is now doing it to batteries, and China’s volume is dragging prices down for everyone. Sales lead, the fleet follows, and the grid that charges these cars is cleaning up at the same time. The direction is no longer in doubt. Petrol’s century is ending; the only argument left is about the year.
Strongest case for despair
A quarter of new sales is not a quarter of the road. The world has well over a billion petrol and diesel cars already built, and they will keep burning fuel for the fifteen-plus years each one lasts, no matter what the showroom does. The boom is dangerously lopsided: almost two of every three electric cars are sold in one country, while the largest rich economy electrifies barely one new car in ten and much of the emerging world is years behind. And the win is conditional. On a grid that is still more than half fossil-fueled, an electric car cuts emissions only partly, and shifts the rest to a power plant and a battery mine. The revolution is real in the brochure. On the road, it has barely started.
The verdict turns decisively hopeful when the stock, not just the sales, goes electric — when the count of petrol cars on the road starts falling year on year, because new EVs are arriving faster than old cars are scrapped.
Watch whether the laggards, above all the United States, join the curve or fall further off it; watch whether cheap EVs reach the emerging markets where most of the next billion cars will be bought; and watch the grid, because a clean car on a dirty grid is only half a solution.
The number that ultimately matters is not the share of new cars sold. It is the day the world’s fleet of combustion engines begins to shrink.
Everything done to the numbers between the source and the chart, disclosed in full. Where a choice is editorial rather than measured, we say so.
- Electric car sales share
- The share of new passenger cars sold in a year that are fully electric (battery-electric) or plug-in hybrid, from the IEA Global EV Data Explorer. It is a flow measure: new sales, not the existing fleet.
- Stock vs. sales
- Sales and sales-share charts cover new vehicles sold in a year; the fleet share (Figs. 9–10) and the stock count (Fig. 11) cover vehicles on the road. The fleet lags sales by many years because the average car lasts well over a decade — that gap is the article’s central caveat.
- Modes and two-wheelers
- The IEA reports each measure separately for cars, two/three-wheelers, vans, buses, and trucks. Figs. 7–8 use those modes to show that the boom is concentrated in cars and small two-wheelers, while freight lags. India’s two/three-wheeler share runs well above its car share.
- Battery-electric vs plug-in hybrid
- The IEA counts both as 'electric’. Battery-electric (BEV) cars have no engine; plug-in hybrids (PHEV) carry a battery and a petrol engine and only run clean when charged. Fig. 12 splits the two; the headline sales-share figures add them together.
- Licence
- The EV series come from the IEA Global EV Data Explorer, licensed CC BY 4.0, and are re-hosted with downloads and attribution (DATA.md §9). The separate Global EV Outlook report is Non-CC and is cited, not re-hosted. Electricity demand (Fig. 13) is from Ember, also CC BY 4.0.
- The entities
- Countries and regions are IEA/OWID definitions. 'Europe’ and 'European Union (27)' are reported separately by IEA; this article uses 'Europe’. Emerging-market coverage is limited to the countries IEA reports, which omits several large ones.
- Electricity demand
- World electricity demand in terawatt-hours, from Ember’s Yearly Electricity Data (CC BY 4.0), shown as the load EVs plug into; see the companion green-transition article for how clean that load is.
- Battery costs
- The collapse in lithium-ion battery-pack prices (BloombergNEF) is the mechanism behind the sales curve, but it traces to no series re-hostable here, so it is described qualitatively and not charted, per the never-invent-a-number rule.
- IEA — Global EV Data Explorer — www.iea.org/data-and-statistics/data-tools/global-ev-data-explorer ↗ · CC BY 4.0 · vintage 2026-06-13The CC BY 4.0 source re-hosted here: sales, stock, fleet share, by-mode and two/three-wheeler series, by country and powertrain. Data downloadable under each figure.
- IEA — Global EV Outlook 2026 (report) — www.iea.org/data-and-statistics/data-product/global-ev-outlook-2026 ↗ · link-only · vintage 2026The IEA’s flagship EV analysis. Its data product is licensed Non-CC (restricted), so it is cited here, not re-hosted — the figures are drawn from the CC BY Explorer instead.
- Our World in Data — Electric car sales (IEA) — ourworldindata.org/electric-car-sales ↗ · CC BY 4.0 · vintage 2026-06-13Source for the battery-electric vs plug-in-hybrid breakdown (Fig. 12), processed from the same CC BY IEA data.
- Ember — Yearly Electricity Data — ember-energy.org/data/yearly-electricity-data ↗ · CC BY 4.0 · vintage 2026-06-13World electricity demand (Fig. 13) — the grid the cars plug into. Downloadable under the figure.
- BloombergNEF — Lithium-ion Battery Price Survey — about.bnef.com/blog/lithium-ion-battery-pack-prices-see-largest-drop-since-2017 ↗ · link-only · vintage 2024The battery-cost decline behind the affordability of EVs. Cited as mechanism; not charted, as it traces to no re-hostable series.
Cite this page
Reference
Hope & Despair. “Is the electric-car revolution real?.” Hope & Despair, 2026. https://hopeanddespair.world/questions/is-the-electric-car-revolution-real.
BibTeX
@misc{hopeanddespair:is-the-electric-car-revolution-real,
  author       = {{Hope & Despair}},
  title        = {{Is the electric-car revolution real?}},
  year         = {2026},
  howpublished = {\url{https://hopeanddespair.world/questions/is-the-electric-car-revolution-real}},
  note         = {hopeanddespair.world, updated 2026-06-14}
}
Original prose, code, and chart designs are released under CC BY 4.0 ↗ — reuse freely with attribution. Source datasets keep their own licences, listed above. Add your access date when citing.
- Mobile-first chart system + redesign branch snapshot View diff →
Generated from the commit history — every edit to a number, a word, or a chart is tracked in the open. Browse the full history & diffs on GitHub →
in plain words
Still lost? Read this.
Two numbers tell the whole story, and people argue about which one to say first.
The first is the brochure. One in four new cars sold in the world in 2025 was electric, up from basically none fifteen years ago. In China it was more than half. In Norway it was almost all of them. Electric cars got cheaper, quicker, and nicer to drive, so people started buying them not to save the planet but because they are the better car. That is a genuine technology tipping point, the fastest the car has ever seen, and it is not reversing.
The second is the road. Most of the cars actually driving around are still petrol, because a car you buy today is still on the road in fifteen years, so the fleet changes slowly even when sales flip fast. The boom is also lopsided. Almost two of every three electric cars are sold in China; the United States is barely electrifying; and much of the poorer world is years behind on cars, even where it is racing ahead on electric scooters and rickshaws. And an electric car is only as clean as the electricity it runs on, which is why this story and the story of the power grid are really one story.
The honest line for dinner: the electric car has already won the showroom and barely started on the road. The revolution is real, it is fast, and it is also going to take longer than the headline number makes it sound. Watch for the year the world’s petrol cars start disappearing faster than new ones arrive. That is the day the revolution reaches the street.