Question 06 · Energy
Is the green transition actually happening?
Solar got about five hundred times cheaper and wind and solar now make a sixth of the world’s electricity. The same quarter-century burned more coal than any before it. Both sentences are true, and which one you lead with is the whole argument.
you read
- Electricity is not energy. This article is about the power sector — the wires and plugs — which is only about a fifth of all the energy humanity uses. Transport, heating, and heavy industry mostly still burn fuel directly, and decarbonize far slower. A clean grid is the first step of the transition, not the finish line.
- “Low-carbon” (or “clean”) means renewables plus nuclear — hydro, wind, solar, bioenergy, geothermal, and nuclear fission, following Ember’s definition. It measures carbon, not environmental purity: dams flood valleys, nuclear leaves waste, and mining the metals for panels and batteries has its own cost.
- Share and tonnage answer different questions. A source’s share of the mix can fall while its absolute output rises, if total demand grows faster. Most of this article lives in that gap, and the two readings rarely agree.
- Every chart runs on real ingested data — electricity from Ember (CC BY 4.0), solar prices and CO₂ from Our World in Data, electricity access from the World Bank — with the source, data package, and lineage downloadable under each figure. Series run 2000–2025 unless noted.
Are wind and solar actually taking off?
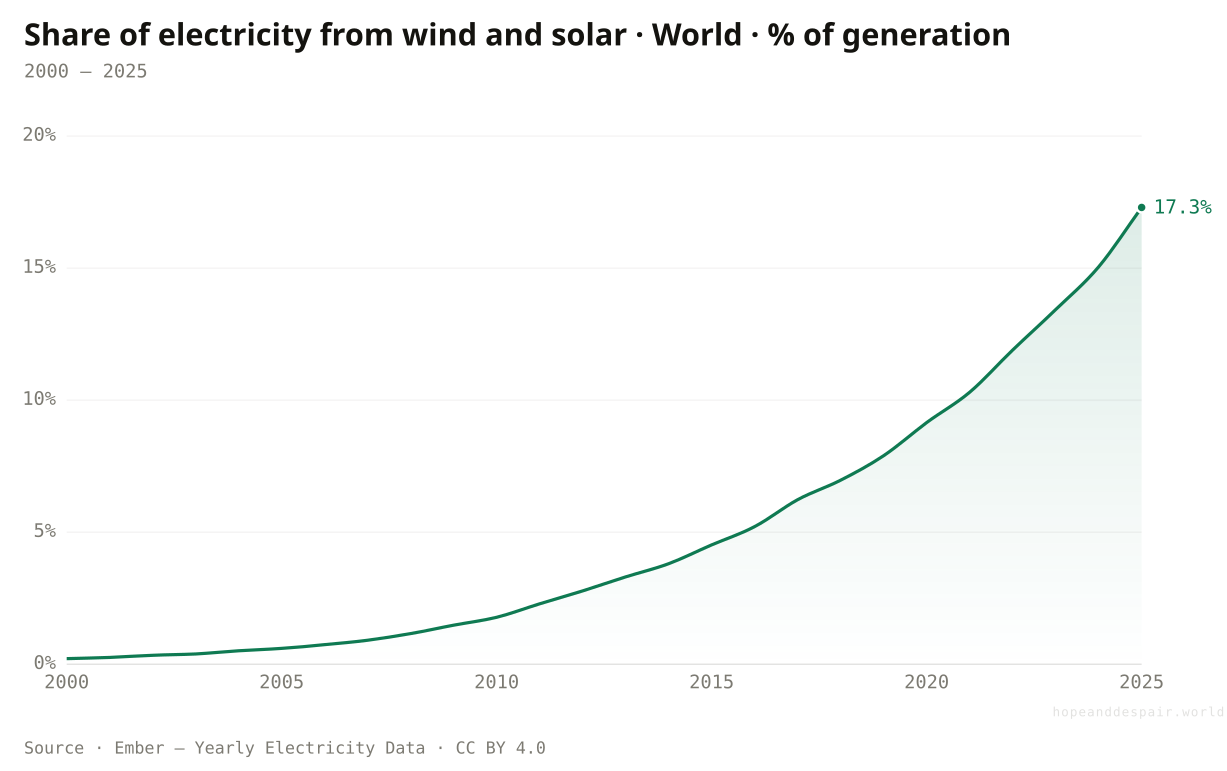
Wind and solar went from a rounding error to a sixth of the world’s electricity.
In 2000, wind turbines and solar panels together made about two parts in every thousand of the world’s electricity. You could have rounded them to zero and lost nothing. By 2025 they made about 173 of every thousand, a sixth of all the power humanity generates, from a standing start, inside the working life of a single coal plant. No energy source has ever scaled this fast. The reason is dull and decisive: a solar panel is a manufactured product, not a construction project, so each year’s factories turn out more for less. The line still has far to climb. Five of every six units of the world’s electricity come from somewhere else, and most of that somewhere is still fire.
How this number was made
What it measures. Share of electricity from wind and solar, World
Calculation. Selected entity World.
The displayed line is monotone-cubic smoothed for legibility only — it never moves a data point.
In one generation the world built the fastest-scaling source of energy in history, and it is still accelerating.
After all that growth, wind and solar still make only a sixth of the world’s electricity; the other five-sixths is the hard part.
Whether the exponential continues or flattens depends on grids, storage, and minerals that have their own, slower curves.
Why now, and not in the 1980s?
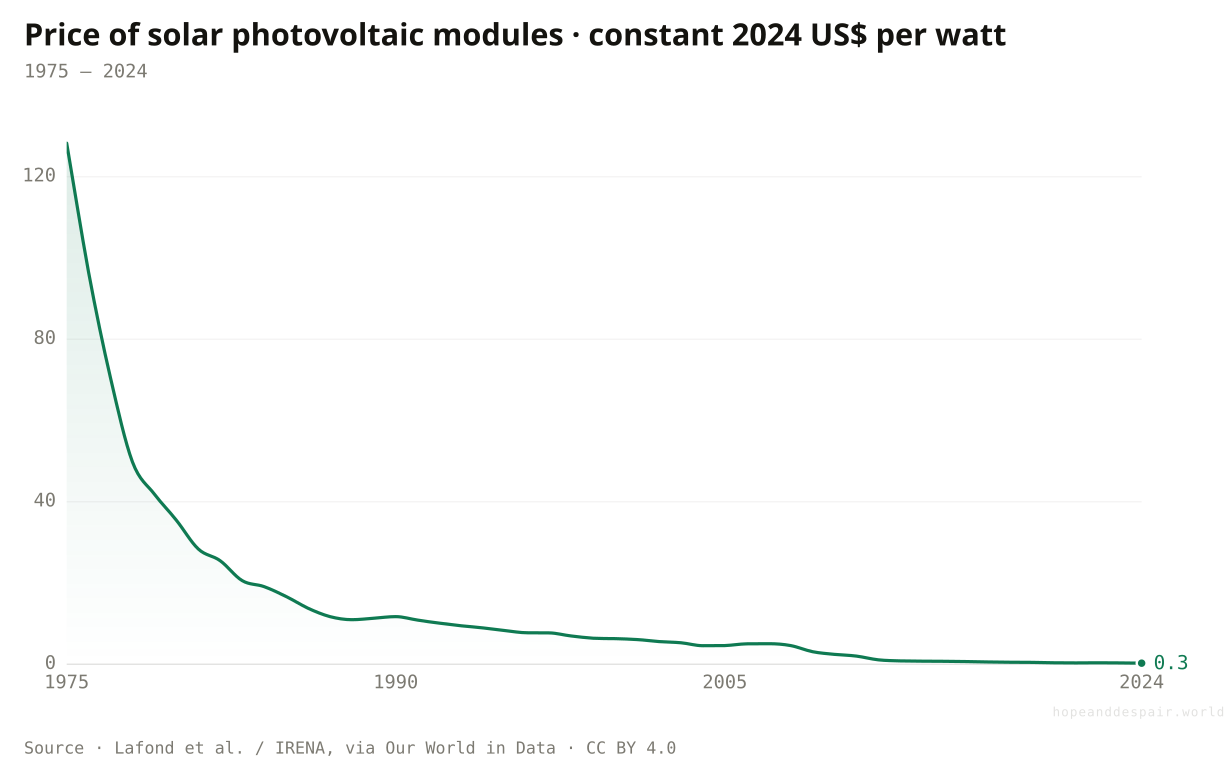
Solar electricity costs roughly one five-hundredth of what it did in 1975.
A solar module that cost about 128 dollars for each watt of capacity in 1975 costs about 26 cents today. Turned around: the same dollar now buys roughly five hundred times more solar than it did when the first cells went onto satellites and pocket calculators. This is the engine under every other chart here. Panels cheapen for the same reason screens and chips did: every time the world doubles the total it has ever manufactured, the price falls by about a fifth, and it has doubled many times over. Policy lit the fire; the cost curve carried it. What the falling price does not buy is the rest of the system. Wires, batteries, and permits ride no such curve, and they are now the slow part.
How this number was made
What it measures. This data is expressed in US dollars per watt, adjusted for inflation.
Calculation. Selected entity World.
The displayed line is monotone-cubic smoothed for legibility only — it never moves a data point.
The cleanest source is now also among the cheapest to build almost everywhere on Earth — the economics flipped, permanently.
A cheap panel at noon does nothing at midnight; the cost of firming solar into reliable power is the bill still coming due.
How far the curve bends from here — and whether batteries follow it — decides how much of the grid solar can actually carry.
Is electricity decarbonizing overall, or just adding solar?
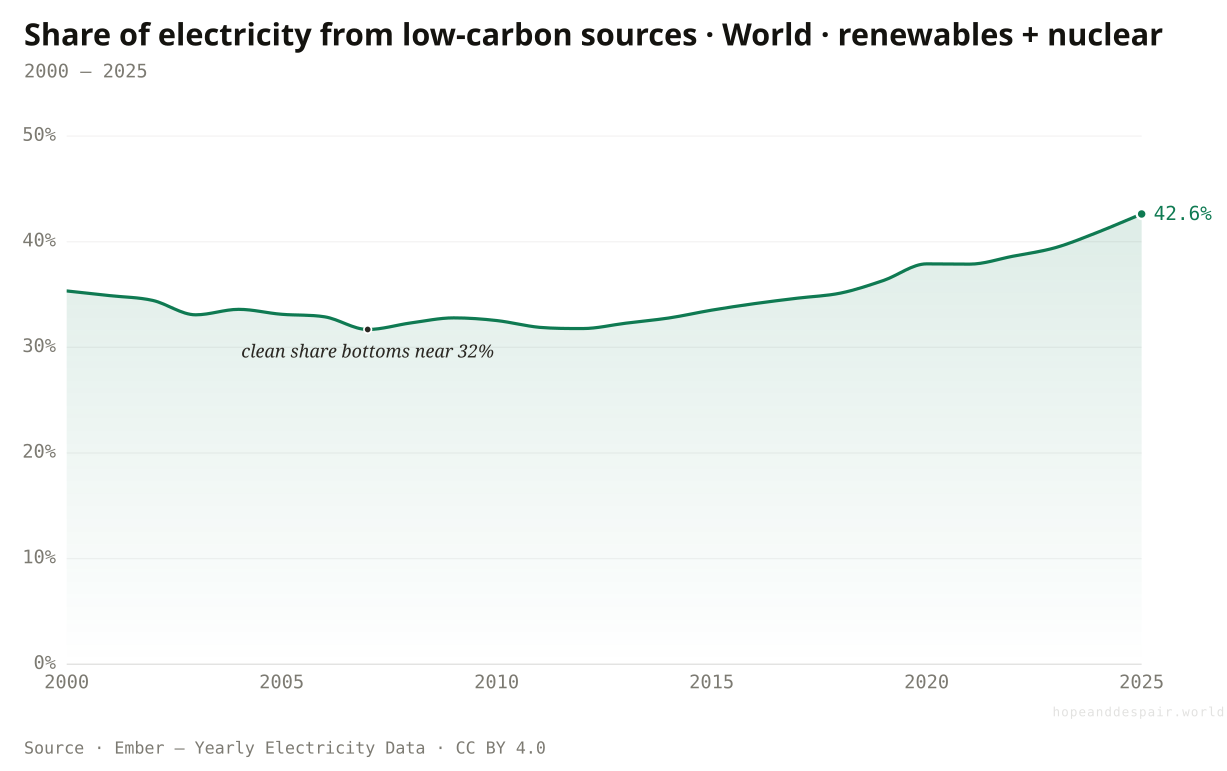
The low-carbon share has crept up, and for a decade it went backwards.
Add up everything low-carbon (hydro dams, nuclear reactors, wind, solar, a little geothermal) and in 2000 it made about 35 percent of the world’s electricity. A quarter-century later it makes about 43. That is real movement, far slower than the wind-and-solar rocket suggests, and for years it ran in reverse: the clean share fell to under 32 percent by 2007, as Asia’s coal boom outgrew everything green. The new wind and solar spent its first decade just clawing back the ground that flat nuclear and slow-growing hydro had lost. Only lately has it lifted the whole number. A surge in one clean source is not the same thing as a clean grid.
How this number was made
What it measures. Share of electricity from low-carbon sources, World
Calculation. Selected entity World.
The displayed line is monotone-cubic smoothed for legibility only — it never moves a data point.
The grid is the cleanest it has ever been, and the trend has finally turned decisively upward.
Twenty-five years of effort moved the low-carbon share by about seven points; at that pace a fully clean grid is generations away.
How much of the recent gain is durable versus a temporary lull in demand growth is not yet clear.
How fast is solar alone moving?
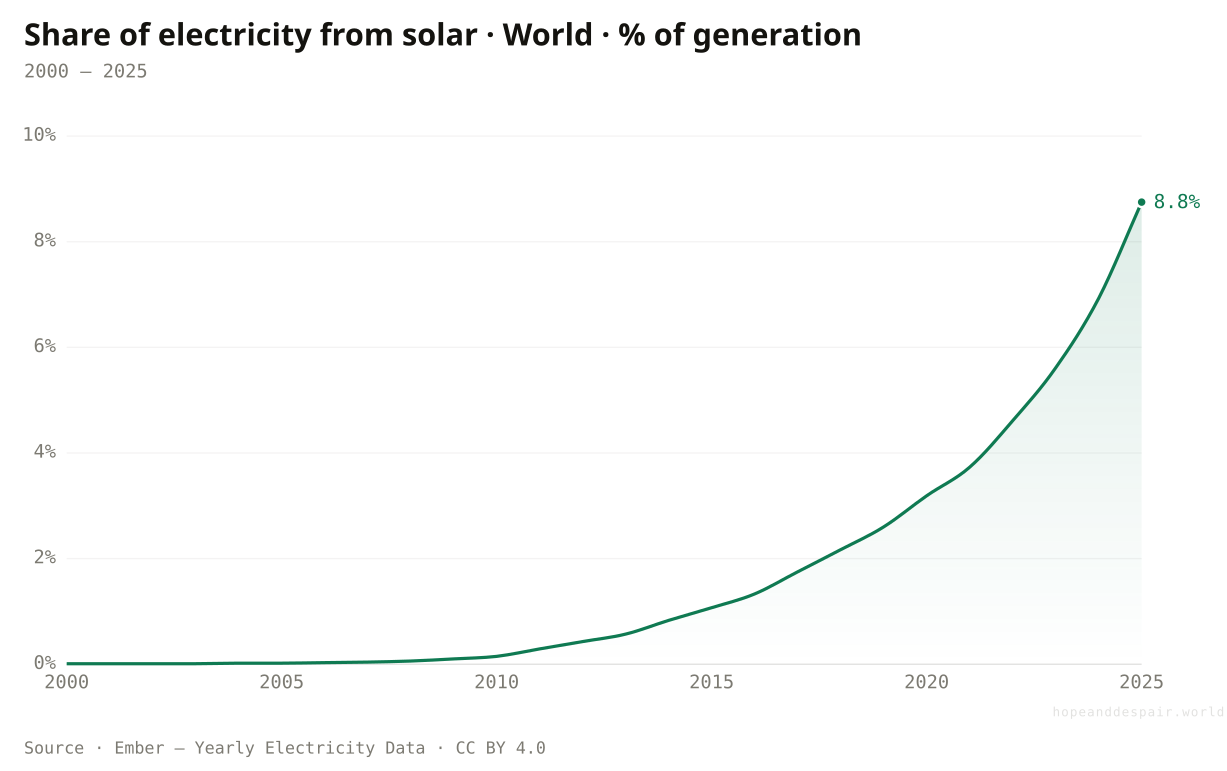
Solar went from one part in ten thousand to nearly a tenth of world electricity.
Count the doublings. Solar’s slice of the world’s power has roughly doubled every three years for two decades, the nearest thing the energy world has to the law that ran computing. That kind of compounding is how a source worth one part in ten thousand in 2000 reached close to nine hundred by 2025. Hold the pace even a few more doublings and solar stops being a garnish and becomes the spine of the system. The catch is the plain one: the sun sets. A panel generates for only about a fifth of the hours in the year where it sits, so its rise is also a story about the other four-fifths, which is a story about batteries and gas, and that story is only beginning.
How this number was made
What it measures. Share of electricity from solar, World
Calculation. Selected entity World.
The displayed line is monotone-cubic smoothed for legibility only — it never moves a data point.
Solar is scaling on a curve no other energy source has matched, and is still in its steep stretch.
A tenth of the grid from a source that vanishes every night is easy; the last, firmest fraction is where the cost and difficulty hide.
Whether the doubling holds or saturates as solar saturates sunny daytime hours is the open question of the 2030s.
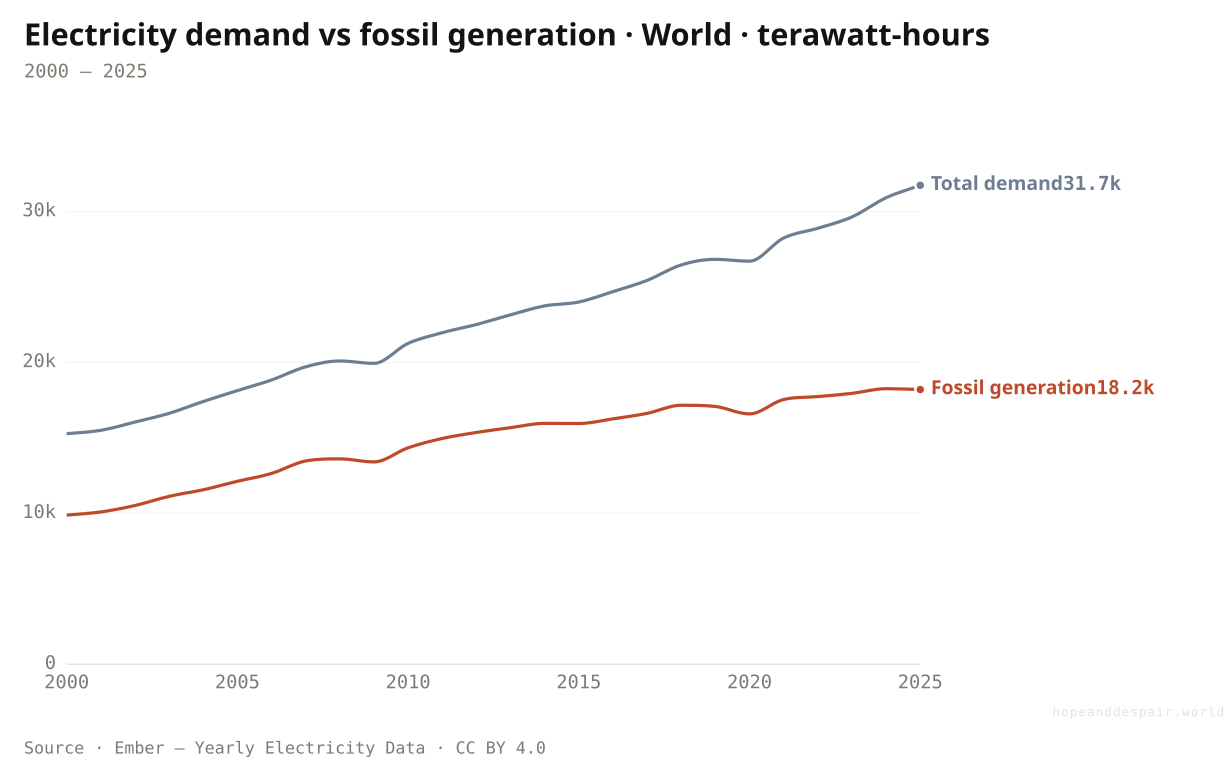
Is clean power replacing fossil fuel, or just adding to it?
Clean power raced up. Demand raced up faster, so fossil generation nearly doubled.
Here is the chart that holds the whole argument. Since 2000 the world’s appetite for electricity has more than doubled, from about 15,300 to nearly 31,700 terawatt-hours, as billions of people bought a first fridge, a fan, a phone to charge. Clean power grew quickly, but it spent most of its effort feeding that new hunger rather than retiring old coal and gas. So the fossil line climbed too, from roughly 9,900 to over 18,000 terawatt-hours. Both things are true at once: the cleanest grid in history and the most fossil fuel ever burned to make power. A rising share and a rising tonnage do not contradict each other. They are what it looks like when the pie grows faster than the new slice.
How this number was made
What it measures. Electricity demand, World
Calculation. Selected entity World.
The displayed line is monotone-cubic smoothed for legibility only — it never moves a data point.
Clean energy has begun to take a real bite out of demand growth; without it, the fossil line would be far higher.
Twenty-five years into the transition, the world burns nearly twice as much fossil fuel for power as it did at the start.
Demand growth could slow as economies mature, or surge again with AI data centres and electrified transport — the gap’s future is unsettled.
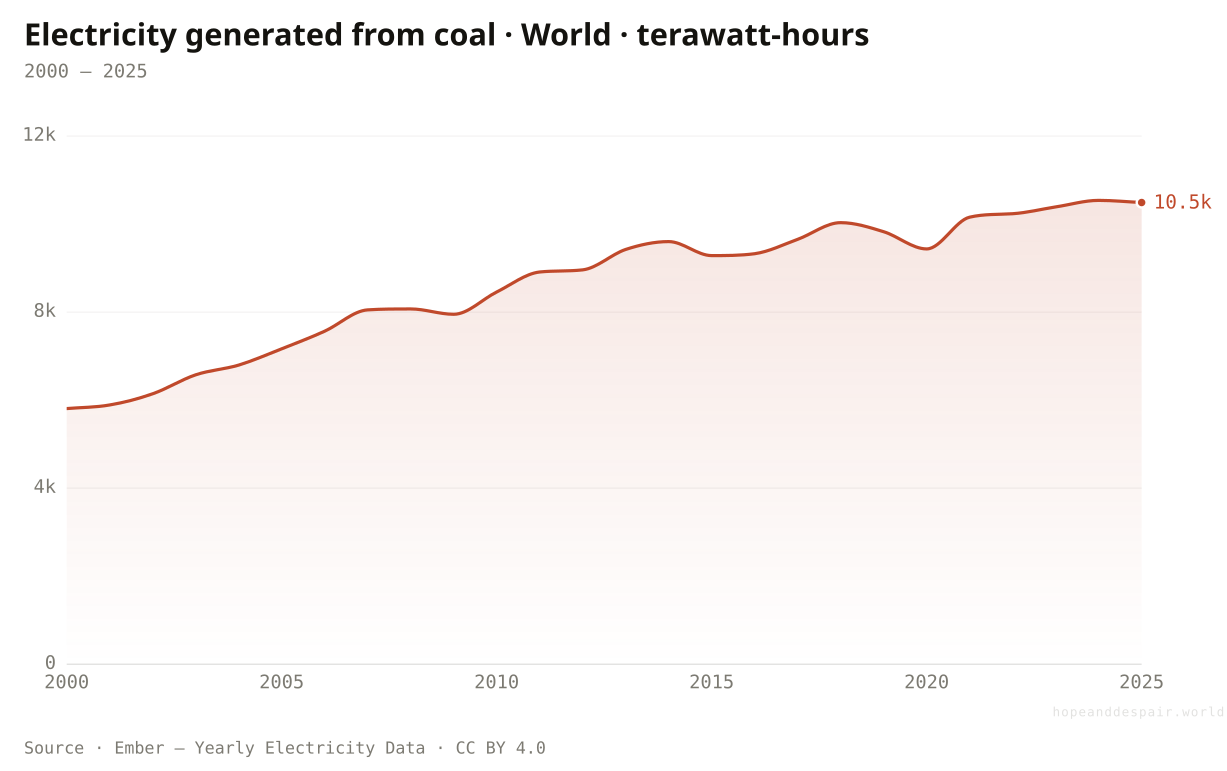
Is the world finally burning less coal?
Coal power just had its biggest year ever.
The single dirtiest way to make electricity reached an all-time high. World coal generation rose from about 5,800 terawatt-hours in 2000 to a record near 10,500 in 2024, almost doubling across the same years that made solar a marvel of cheapness. The two facts sit side by side because they sit in different countries. As the United States and Europe shut coal plants, China and India opened them faster, to run factories and cities that did not exist a generation ago. Coal’s share of the global mix is slowly slipping. Its absolute output keeps breaking records. The transition has bent the growth of coal. It has not yet turned it down.
How this number was made
What it measures. Electricity generated from coal, World
Calculation. Selected entity World.
The displayed line is monotone-cubic smoothed for legibility only — it never moves a data point.
Coal’s share of the mix is in slow retreat, and growth in coal power has nearly stalled as renewables undercut it.
A quarter-century into the transition, the world made more electricity from coal in 2024 than in any year in history.
Whether the coal plateau becomes a decline this decade hinges almost entirely on China.
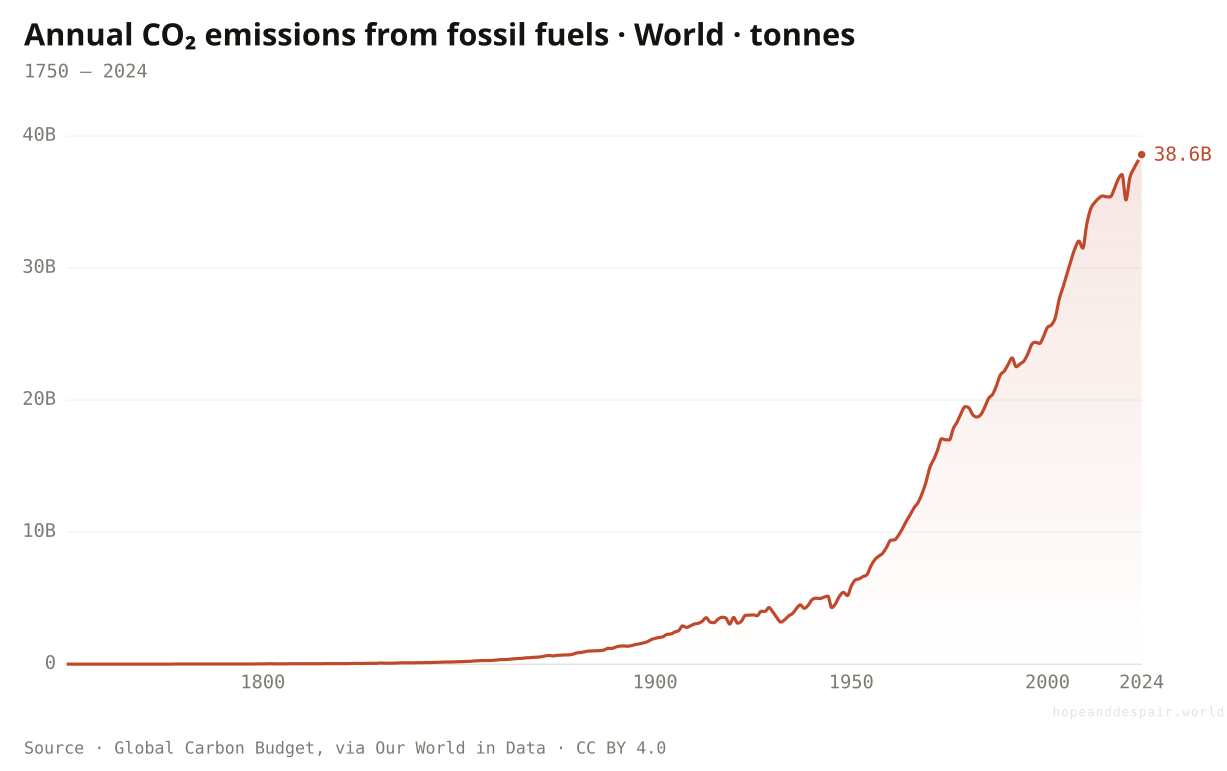
Are emissions finally turning over?
For all of it, CO₂ emissions are still climbing to new records.
Step back from the power sector to the thing it is meant to fix. In 2024 humanity put about 38.6 billion tonnes of carbon dioxide into the air from fossil fuels, more than in any year before. The line has pointed upward for two centuries and has not yet bent over. Electricity is only one source among several: cars, ships, furnaces, cement kilns, and cleared land all add their share, and most of those have barely started to change. This is the honest floor of the whole story. Every hopeful chart above it is real, and not one of them has yet done the single thing that would matter most, which is to make this line fall.
How this number was made
What it measures. Annual total emissions of carbon dioxide (CO₂), excluding land-use change, measured in tonnes.
Calculation. Selected entity World.
The displayed line is monotone-cubic smoothed for legibility only — it never moves a data point.
Emissions growth has slowed sharply, and several large rich economies have genuinely peaked and turned down.
The one line that ultimately matters has never been higher, and two centuries of effort have not yet bent it.
Whether 2024 proves near the peak or just another step up depends on choices being made right now, mostly in Asia.
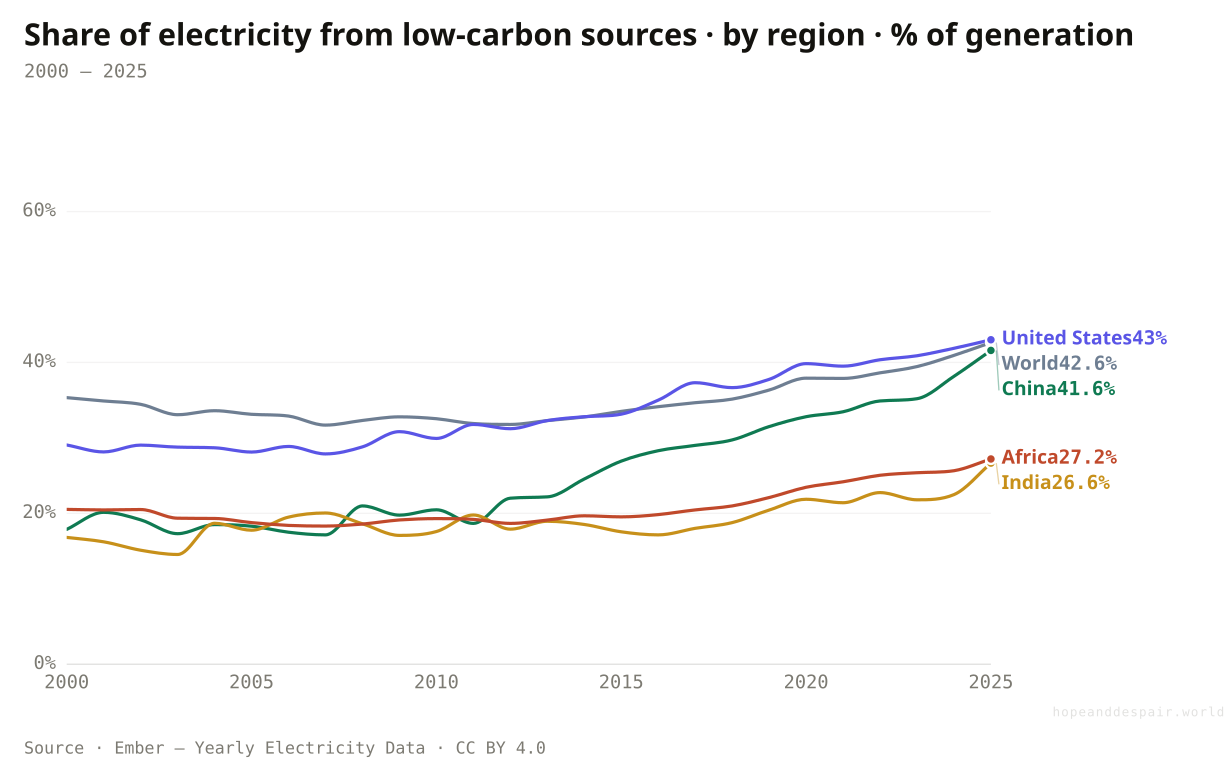
Where is the transition real, and where is it the opposite?
There is no single transition. There are at least four, at four speeds.
Pick a country and the word transition means something different. The United States began ahead and crept to 43 percent low-carbon power, mostly by swapping coal for gas and bolting on wind. China started at 18 percent and stormed to 42, building more clean capacity than any nation ever has while its economy quadrupled. India and Sub-Saharan Africa both sit near 27 percent, but for opposite reasons: India is racing to add power of every kind to a still-poor grid, while much of Africa is not transitioning at all, because it was never fully electrified. Four lines, four stories, and one tidy global average that belongs to none of them.
How this number was made
What it measures. Share of electricity from low-carbon sources, World
Calculation. Selected entity World.
The displayed line is monotone-cubic smoothed for legibility only — it never moves a data point.
China’s leap from 18 to 42 percent proves a huge, fast-industrializing economy can clean its grid at speed.
Africa has barely moved in twenty-five years, and India’s clean share still trails the world by a wide margin.
Each region’s path reflects its own geography, wealth, and politics, so no single one is a blueprint for the rest.
Does 'transition’ point the same direction everywhere?
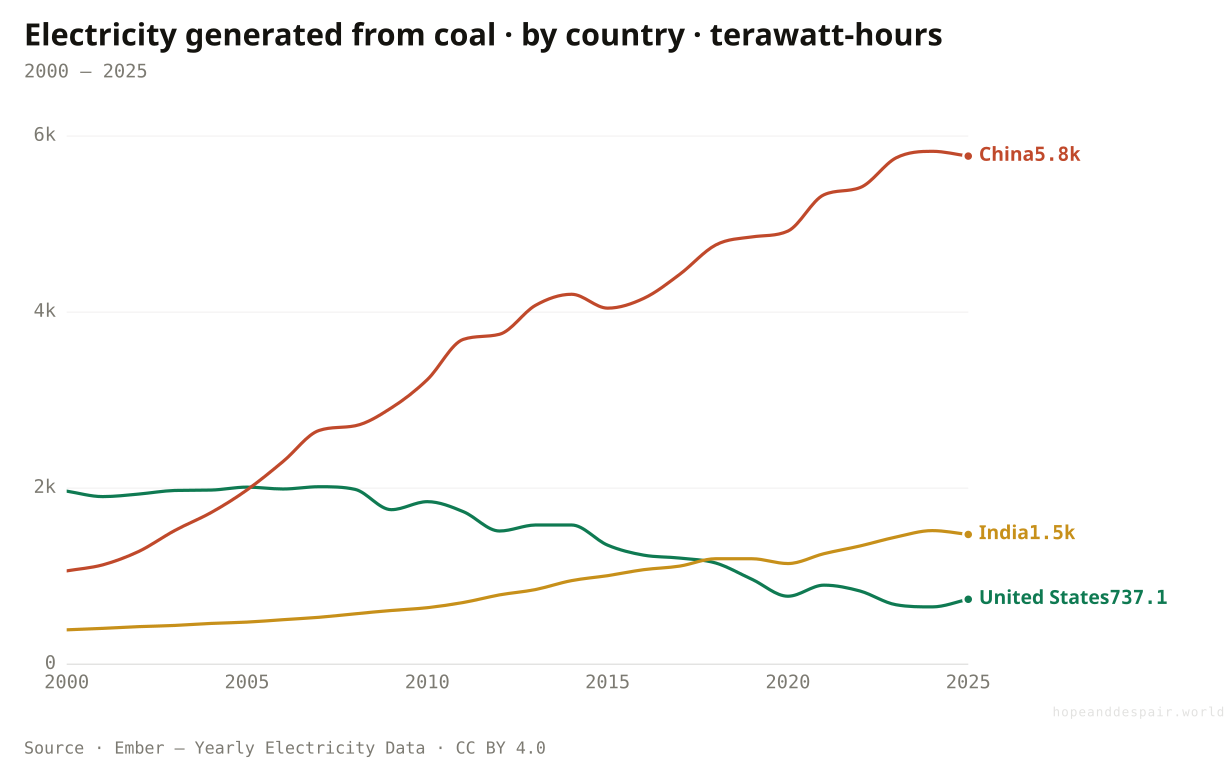
The decades that halved America’s coal quintupled China’s.
In 2000 the United States burned the most coal for power of any country, about 1,970 terawatt-hours of it. By 2025 it had cut that by almost two-thirds, to around 740, as cheap shale gas and then cheap renewables undercut its aging plants. Over the very same years China’s coal generation grew more than fivefold, past 5,700 terawatt-hours, and India’s nearly quadrupled. One country’s energy history ran backward through another’s. This is why a single global coal line hides the truth. It is the sum of a managed retreat in the rich world and a building boom in the industrializing one, and for now the boom is winning.
How this number was made
What it measures. Electricity generated from coal, United States
Calculation. Selected entity United States.
The displayed line is monotone-cubic smoothed for legibility only — it never moves a data point.
The United States shows a big economy can retire coal fast once cheaper options arrive — its coal output is down by almost two-thirds.
China and India added far more coal than the West retired, so the global total rose even as rich-country coal collapsed.
Whether China’s coal has now peaked is the most consequential unknown in the entire transition.
Who is actually deploying the most renewables?
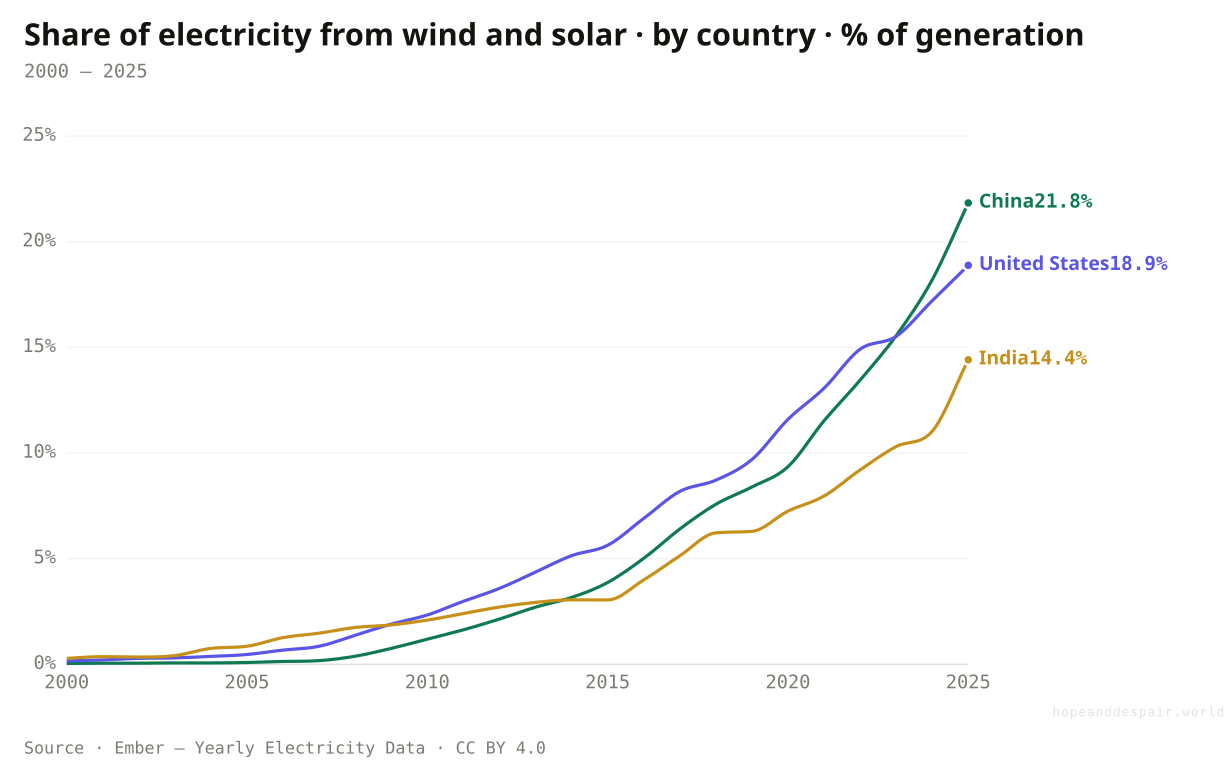
The country burning the most coal also deploys the most wind and solar.
The surprise in the deployment data is who leads. By 2025 wind and solar made almost 22 percent of China’s electricity, ahead of the United States at 19 and India at 14, each up from essentially nothing in 2000. The same country that set the world coal record is the one adding renewables fastest — it does both at full tilt because its demand is so vast that it reaches for every source at once. India is the one to watch: poorer, hungrier for power, climbing a steep solar curve from a low base. The deployment is real in all three. Whether it outruns the coal beside it is the question the next decade decides.
How this number was made
What it measures. Share of electricity from wind and solar, China
Calculation. Selected entity China.
The displayed line is monotone-cubic smoothed for legibility only — it never moves a data point.
Every major economy is now adding wind and solar at scale, led by the very countries with the most fossil fuel to displace.
Even the leader makes only about a fifth of its power from wind and solar, and is still expanding coal alongside it.
Building both at once leaves it genuinely open whether the clean additions will replace the coal or merely race it.
Who is left out of the question entirely?
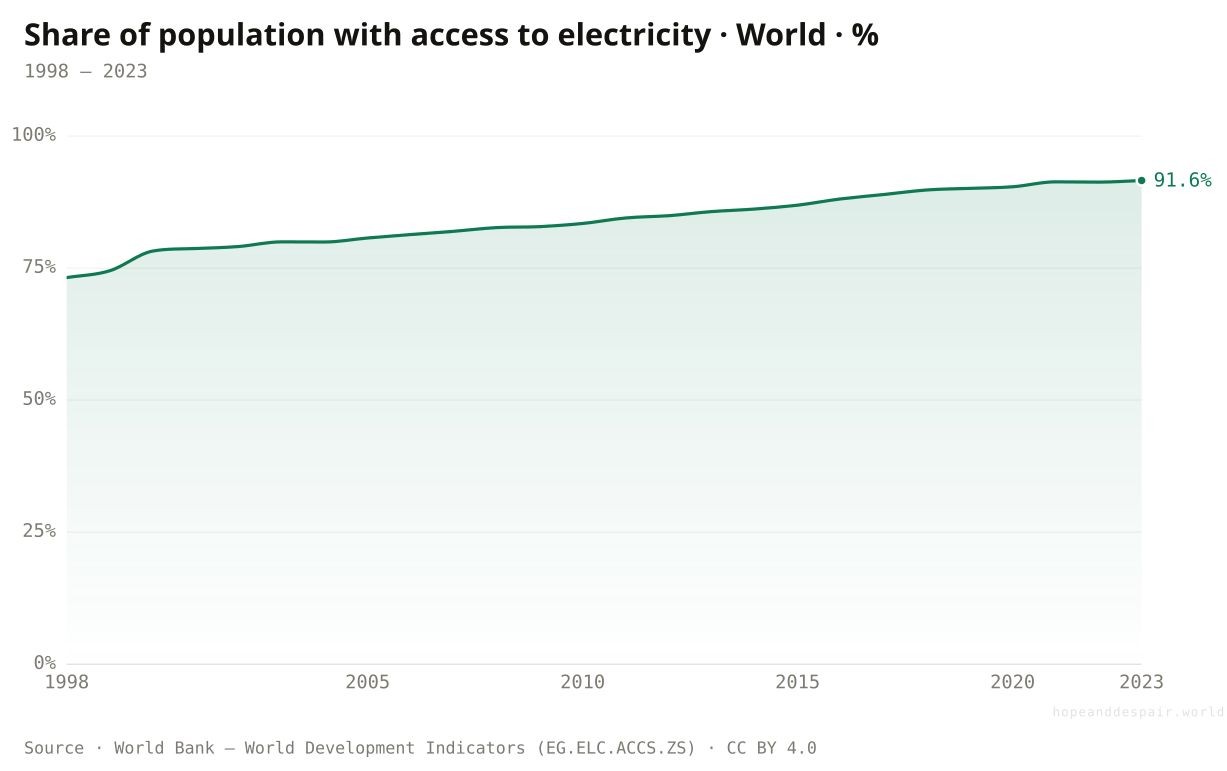
Almost everyone now has power. The last several hundred million are the hardest to reach.
Before a grid can go green it has to exist. In 1998 more than a quarter of humanity had no electricity at all; by 2023 that was down to under one person in eleven. Hundreds of millions got their first light switch in a single generation, more and more of it from solar panels and small grids that never needed a power station at all. But the share has stalled near 92 percent, and the roughly 700 million still in the dark are the hardest cases: remote villages, conflict zones, the poorest corners of Sub-Saharan Africa. For them the green-transition question barely lands. The question is not what kind of power. It is whether there is any.
How this number was made
What it measures. Access to electricity means having an electricity source that can provide very basic lighting, and charge a phone or power a radio for 4 hours per day.
Calculation. Selected entity World.
The displayed line is monotone-cubic smoothed for legibility only — it never moves a data point.
The world is closing in on universal electricity access, increasingly leapfrogging straight to off-grid solar.
Progress has stalled near 92 percent, leaving roughly 700 million people for whom clean power is not yet even the question.
Whether the last stretch is closed by grids or by distributed solar will shape what those new energy systems even look like.
Wind and solar are the fastest-scaling energy sources in history, and the world has never burned more fossil fuel to make electricity. Both sentences describe the same quarter-century.— The transition, in one breath
One question, read by the fields that actually study it. Each voice is given both its most hopeful and its darkest honest reading — with a note on how settled the evidence underneath is.
the hopeful readThe learning curve is relentless and global: every doubling of installed capacity cuts the price again, and it has not stopped. On price, the war is already won.
the darker readCheap panels are not a cheap grid. Storage, transmission, and the firming of intermittent power are where the cost now hides, and they fall far slower.
the hopeful readA peak is the necessary first step, and emissions growth has bent from exponential toward flat. That bend is the transition showing up in the only number that ultimately counts.
the darker readWhat the atmosphere integrates is total emissions, not the share of clean electricity. Until the absolute tonnage falls, a rising clean share only slows how fast the problem grows.
the hopeful readPoor countries can now leapfrog: build solar and skip the coal era, the way they skipped landlines for mobile phones. The cheapest new power on Earth is also the cleanest.
the darker readA country with no grid and a growing population needs reliable power tonight, and the cheapest firm option is often still a coal or gas plant. Telling it otherwise is a rich-country luxury.
the hopeful readBatteries are now on their own steep cost curve, and grids that were called impossible above 30 percent renewables are running past it without the lights going out.
the darker readA system that runs on weather needs backup, storage, and long wires that take a decade to permit and build. The panels are the easy part; the system around them is the bottleneck.
Strongest case for hope
The economics flipped, and that is permanent. Solar and wind are now the cheapest new power across most of the planet, so the transition no longer depends on virtue or treaties — it runs on self-interest. Wind and solar scaled from a rounding error to a sixth of world electricity in one generation and are still accelerating; solar alone has doubled its share every three years. China showed a giant industrial economy can vault from 18 to 42 percent clean power at speed. Emissions growth has bent from steep to nearly flat. The hardest curves left, storage and grids, are now bending the way panels already did. The question is no longer whether the clean system arrives, only how fast.
Strongest case for despair
Twenty-five years in, the world burns nearly twice as much fossil fuel for electricity as it did at the start, makes more power from coal than ever, and emits more CO₂ than in any year in history. The clean share rose just seven points, and spent a decade going backwards. Worse, this is the easy sector: electricity is only about a fifth of energy use, and the harder four-fifths (the trucks, furnaces, ships, and cement kilns) have barely begun. Clean power has mostly been added on top of demand growth, not subtracted from fossil use. A line that is still rising, however slowly, is not a transition. It is a slower increase.
The verdict turns hopeful for good the year global fossil generation falls and keeps falling, once clean additions exceed not just new demand but the existing fossil stock, so the absolute tonnage drops.
Watch China’s coal: it alone can bend or hold the global line. Watch whether battery costs keep falling fast enough to firm solar through the night. And watch the other four-fifths of energy, meaning transport, heat, and heavy industry, because a spotless grid still leaves most of the emissions problem standing.
The decisive number is not the clean share. It is the CO₂ line in Fig. 7, and the day it turns down.
Everything done to the numbers between the source and the chart, disclosed in full. Where a choice is editorial rather than measured, we say so.
- Electricity vs. energy
- Every Ember-sourced chart here is electricity only — the power sector — which is roughly a fifth of final energy use. Transport, heating, and industry burn fuel directly and are not in these series. A clean grid is a precondition for, not a proxy for, a decarbonized economy.
- Low-carbon / clean
- Ember’s definition: renewables (hydro, wind, solar, bioenergy, geothermal, wave/tidal) plus nuclear. The wind-and-solar series is the fast-growing subset; the low-carbon series adds the large but slow-growing hydro and nuclear base.
- Share vs. generation
- Share charts (%) show the mix; generation charts (terawatt-hours) show absolute output. They can move in opposite directions when total demand grows — the central tension of the article (Figs. 5, 6).
- The four entities
- United States, China, India, and Sub-Saharan-leaning 'Africa’ (Ember’s continental aggregate) were chosen as archetypes of the four speeds: the rich decarbonizer, the build-everything giant, the late industrializer, and the still-electrifying. The World line is shown for reference; it is an average none of them follows.
- Solar module price
- Lafond et al. / IRENA learning-curve series via OWID, in constant 2024 US$ per watt of module capacity. It is a module price, not a system or generation cost; balance-of-system and financing have fallen far less.
- CO₂ emissions
- Global Carbon Budget annual fossil-fuel and industry CO₂ via OWID, in tonnes. Economy-wide, not electricity-only, which is why it is the article’s reality check rather than one of its energy charts.
- Ember — Yearly Electricity Data — ember-energy.org/data/yearly-electricity-data ↗ · CC BY 4.0 · vintage 2026-06-13Per-country and per-region electricity generation, demand, and mix by source, 2000–2025. Re-hosted directly under the open licence; OWID’s energy graphers blend in proprietary data and are link-only.
- Our World in Data — Solar PV module prices (Lafond et al. / IRENA) — ourworldindata.org/grapher/solar-pv-prices ↗ · CC BY 4.0 · vintage 2026-06-13Learning-curve price series; the canonical illustration of Swanson’s law / Wright’s law for solar.
- Our World in Data — Annual CO₂ emissions (Global Carbon Budget) — ourworldindata.org/grapher/annual-co2-emissions-per-country ↗ · CC BY 4.0 · vintage 2026-06-13Global Carbon Project / Global Carbon Budget, fossil-fuel and industry CO₂. Economy-wide, the why-it-matters spine.
- World Bank — Access to electricity (EG.ELC.ACCS.ZS) — data.worldbank.org/indicator/EG.ELC.ACCS.ZS ↗ · CC BY 4.0 · vintage 2026-06-13World Development Indicators, from the World Bank’s Tracking SDG 7 electrification database.
- IEA — Renewables 2024 / Electricity 2025 — www.iea.org/reports/renewables-2024 ↗ · link-only · vintage 2024Restricted terms — cited, not re-hosted. Corroborates the deployment surge and the demand-growth story behind Fig. 5.
- IEA — Global EV Outlook 2024 — www.iea.org/reports/global-ev-outlook-2024 ↗ · link-only · vintage 2024The transport side the power-sector data leaves out, and the subject of the companion EV article.
Cite this page
Reference
Hope & Despair. “Is the green transition actually happening?.” Hope & Despair, 2026. https://hopeanddespair.world/questions/is-the-green-transition-happening.
BibTeX
@misc{hopeanddespair:is-the-green-transition-happening,
  author       = {{Hope & Despair}},
  title        = {{Is the green transition actually happening?}},
  year         = {2026},
  howpublished = {\url{https://hopeanddespair.world/questions/is-the-green-transition-happening}},
  note         = {hopeanddespair.world, updated 2026-06-14}
}
Original prose, code, and chart designs are released under CC BY 4.0 ↗ — reuse freely with attribution. Source datasets keep their own licences, listed above. Add your access date when citing.
- Mobile-first chart system + redesign branch snapshot View diff →
Generated from the commit history — every edit to a number, a word, or a chart is tracked in the open. Browse the full history & diffs on GitHub →
in plain words
Still lost? Read this.
Two things are true at the same time, and almost every argument about clean energy is really a fight over which one to say first.
The first is astonishing. Solar power got about five hundred times cheaper since the 1970s, which is why wind and solar went from basically nothing to a sixth of the world’s electricity in a single generation. Nothing in the history of energy has ever grown this fast. The transition is real, it is accelerating, and it now happens because clean power is the cheap option, not because anyone is being noble about it.
The second is sobering. Over those exact same years, the world’s hunger for electricity more than doubled, so clean power mostly went to feed the new demand instead of switching off old coal and gas. The result is that the world now burns more fossil fuel for electricity than ever, made more power from coal in 2024 than in any year in history, and put more carbon into the air than at any point in two centuries. A bigger clean slice of a much bigger pie can still mean more fossil fuel, in tonnes, than before.
And it is not one transition but four. The United States cut its coal power by almost two-thirds. China built the most wind and solar on Earth and the most coal, at the same time. India is still industrializing on coal even as it adds solar fast. Much of Africa has not started, because hundreds of millions of people there are still waiting for any electricity at all.
The honest one-liner for dinner: the green transition is winning the race on price and losing it on the clock. The cheap clean machine has arrived; whether it arrives in time is a different question, and the number to watch is not how clean the grid looks but whether the world’s carbon emissions finally start to fall.