Question 08 · Population
Is the world running out of children?
The average woman now has about two children, half what her grandmother had, and in the richest countries far fewer. It is the quietest revolution of our age, and it is read two opposite ways: a liberation, and a reckoning.
you read
- This is a single number doing enormous work. The total fertility rate is the children a woman would have if she lived through one year’s birth rates at every age. It is not a headcount of any real generation, and it bounces with the timing of births, so a low year can overstate a lasting fall. Read the direction and the spread, not the third decimal.
- Everything past the present year is a projection, drawn dashed. The history is measured; the future is the UN’s medium variant, one path among many. Where the assumptions are pushed to their plausible edges, the world of 2100 swings by more than seven billion people — a fork this article gives its own chart.
- Replacement fertility is about 2.1 children per woman in a rich, low-mortality country, and somewhat higher where more children die young. We use 2.1 as the reference line throughout; it is a useful marker, not a magic threshold.
- Most series are real and individually sourced: fertility, births, deaths, growth, median age, and the projection variants from the UN World Population Prospects 2024 (taken directly, CC BY 3.0 IGO, and via Our World in Data), the regional and dependency cuts and the drivers from the World Bank. Where the best evidence is a survey or a paper we cannot re-host — the desire gap, the rival projection, the academic debate — it is cited and linked, never invented, and tagged as such.
- The verdict at the top, and the three reads under every chart, are an editorial synthesis. For this question we deliberately refuse a single answer: the same fall is genuinely a gift and genuinely a problem, and which one you see depends on where you stand.
evidence
Whatever window you pick, the line points down. The average woman in 1950 had nearly five children; the woman of the early 1960s, just over five, as fewer babies died and families had not yet thought to shrink; the woman of 2023, about 2.25, a whisker above the 2.1 it takes to replace a generation. Most of that fall is the best news of the last century, fewer children dying and more women choosing. The worry is only in the last stretch of the line, and in the places it has already passed through the floor.
Four signals, and they do not agree on a mood. Fewer children die than ever, which is pure relief and the root cause of all the rest. But the babies born each year peaked back in 2012, the median person has aged a full decade since 1970, and one in ten humans is now over 65, the most ever. The same root, child survival and women’s choice, feeds a hopeful chart and three uneasy ones. That is the whole question in one panel.
3 of 4 signals point to deterioration · 1 toward progress
Stand with a woman who now finishes school, works, and has the two children she wants instead of the six her grandmother bore and half-buried, and this is liberation. Stand with a pension system that needs four workers per retiree and is sliding toward two, and it is a slow emergency. Same number, opposite verdicts.
the lived now
Stand with a woman who now finishes school, works, and has the two children she wants instead of the six her grandmother bore and half-buried, and this is liberation. Stand with a pension system that needs four workers per retiree and is sliding toward two, and it is a slow emergency. Same number, opposite verdicts.
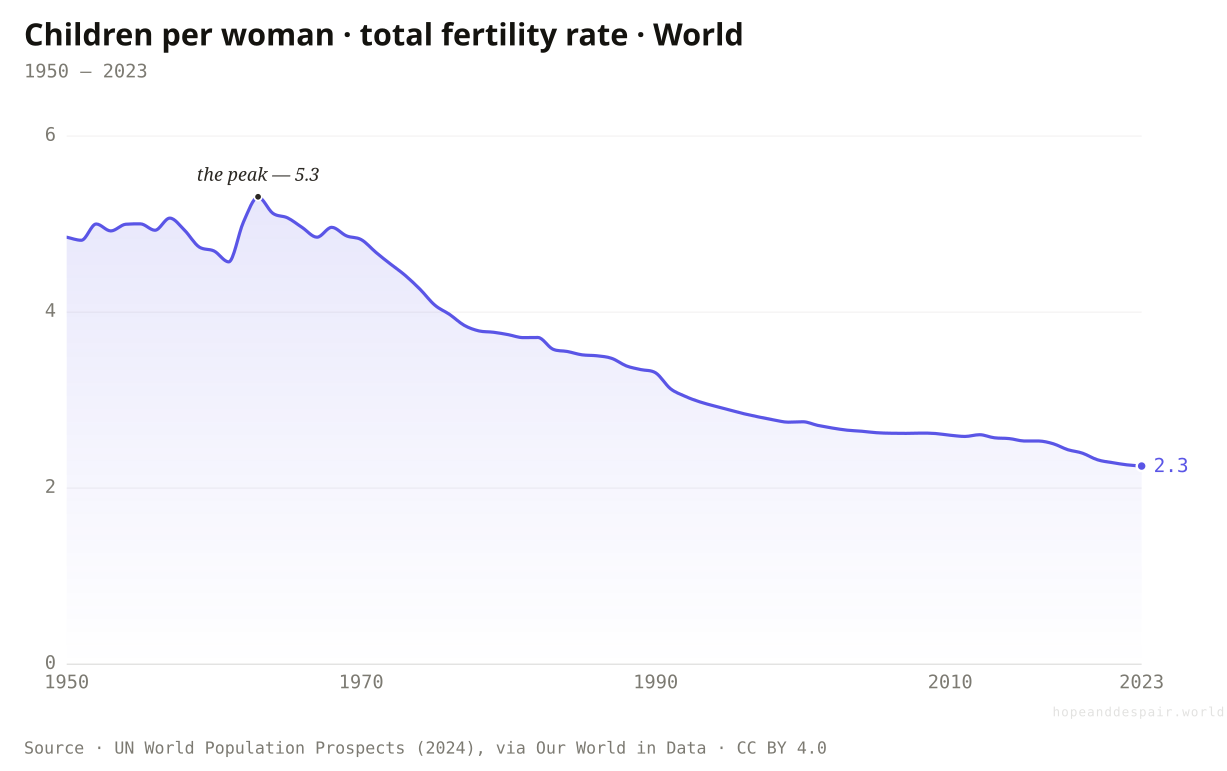
Has the world’s fertility really fallen — and how far?
The average woman had about five children in the early 1960s and has about two today. The world rate sits at 2.25, a hair above the 2.1 it takes to replace a generation.
Start with one woman and her granddaughter. The woman of the early 1960s bore, on average, 5.31 children; her granddaughter today has about 2.25. That is the total fertility rate, and it has more than halved within three generations of the same family. The world figure climbed a little first, to its 1963 peak, because children had begun to survive before parents had begun to plan, and then it fell without a serious pause for sixty years.
This is the demographic transition, the single most reliable pattern in population science, first named by Frank Notestein in the 1940s. It runs in the same order almost everywhere: first the death rate drops, so families that once buried half their children stop needing to bear so many, and a generation or two later the birth rate follows it down. Britain and France walked this path across the whole nineteenth century. Iran walked it in two decades. The shape is universal; only the speed changes.
The single clean line hides the only thing that matters next. A world average of 2.25 can mean a planet of identical middling families, or it can mean Seoul and Niamey averaged into a number that describes neither. It is the second. Before the worry or the relief, the honest move is to break this line apart, which is the rest of this page.
How this number was made
What it measures. The total fertility rate: the average number of children a woman would have if she experienced the year's age-specific birth rates throughout her childbearing years.
Calculation. Selected entity World.
The displayed line is monotone-cubic smoothed for legibility only — it never moves a data point.
Almost the entire fall is good news arriving: children surviving, and women with the schooling, the contraception, and the freedom to choose a smaller family than their mothers had.
The line has not levelled at replacement; it has sailed through it, and in much of the world it is still dropping with no floor in sight.
Whether 2.25 is a resting point or a waystation on the road to the ones and the zeroes below depends on places that have not finished falling.
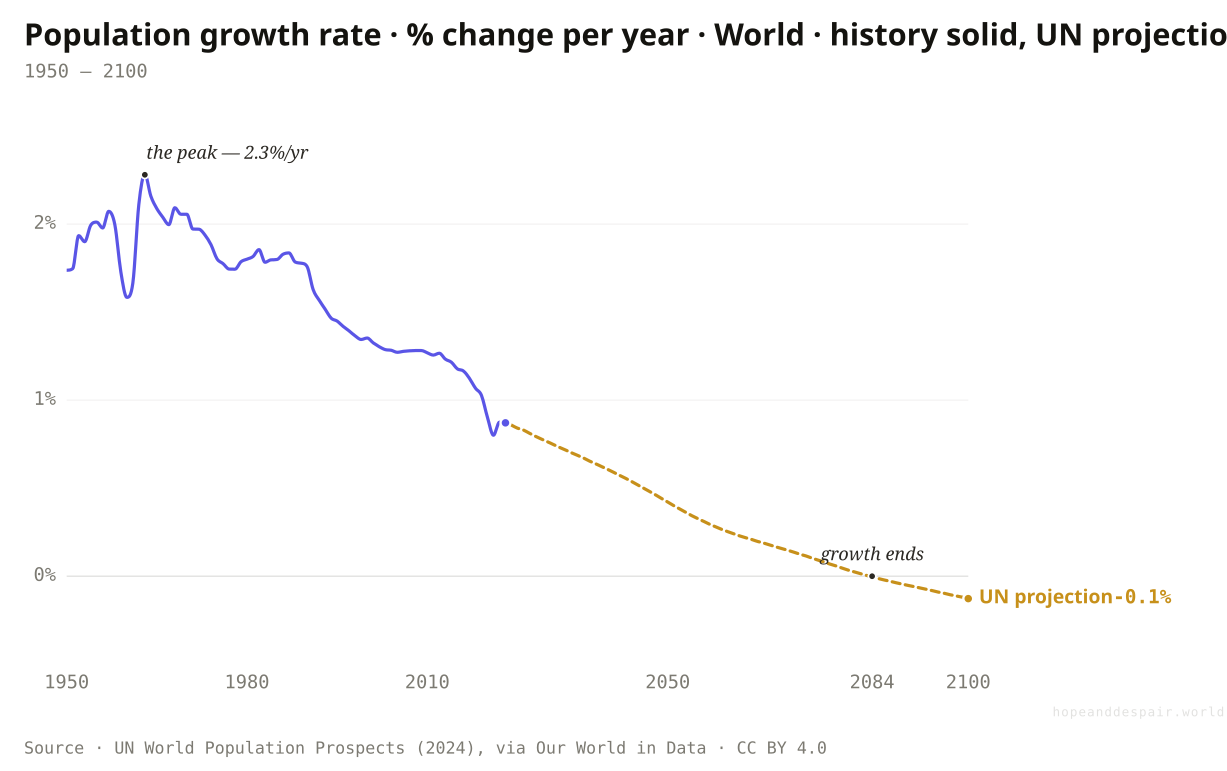
Weren’t we recently terrified of the opposite problem?
We were. The population bomb was real, and it was defused without catastrophe. World population growth peaked at 2.3% a year in 1963 and is now under 1%, on course to reach zero around 2084.
In 1968 a famous book opened by declaring the battle to feed humanity already lost, with hundreds of millions to starve in the 1970s. The fear was not stupid. In 1963 the human population was growing by 2.3% every year, fast enough to double in a single generation, and the food supply looked finite. The mass starvation did not come; better seeds and fertiliser bought time, and then the thing nobody had ordered happened on its own. Families chose to get smaller.
The growth rate has fallen by more than half since that peak, to about 0.9% a year, and the dashed line shows where the UN expects it to go: down through the floor, reaching zero around 2084 and turning slightly negative by 2100. The number that once frightened the world is now headed below the line where the population stops growing at all. Almost no one alive in 1968 expected to see it.
Here is the trick the growth rate plays. A rate can fall for sixty years while the thing it measures keeps rising, because a smaller percentage of a much bigger number is still an enormous number of people. The bomb was defused. The population it set ticking is still climbing, and will keep climbing for most of this century, which is the knot the last chart on this page has to untie.
How this number was made
What it measures. The annual rate at which the population is growing, expressed as a percentage.
Calculation. Selected entity World.
The displayed line is monotone-cubic smoothed for legibility only — it never moves a data point.
This is one of the great averted disasters of the century: the fear of a starving, overrun planet dissolved, not through coercion or famine, but because freer, richer, healthier people wanted fewer children.
The same line, followed far enough, is a world that shrinks every year, with all the strain on workforces and pensions that a falling number brings.
Exactly when growth ends, and whether it stabilises or keeps sliding, hangs on fertility choices that have already broken every past forecast.
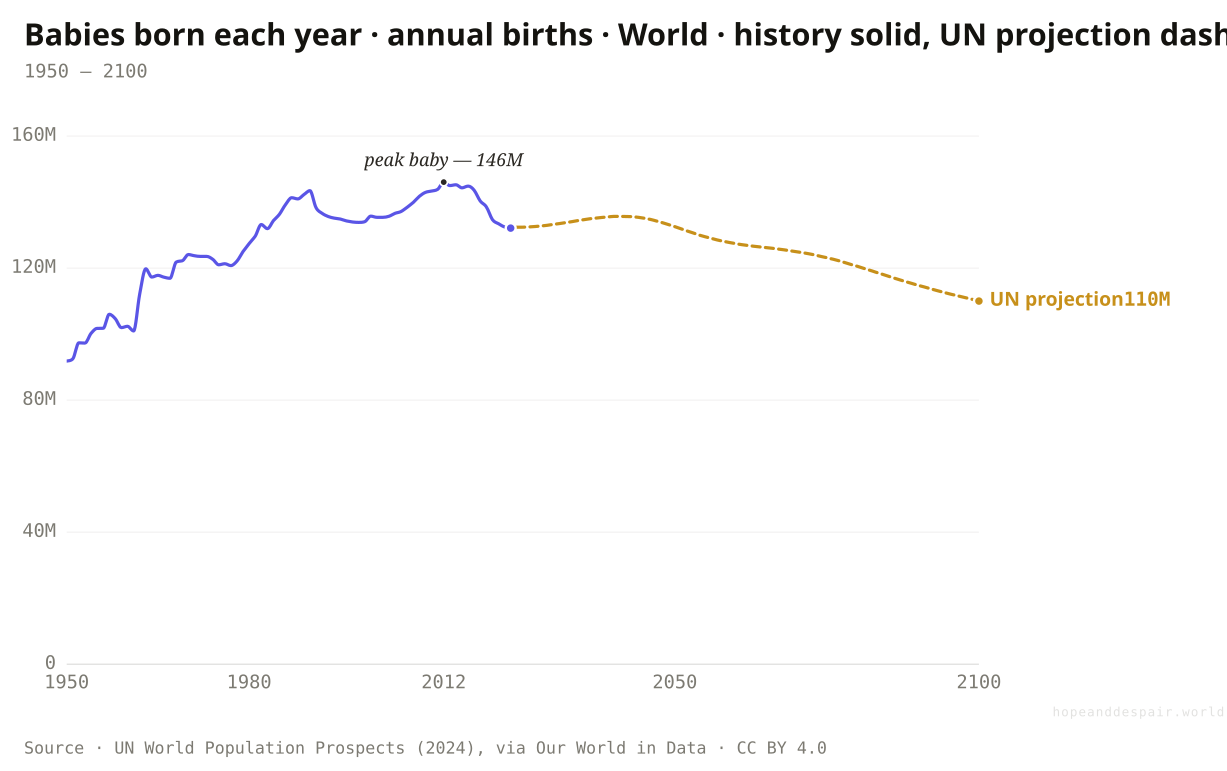
Are fewer babies actually being born?
Yes, in absolute numbers now, not just per woman. The number of babies born each year peaked around 2012 at about 146 million and has been drifting down since. Peak baby has passed.
For most of history the count of babies climbed simply because the count of people did. More potential mothers meant more births, even as each mother had fewer children. Around 2012 those two trends finally crossed. The world recorded about 146 million births that year, the most it ever has, and the number has slipped a little every year since, to roughly 132 million now. The moment has a nickname among demographers: peak baby.
Fourteen million fewer babies a year is not a rounding error; it is roughly a tenth of all the babies the world makes, gone from the annual tally in a decade. And the dashed projection does not recover it. The UN expects annual births to wobble near today’s level for a couple of decades, then fall away toward 110 million by 2100, as the smaller generations being born now grow up to become a smaller pool of parents. The future is being narrowed at the base.
This is the hinge between the per-woman story and the headcount story. Fertility per woman fell first, quietly, for decades; only now is it pulling the raw number of human arrivals down with it. Everything that follows, the aging, the shrinking workforce, the eventual peak in total population, is the long echo of this one curve turning over.
How this number was made
What it measures. The number of live births in a calendar year.
Calculation. Selected entity World.
The displayed line is monotone-cubic smoothed for legibility only — it never moves a data point.
Fewer births, freely chosen, mean more able to be invested in each child: more schooling, more care, more of a parent’s attention and a society’s resources per young life.
A permanently narrowing base means every future generation is smaller than the last, and the arithmetic of that, compounded, is severe.
Whether births level off near here or keep sliding is the single assumption that swings every long-range population forecast.
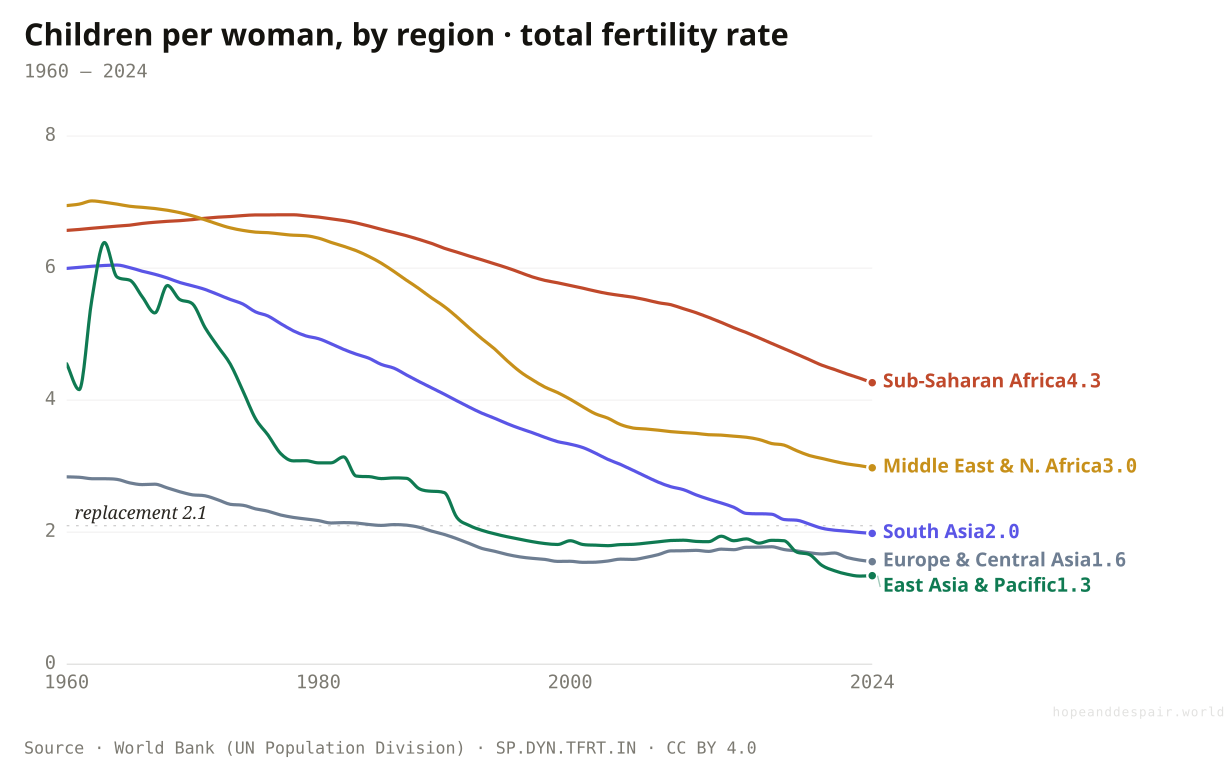
Is the fall happening everywhere at once?
No. Sub-Saharan Africa still averages 4.3 children per woman while East Asia is down to 1.3. The world’s 2.25 is a midpoint almost no region actually sits at.
Run the same line for each part of the world and it splays into a fan. In 1960 nearly every region clustered high, between five and seven children per woman, with only Europe already low. Six decades later they have pulled wildly apart. East Asia and the Pacific has fallen to about 1.3, Europe and Central Asia to 1.55, Latin America to 1.79, South Asia to 1.98, all at or below replacement. The Middle East and North Africa sit just above it at 2.98. Sub-Saharan Africa is still up at 4.26, where the rest of the world was two generations ago.
The gap is not a mystery; it is a stopwatch. The transition runs everywhere in the same direction, but it started at different times, so a region’s fertility today is mostly a record of when its girls began going to school and its children began reliably surviving. Sub-Saharan Africa is not refusing the path. It is simply earlier on it, and falling fast.
That is why the world’s tidy 2.25 is almost a fiction. It is the weighted average of a continent still growing quickly and a continent that has stopped, and it describes the lived reality of almost no one. The interesting questions are all at the ends of this fan, not in its middle.
How this number was made
What it measures. Fertility rate, total (births per woman)
Calculation. Selected entity SSF.
The displayed line is monotone-cubic smoothed for legibility only — it never moves a data point.
The whole world is on the same road, and the high-fertility regions are descending it faster than the early ones ever did: Africa is compressing into decades what Europe took a century to do.
The spread means the strains arrive unevenly and early for some: East Asia is aging into a workforce crisis while parts of Africa still strain to school and feed the young.
Whether Africa’s fall keeps accelerating, or stalls at a middling rate the way a few countries have, decides the population of the year 2100 more than any other single thing.
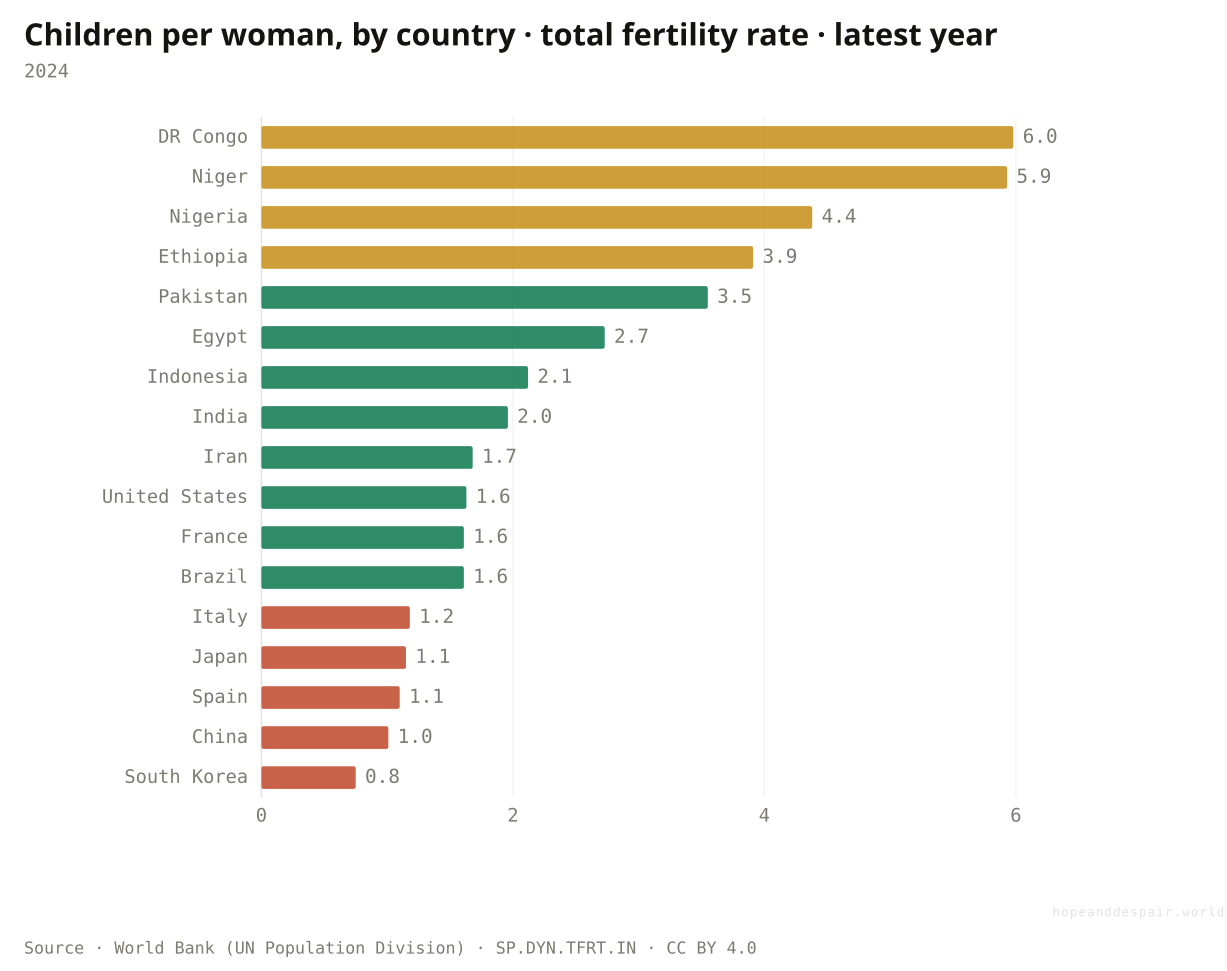
Where are the real extremes?
From about six children per woman in DR Congo and Niger down to 0.75 in South Korea — the lowest national rate ever recorded. The whole human range fits on one chart.
Line the countries up and the range is staggering. At the top, the Democratic Republic of Congo and Niger still average close to six children per woman, the level the whole planet sat at in 1963. At the bottom sits South Korea at 0.75, the lowest figure any nation has ever recorded in peacetime, less than a third of what it takes to keep a population steady. One species, one chart, an eightfold gap from end to end.
The middle is where the surprises hide. India, long shorthand for overpopulation, has quietly dropped to 1.96, below replacement. The United States sits at 1.63, Brazil at 1.61, both well under the line. Italy and Japan are down near 1.15. China, the country that spent a generation forcing births down by law, is now at 1.01 and cannot persuade them back up. The anxiety of the twentieth century and the anxiety of the twenty-first are stacked on the same axis.
What the bar cannot show is which way each country is travelling, only where it has arrived. For that you have to watch a few of them fall over time, which is the next chart. But the spread alone makes one thing plain: there is no single human fertility story. There is a fast, young one and a stalled, graying one, and most of the famous countries are quietly in the second.
How this number was made
What it measures. Total fertility rate (births per woman), latest year per country. Replacement level is about 2.1. A curated 17-country spread sorted descending.
Calculation. Latest value per country, 17 curated countries sorted descending.
The countries at the bottom got there mostly through prosperity, education, and women’s choice, the same forces that lifted billions out of poverty in the same decades.
A rate of 0.75 is not low fertility; it is a society that, left unchanged, more than halves with each generation, and nobody has shown how to reverse it.
Whether the very bottom of this chart is a floor others will stop short of, or a preview of where the rest are heading, is genuinely unknown.
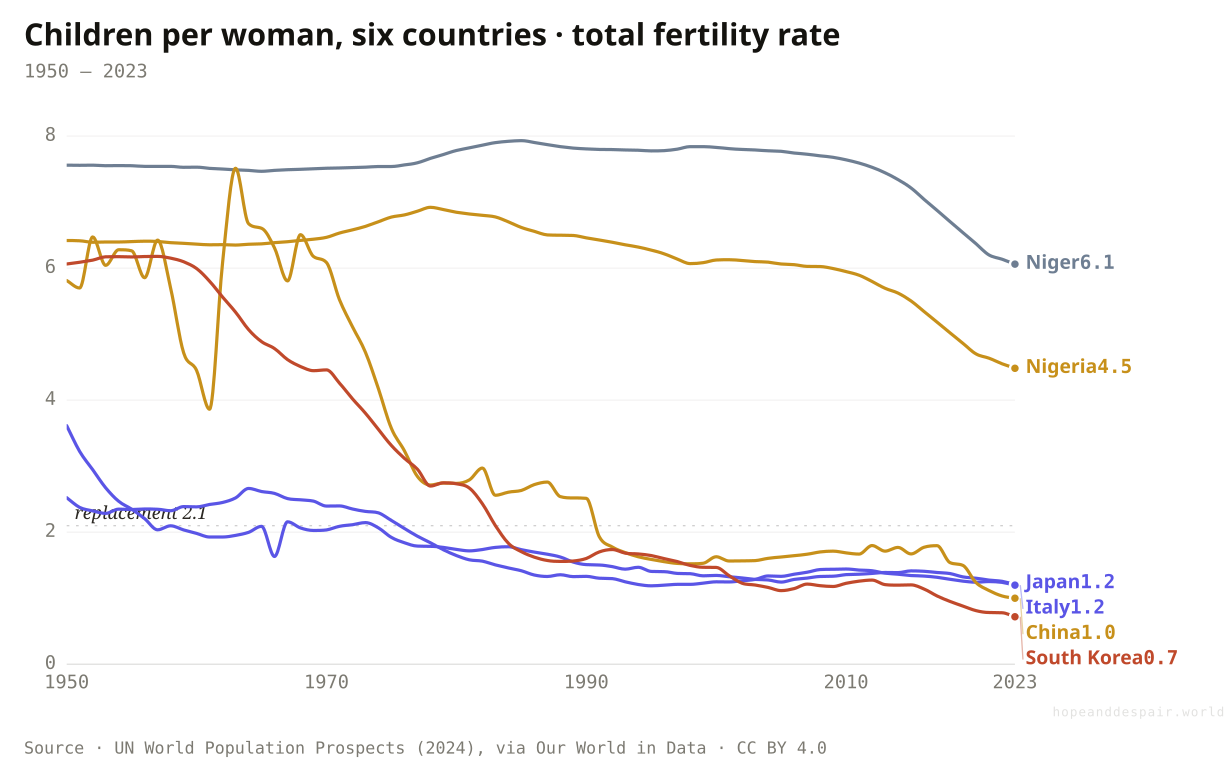
What does the bottom of the range actually look like over time?
A collapse, not a dip. South Korea fell from six children per woman to 0.7 in a single lifetime; China has dropped below one. Against them, Niger has barely moved.
Follow a handful of countries down the decades and the word collapse stops being hyperbole. In the 1950s a South Korean woman had about six children; by 2023 she has 0.72, a fall of nearly nine-tenths inside one long human life. China bore more than seven children per woman at its 1963 peak, was driven down by the one-child policy, and has kept falling on its own to below a single child for the first time in its history. Japan and Italy, an Asian society and a European one, both slid under replacement in the 1970s and now rest near 1.2 — proof this is not an Asian peculiarity but a rich-world destination.
Against that low cluster, the African lines tilt slowly. Niger averaged about 7.6 children per woman in 1950 and still averages 6.1 today; Nigeria has come down from over six to about 4.5. The descent that swept East Asia and Europe has begun there too, but it has decades left to run. On the same chart, in the same years, four of these countries face too few young people and two face too many. The transition is the same everywhere; the clock it runs on is not.
The lowest lines carry the warning the world averages soften. These are not gentle settlings toward replacement. They are overshoots, falling past 2.1 and continuing to a half or a third of it, in rich, peaceful, well-governed countries that have tried cash, leave, and exhortation to slow the fall and watched it continue. Whatever pulls fertility down does not let go at the bottom.
How this number was made
What it measures. The total fertility rate: the average number of children a woman would have if she experienced the year's age-specific birth rates throughout her childbearing years.
Calculation. Selected entity Niger.
The displayed line is monotone-cubic smoothed for legibility only — it never moves a data point.
Every one of these falls began with something good: Korean and Chinese women moved in a generation from farm labour and early marriage to universities and cities and careers.
South Korea and China show that below-replacement fertility is not self-correcting; it deepens, and a half-dozen national governments have failed to lift it back.
No one knows why the East Asian bottom is so much lower than Europe’s, nor whether it is culturally specific or simply further down a road everyone is on.
Why did people stop having so many children?
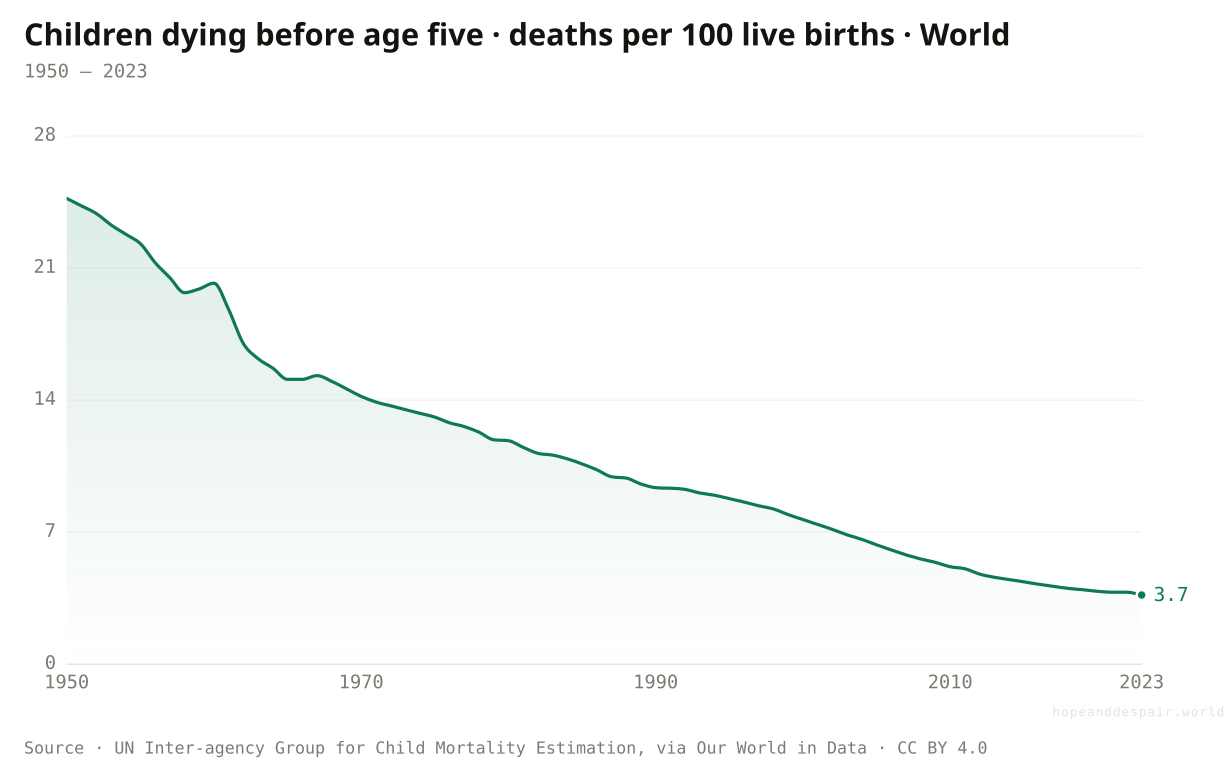
Mostly because their children stopped dying. A century ago a quarter of children died before five; now fewer than one in twenty-five do. When survival became reliable, families became small.
The deepest cause of the whole story is the happiest chart in it. In 1950 about 24.7 of every 100 children born died before their fifth birthday, almost one in four. By 2023 that figure is 3.67, fewer than one in twenty-five. This is among the greatest achievements in human history, and it is also, quietly, the engine of the fertility fall, because for all of history people bore many children partly because they expected to bury some.
When that grim expectation lifted, fertility followed it down, with a delay of a generation or so while families learned to trust the new survival. The economist Gary Becker put the logic plainly: as children became more likely to live and more expensive to raise and school, parents shifted from quantity to quality, investing more in fewer. A mother confident her two children will live does not need to bear six as insurance.
This is why the framing matters so much. The fertility fall is not, in the main, a sickness or a failure of nerve. It is the downstream signal of children surviving and parents investing, the two things almost everyone agrees we wanted. The discomfort of this whole article is that those unambiguous goods produced a genuinely hard problem, and you cannot wish the problem away without wishing away its causes.
How this number was made
What it measures. The long-run estimated share of newborns who die before reaching the age of five.
Calculation. Selected entity World.
The displayed line is monotone-cubic smoothed for legibility only — it never moves a data point.
This is the chart the whole question rests on: the near-elimination of child death, the clearest unambiguous good in modern history, freely chosen smaller families its direct result.
The very success that ended the dying set in motion the aging and shrinking that now worry every treasury, with no way to keep the first and refuse the second.
How much of the fertility fall is survival versus education versus economics is still genuinely debated, which means no one is sure which levers, if any, could move it.
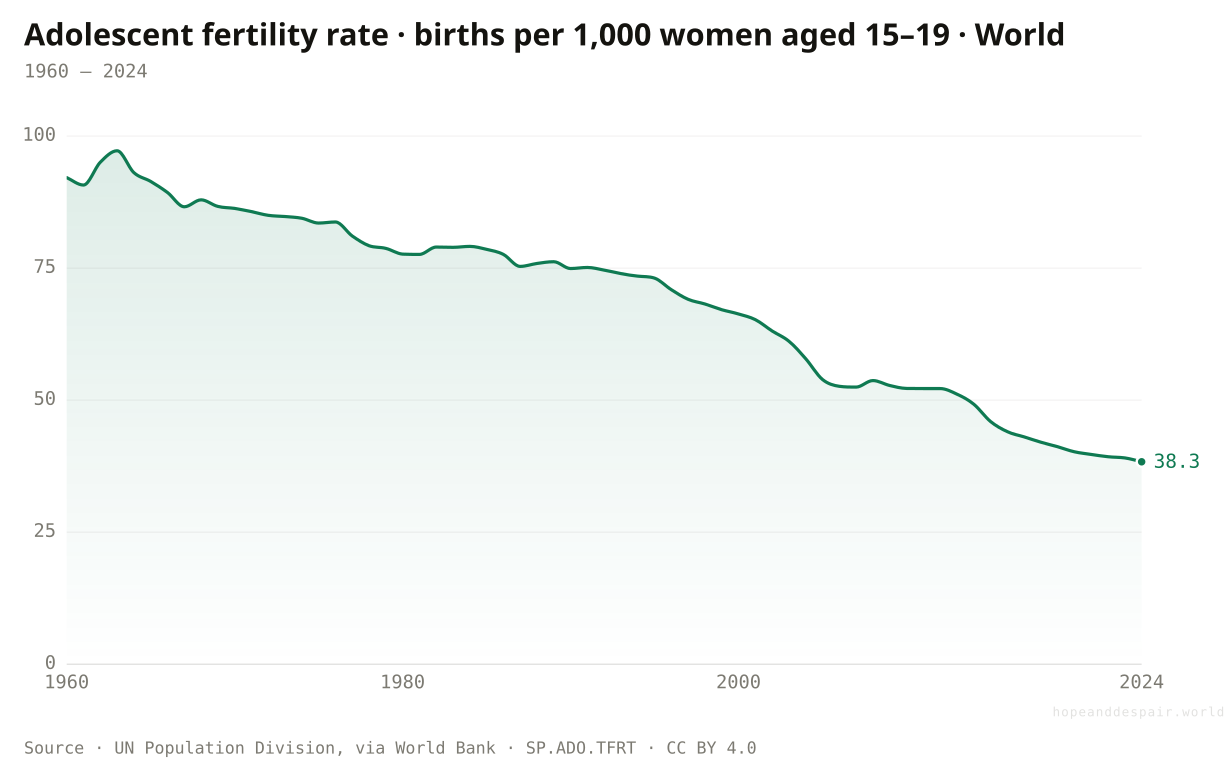
What changed for the girls who became these women?
They stayed in school and stopped becoming mothers as teenagers. Girls’ secondary enrolment nearly doubled since 1970, and the birth rate among teenagers has more than halved.
Behind the fertility line is a quieter one about whose lives changed. In 1970 only about 40 of every 100 girls of secondary-school age were enrolled; by 2024 it is 77. A girl in a classroom at sixteen is not a mother at sixteen, and the adolescent birth rate shows it, falling from about 92 births per thousand teenage girls in 1960 to 38 today. Later first births, more schooling, more say over her own life: this is the texture under the abstraction.
The order of events matters, because it tells you what is cause and what is effect. Across countries, girls’ education rises first and fertility falls after, not the reverse. A woman who finishes school marries later, knows more about and has more access to contraception, has more earning power to lose by leaving work, and more standing to decide for herself how many children to have. None of those is a tragedy. Most are the explicit goals of half a century of development policy.
Which is the uncomfortable centre of this section. The clearest drivers of the fall are things we built on purpose and would build again: schools for girls, clinics, the slow extension of women’s choice. The smaller family is not what went wrong. It is, in large part, what went right, billed to a future that has to pay for it.
How this number was made
What it measures. Adolescent fertility rate (births per 1,000 women ages 15-19)
Calculation. Selected entity WLD.
The displayed line is monotone-cubic smoothed for legibility only — it never moves a data point.
Almost nobody, anywhere on the hope–despair spectrum, wishes the teenage birth rate were higher: this driver of the fertility fall is a pure gain in girls’ freedom and futures.
It is also irreversible by any decent means: no society that has educated its girls has found a way to raise its fertility that does not start by un-educating them, which none will do.
How much of the total fall this single channel explains, versus the economic forces in the next chart, is exactly the debate that makes fertility so hard to steer.
So is it just development? Then why won’t money buy it back?
Because the old rule broke. Fertility used to fall as women worked and countries grew rich — but among today’s richest countries, the most equal and family-friendly now have more children, not fewer.
For most of the twentieth century the rule looked simple: as women moved into paid work and countries grew rich, fertility fell. The global female labour-force participation rate, though, has barely moved in a generation, holding near half, even as fertility kept dropping, a first hint that the simple story is incomplete. Work is part of the picture, but it is not the lever it was taken to be.
Then, among the wealthiest countries, the rule reversed. In a finding now associated with the demographers Mikko Myrskylä and Hans-Peter Kohler, and developed by economists including Matthias Doepke and colleagues, the relationship at the top of the income scale flipped: the richest, most gender-equal societies, the Nordics, now tend to have higher fertility than the rich countries where men do little at home and mothers are forced to choose between a career and a child. Where the second shift is shared, women have more children, not fewer. South Korea, where the burden falls hardest on mothers, sits at the bottom of the whole world.
That reversal is why money alone fails. Hungary has poured the price of a small war into baby bonuses; South Korea has spent on the order of a couple of hundred billion dollars over two decades; both still sit far below replacement. What seems to move the needle, where anything does, is not cash but whether a woman can have a child without surrendering her work, her independence, or her share of the housework. That is slow, structural, and cultural, and no government has bought it quickly.
How this number was made
What it measures. Labor force participation rate, female (% of female population ages 15+) (modeled ILO estimate)
Calculation. Selected entity WLD.
The displayed line is monotone-cubic smoothed for legibility only — it never moves a data point.
If the rich-world reversal holds, it points to a humane exit: not coercing births, but making children compatible with women’s working lives — shared parenting, real childcare, secure housing.
If it is a mirage or a local quirk, then nothing decent reliably lifts fertility once it falls, and the lowest countries are simply the future arriving early.
Whether gender equality at home can genuinely reverse the decline, and at what level it settles, is perhaps the most important open question in demography.
What does a low-fertility world slowly turn into?
An old one. The share of people over 65 has doubled since 1960 to one in ten worldwide, and reaches nearly one in five across Europe. The young base narrows; the top grows heavy.
Fewer children does not only mean fewer children. Run the arithmetic forward and it means, inexorably, more old people as a share of everyone, because the small generations being born now sit beneath large generations living longer than any before them. In 1960 about one person in twenty was over 65. Today it is one in ten, and the line is steepening. The age pyramid that every society used to have, broad-based and tapering, is rolling over into a column.
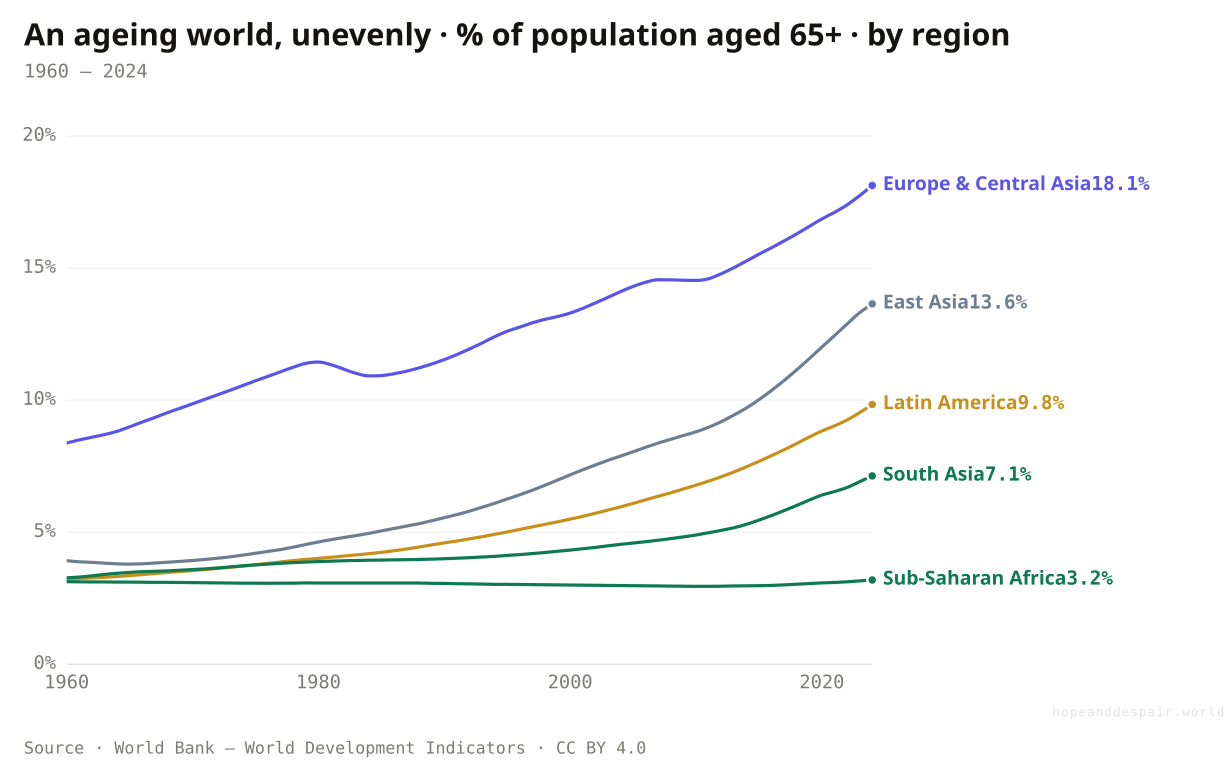
The global figure is gentle only because the young regions still weigh it down. Pull the regions apart and the future is already here in places. Across Europe and Central Asia, 18% of people are now over 65, nearly one in five. In East Asia, 14% and climbing fast, the legacy of those collapsing fertility lines a generation on. Sub-Saharan Africa, still young, sits near 3%. The same split that ran through the fertility fan runs through its consequence.
None of this is a forecast that might not happen. The people who will be old in 2050 are already born and already counted; barring catastrophe, the aging is locked in. A society can argue about how to pay for it, but not about whether it is coming. The children not born in 2012 are the workers missing in 2050, and that subtraction has already been made.
How this number was made
What it measures. Population ages 65 and above (% of total population)
Calculation. Selected entity WLD.
The displayed line is monotone-cubic smoothed for legibility only — it never moves a data point.
Europe is nearly one in five over 65; East Asia, near one in seven and rising fastest, is the echo of its collapsed fertility a generation back. Sub-Saharan Africa, still high-fertility, stays young. The world line is gentle only because the young regions outweigh the old ones — for now.
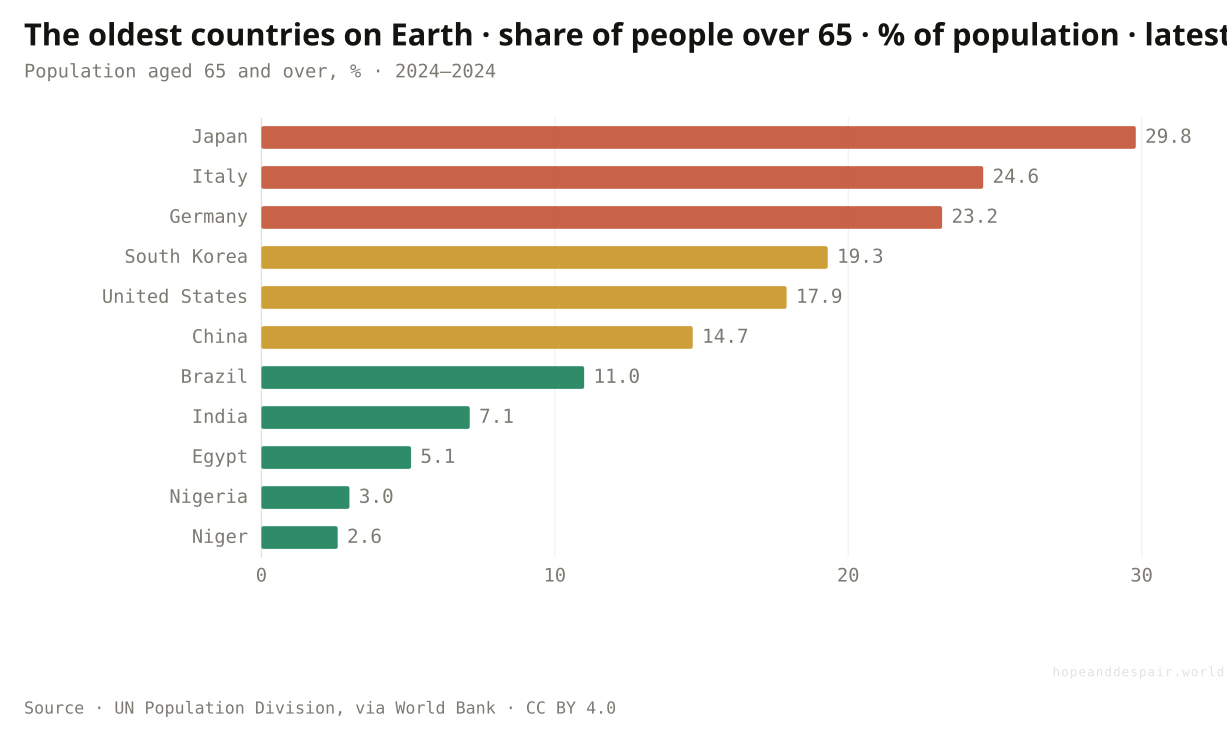
Japan and Italy are already more than a fifth elderly; South Korea and China climb the same curve fast, a generation behind. The young, high-fertility countries — Niger, Nigeria — sit at the far end, barely one person in twenty over 65. A society’s age is the fertility of its past, read forward.
An old society is also a long-lived one: the rising share over 65 is partly just the triumph that people now reliably reach old age, which almost no population before us did.
A column-shaped population strains every system built when the young vastly outnumbered the old, from pensions to elder care to the simple supply of working hands.
Whether longer working lives, automation, and migration can offset the shift, or only soften it, is the open economic question of the century.
How old is the typical person becoming?
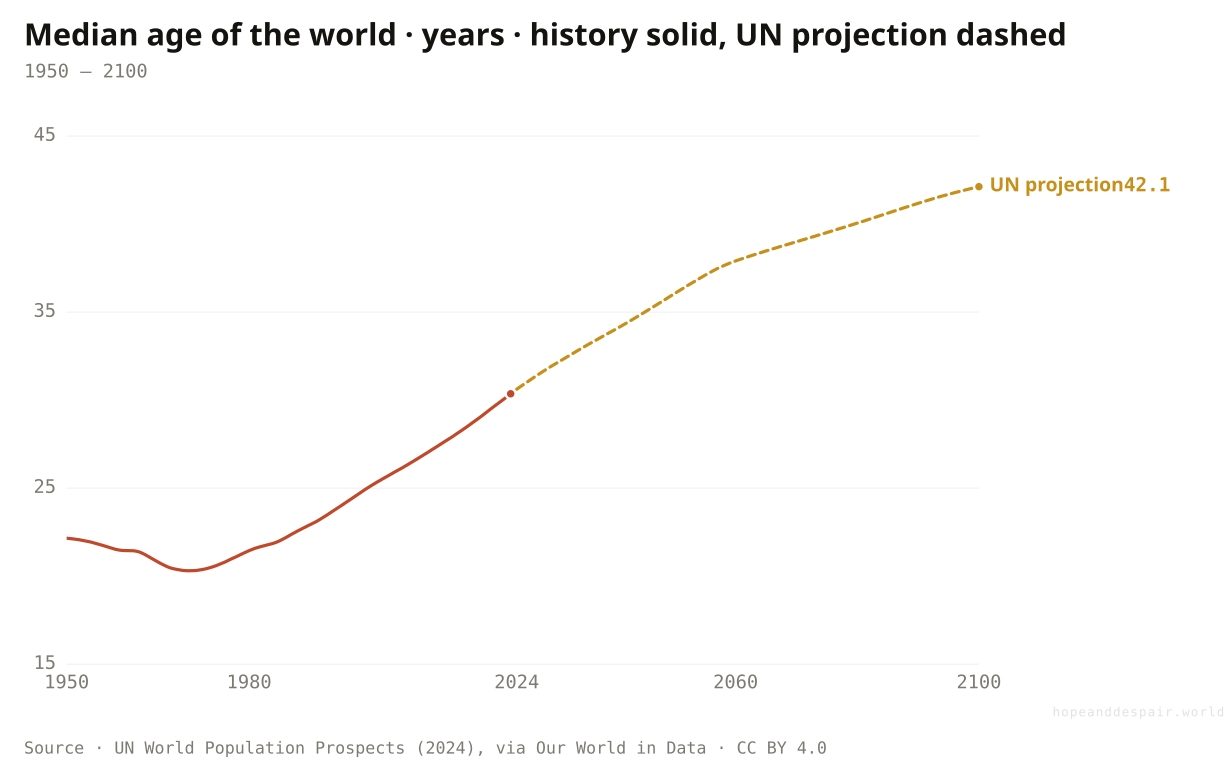
The median human was 20 in 1970 and is 30 now, heading for 42 by 2100. Humanity is aging faster than any individual ever could.
There is a number that captures the whole shift in one figure: the median age, the age at which exactly half the world is younger and half is older. In 1970 it was 20.3. Half of all the people alive were children or teenagers. By 2023 it had climbed to 30.4, and the dashed projection carries it on to about 42 by the end of the century. The middle of humanity has moved from adolescence to middle age inside a hundred years.
It is worth sitting with how strange that is. An individual ages a year every year, helplessly. A population does not have to; for most of history the median age barely moved, because each large young generation was replaced by a larger one. What we are watching is the median age rising almost as fast as the calendar, which can only happen when the young stop outnumbering the old, year after year, deliberately.
The figure is not evenly shared, and that is the rub. A median of 42 will be the rich world and East Asia; much of Africa will still be a continent of the young. The planet is not aging together. It is splitting into the gray and the green, and a great deal of this century’s migration, labour, and politics will be the friction along that seam.
How this number was made
What it measures. The age that divides the population into two halves of equal size — half are younger and half are older.
Calculation. Selected entity World.
The displayed line is monotone-cubic smoothed for legibility only — it never moves a data point.
A median age of 30 is also a world where most people survive childhood, reach adulthood, and can expect decades more, a profile no large society ever had before the last century.
Aging societies tend to grow more cautious, more weighed down by care costs, and slower to take the risks that growth and innovation need.
Whether an older world is a wiser, calmer one or a sclerotic, stagnant one is a question we are about to answer by living it.
Who is left to support the old?
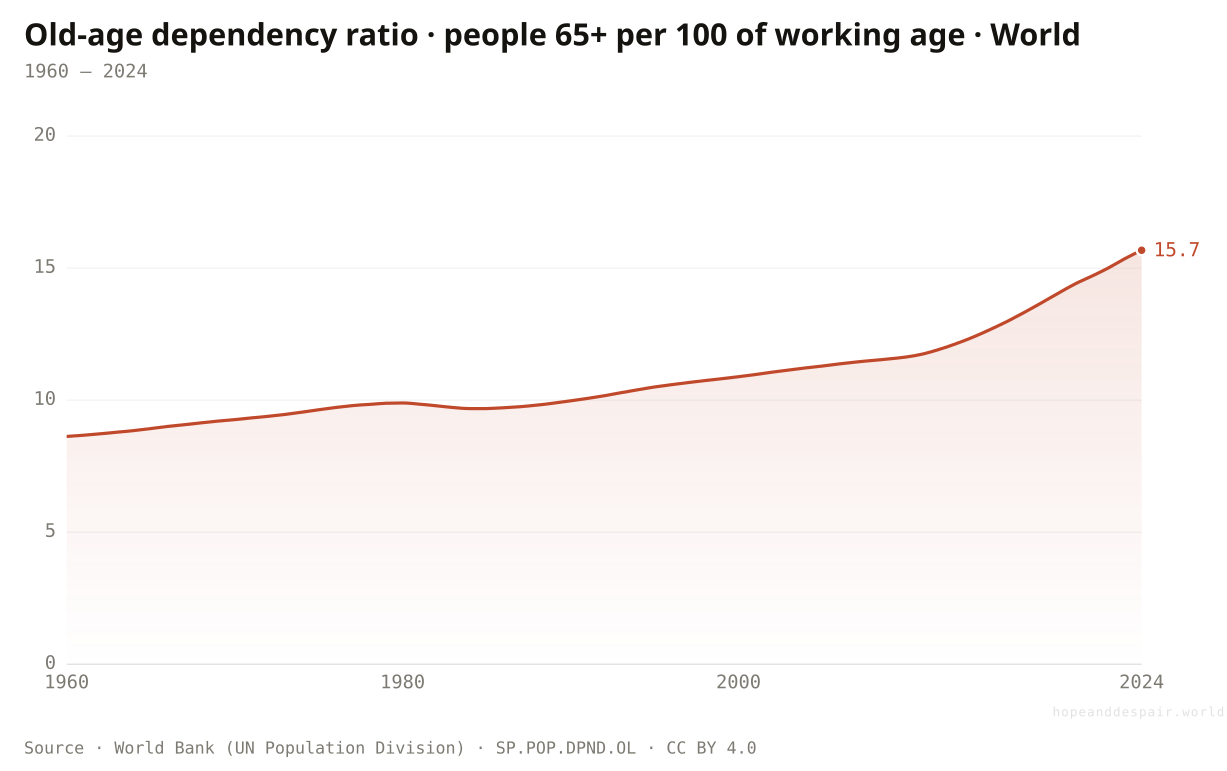
Fewer and fewer workers. There are now about 16 people over 65 for every 100 of working age, nearly double the 1960 figure, and the ratio climbs steeply from here.
The aging finally bites through one ratio: how many elders each working-age adult has to carry. In 1960 there were about nine people over 65 for every hundred adults of working age. Today there are nearly sixteen. The figure has almost doubled, and because the large generations of the late twentieth century are only now reaching retirement, the steep part of the climb is still ahead.
This is where demography turns into a budget. Pensions, in most countries, are paid by today’s workers to today’s retirees, a chain that holds only while the workers comfortably outnumber the pensioners. As the ratio tightens, the same promises require higher taxes, later retirement, or thinner benefits, in some combination no electorate enjoys choosing between. The arithmetic is not ideological; it falls due the same way under every flag.
And this is the global figure, softened by the young countries again. In the places furthest down the fertility road the squeeze is far sharper: parts of East Asia and Europe are heading toward two workers per retiree, or fewer. The children chosen against, quietly, one family at a time over the past forty years, arrive on the public ledger now, as a bill no policy can send back.
How this number was made
What it measures. Age dependency ratio, old (% of working-age population)
Calculation. Selected entity WLD.
The displayed line is monotone-cubic smoothed for legibility only — it never moves a data point.
Healthier, longer-lived people can work later than their parents did, and a smaller young generation costs less to raise and school, freeing resources to offset some of the elder bill.
The pension and care systems of the rich world were built for ratios that are vanishing, and every fix, later retirement, higher taxes, leaner benefits, is politically toxic.
Whether productivity and automation can grow fast enough to support more retirees on fewer workers is the bet every aging economy is now forced to place.
Can’t aging countries just import the young people they lack?
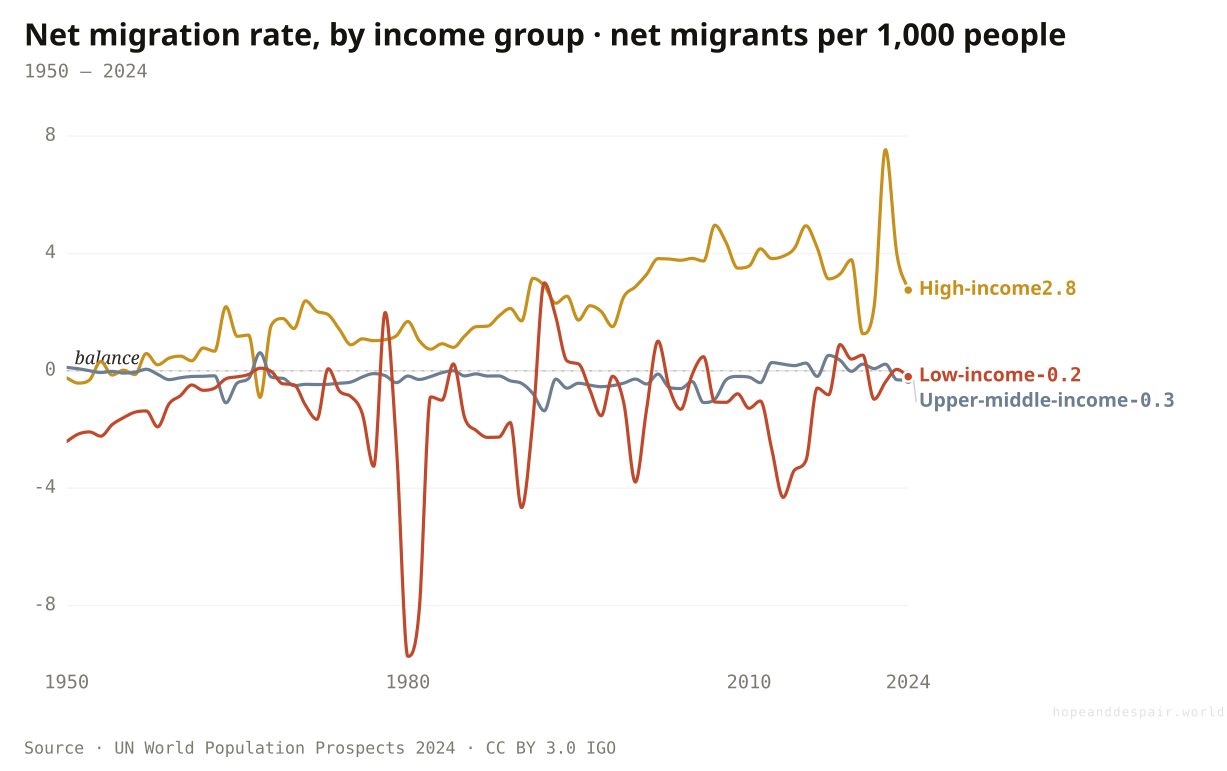
Some are, heavily. Rich countries have flipped from sending migrants to absorbing them, and now take in net newcomers fast enough to slow their decline. But globally it is a zero-sum fix.
There is one release valve, and the rich world is leaning on it hard. Sort the world by income and track net migration, and the high-income countries have swung from roughly balanced in 1950 to taking in, by 2024, nearly three net migrants a year for every thousand people, with a spike above seven around 2022. The middle and lower-income groups sit near zero or send people out. For aging, low-fertility societies, immigration is increasingly what keeps the working-age population from shrinking outright.
It works, up to a point, and that point is arithmetic. Migration can refill one country’s workforce, but it cannot add a single person to the planet; every migrant the rich world gains is one a poorer country loses, often one it educated. As a global answer to falling fertility it is zero-sum, a redistribution of the young rather than a creation of them. And it leans on a supply that the first half of this article quietly undermines: the regions that still send migrants are themselves aging, on a delay.
There is a harder limit, too, and it is not economic. The scale of migration that would fully offset rich-world fertility is far larger than what most of their electorates will accept, as the politics of the last decade has made unmistakable. Migration is a real and powerful cushion. It is not, and cannot be, the whole answer, and pretending otherwise has already deformed the politics of half the aging world.
How this number was made
What it measures. Net migration rate, High-income countries
Calculation. Selected entity High-income countries.
The displayed line is monotone-cubic smoothed for legibility only — it never moves a data point.
Migration genuinely cushions the shock, matching young workers who need jobs to old economies that need workers, and where it is managed well both sides gain.
It is zero-sum for the planet, drains the young from the countries that raised them, and runs into a political ceiling far below what the demographic arithmetic would require.
How much migration aging societies will actually accept, and how long the sending regions stay young enough to supply it, are unknowable and already explosive.
Is the choice always freely made — or are some children missing?
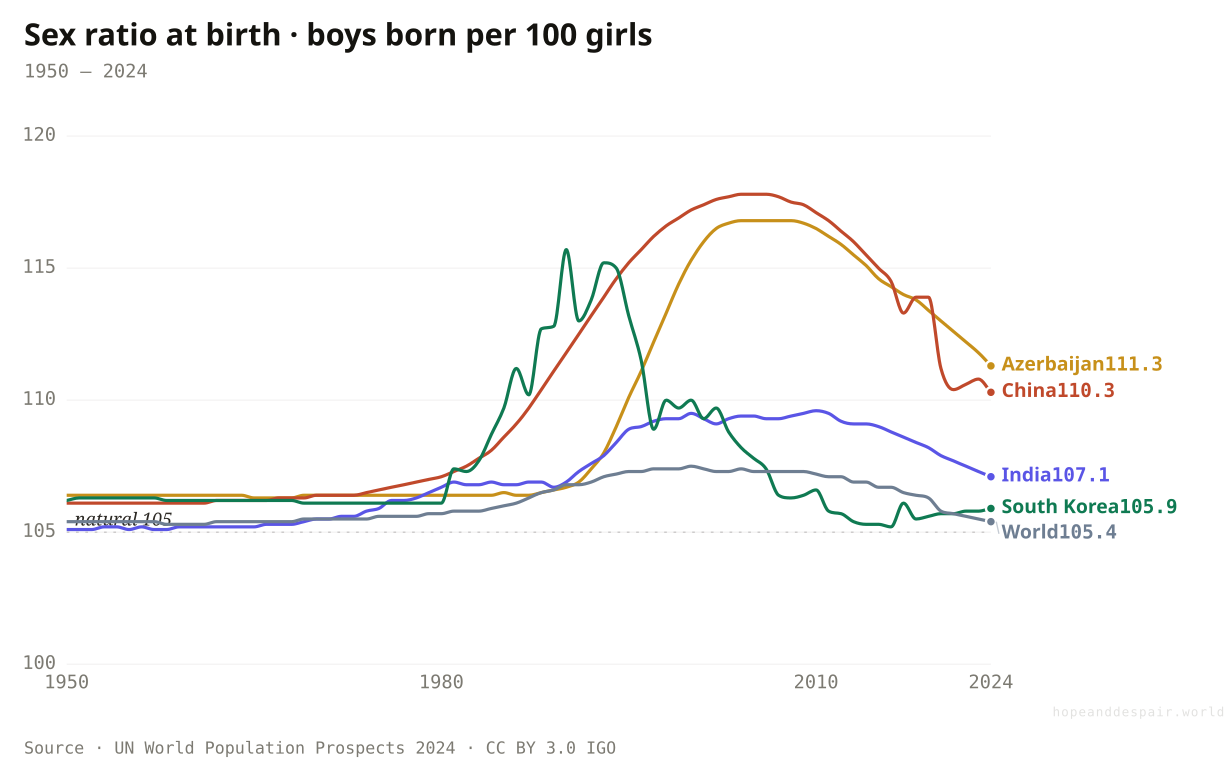
Not always. In parts of Asia, a preference for sons plus small families and ultrasound produced a generation of missing girls. China’s sex ratio at birth hit 118 boys per 100 girls in 2004.
Naturally, about 105 boys are born for every 100 girls, a near-constant of human biology. When that line lifts, it is not nature; it is choice of the darkest kind. In China the ratio climbed to about 118 boys per 100 girls by 2004, in India to nearly 110 around 2010, and across the Caucasus — Azerbaijan among the most extreme on Earth — to similar heights, as a strong preference for sons collided with shrinking family size and cheap ultrasound. If you can only have one or two children and you want a son, and you can know the sex before birth, the arithmetic ends in sex-selective abortion, and millions of girls were never born.
This is the shadow side of the small family, and it complicates the clean story of choice the rest of this page tells. The fertility fall is mostly women gaining freedom. But in these societies the same fall, crossed with son preference, took freedom from the daughters who were never allowed to exist, leaving a generation with tens of millions more young men than young women, with all the strain on marriage and stability that implies.
There is a thread of hope in the lines, and South Korea is its proof. Korea spiked toward 115 in the early 1990s and then came almost all the way back to the natural ratio, the one clear case of a society that distorted its births and then undistorted them as daughters gained value and worth. China and India have edged down from their peaks too, China toward 110, India toward 107, though neither is yet back to baseline, and Azerbaijan and its neighbours remain stubbornly high. The missing girls of the 1990s and 2000s are missing still, grown now, and the societies that selected against them are living with the gap.
How this number was made
What it measures. Sex ratio at birth, Azerbaijan
Calculation. Selected entity Azerbaijan.
The displayed line is monotone-cubic smoothed for legibility only — it never moves a data point.
Both peaks are past: as daughters gain value and the law catches up, the ratios are slowly returning toward nature, a sign the worst of son preference is receding.
Tens of millions of girls were never born, and the men who would have been their husbands are a lasting distortion, the dark proof that smaller families are not always freer ones.
How fast son preference fades as societies modernise, and whether it appears next wherever ultrasound meets small families, is uncertain and under-watched.
How sure can we be about any of this?
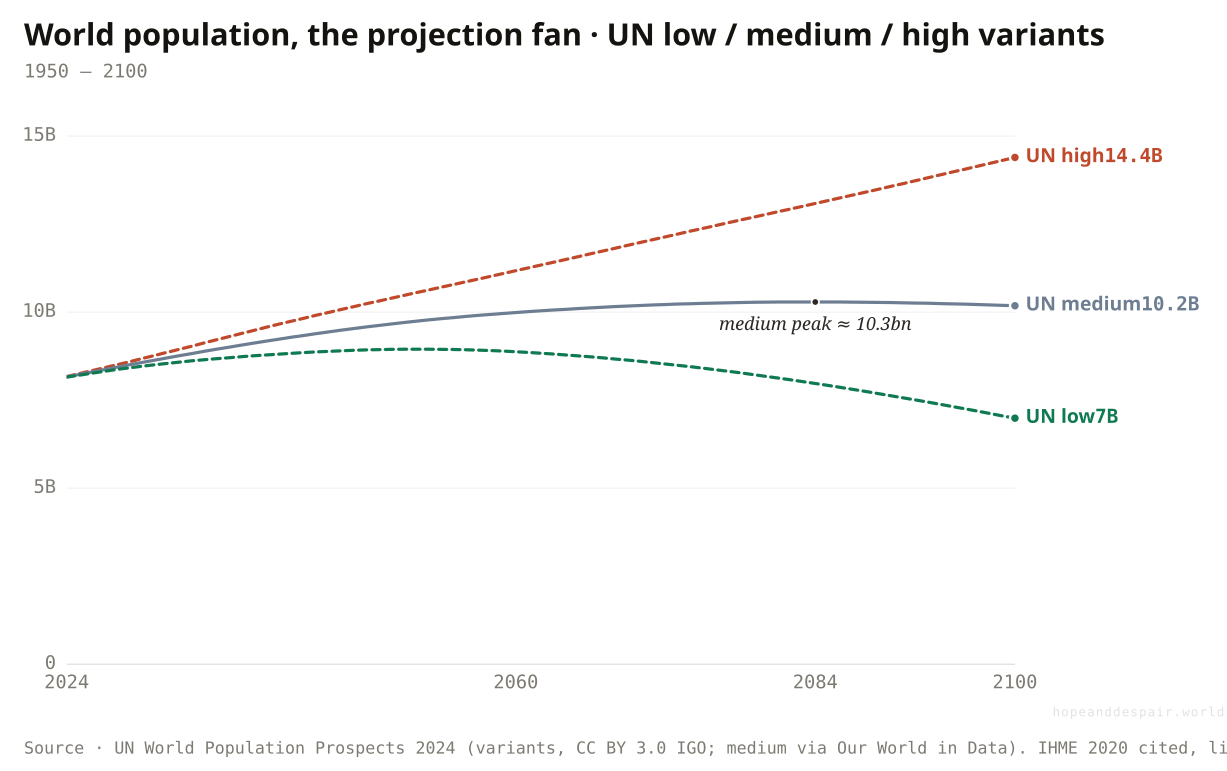
Not very. The same model that peaks population near 10.3 billion splits, on slightly different fertility, between 7 and 14 billion by 2100. The future of humanity’s size is a genuine fork.
Every projected line on this page rests on a guess about how many children people not yet born will have, and small differences in that guess compound into enormous ones. The UN publishes the fork honestly. Its medium path peaks world population near 10.3 billion around 2084 and eases down. Its low path, with fertility about half a child lower, peaks sooner and falls below seven billion by 2100. Its high path, half a child higher, never peaks this century and reaches more than fourteen billion. Same model, same year, a spread of seven billion people, the difference between a crowded world and a hollowing one.
Independent modellers disagree even with the UN’s centre. A widely cited 2020 study from the University of Washington’s Institute for Health Metrics and Evaluation, published in the Lancet, has world population peaking earlier, around the 2060s, and falling more steeply, to roughly nine billion by 2100, on the view that fertility will drop faster than the UN assumes. Several economists argue it is falling faster still. Nobody who tells you the population of 2100 to the nearest billion is doing anything but choosing which assumption to trust.
This is the honest centre of the whole question, and it is why the confusion reading is first-class here, not a hedge. The measurement of where we are is rock-solid. The direction is clear. But the destination is not knowable, because it depends on billions of private decisions not yet made, by people not yet born, under conditions we cannot foresee. The future of human numbers is not a prediction. It is a fork, and we are standing at it.
How this number was made
What it measures. Population, World (UN High variant projection)
Calculation. Selected entity World.
The displayed line is monotone-cubic smoothed for legibility only — it never moves a data point.
The honesty is itself reassuring: demographers publish their uncertainty rather than hide it, and most of the fan is a world that has stabilised rather than one in crisis.
A spread this wide means we are steering a civilisational supertanker half-blind, committing pensions, cities, and economies on numbers that could be off by billions.
This is the purest confusion on the page: two careful teams, the same data, projections a billion or more apart, and no way to know who is right until we live it.
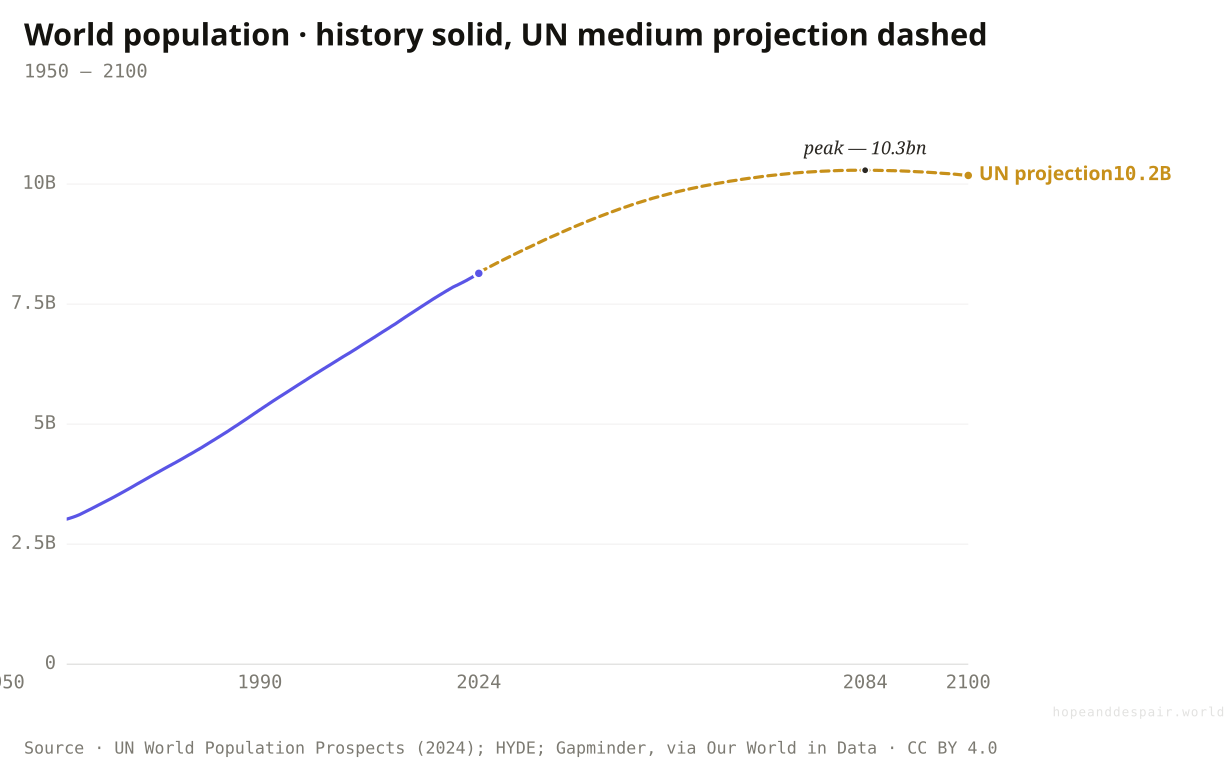
So — is the world running out of people, and would that be so bad?
Not soon. Population keeps growing to about 10.3 billion around 2084, then begins to fall as deaths overtake births. The deeper question is whether a shrinking humanity can still grow richer.
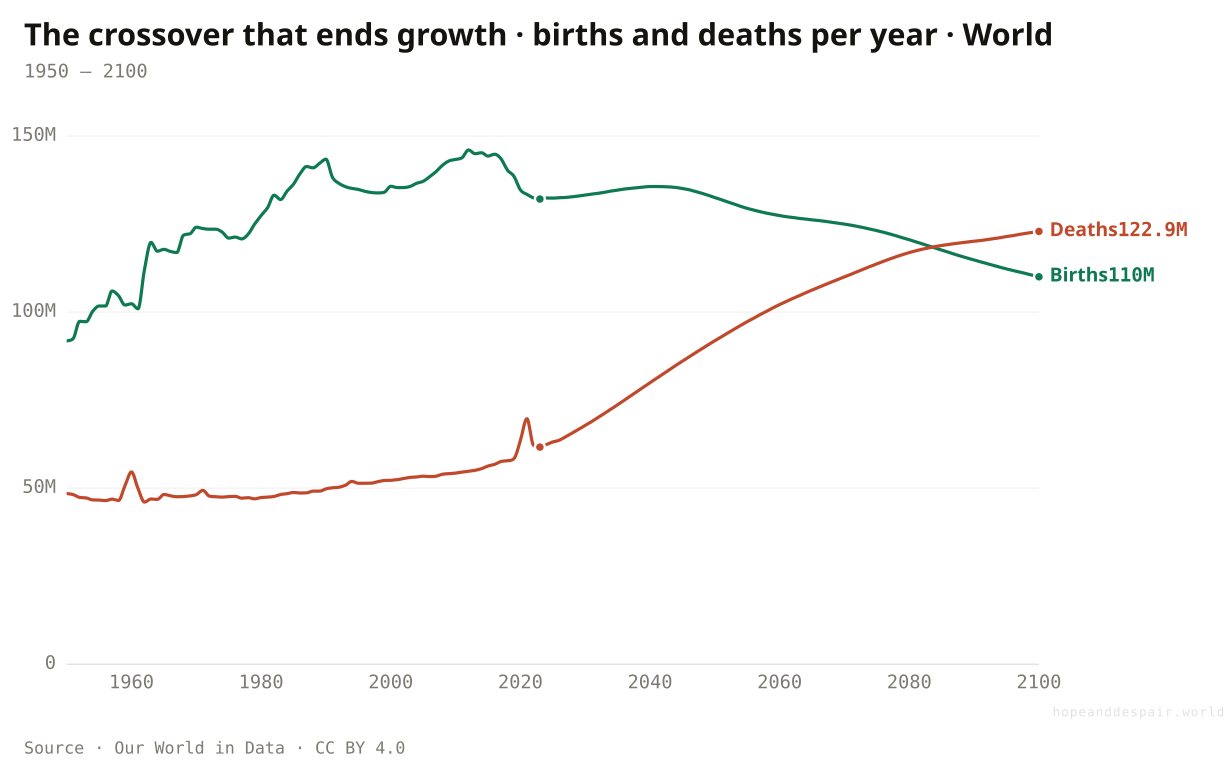
Put the medium path together and the blunt answer is no, not for sixty years, and then slowly. World population was 2.5 billion in 1950 and is about 8.2 billion now. The projection keeps climbing, on momentum, to a peak near 10.3 billion around 2084, and only then turns down. The mechanism of the peak is the quiet crossover beneath it: today the world records about 132 million births a year against 62 million deaths, so it grows, but the projection has those lines meeting around 2084, near 118 million each, after which deaths win every year and the population gently recedes.
The interesting fear is not emptiness; it is stagnation. The economist Charles Jones has made the unsettling argument that sustained economic growth may depend on a growing population, because ideas, the engine of progress, are found by people, and fewer people means fewer ideas. A world that peaks and declines, on this view, risks not catastrophe but a slow fading of the dynamism we have treated as permanent, an 'empty planet’ where living standards stop rising not because we run out of resources but because we run out of each other.
Which leaves the honest verdict, the one this whole page has been circling. The world is not running out of children in the sense of vanishing. It is running low on them, in a growing share of itself, in the sense that matters: too few to keep populations young, workforces full, and pension promises whole, and no society has yet found how to choose more once it has learned to choose few. That is not a catastrophe and it is not a triumph. It is the bill for a victory, coming due in slow motion, and we genuinely do not know how it reads in the end.
How this number was made
What it measures. World population
The world grows while births outrun deaths, and stops when they meet — about 118 million each around 2084. Births peaked in 2012 and slope down; deaths climb as the large mid-century generations age. After the lines cross, more people die each year than are born, and population recedes.
Ten billion people fed, housed, and mostly out of poverty would be a civilisational triumph, and a gently shrinking population thereafter eases the pressure on land, climate, and every finite thing.
A peak is also a turn, and a permanently shrinking, aging population may slowly lose the dynamism and growth that modern life quietly assumes will always be there.
Whether fewer people means a calmer, greener world or a stagnant, fading one is the deepest open question here, and it turns on things no demographer can measure.
Children stopped dying, and women got to choose, and so families got smaller. Everything else on this page — the aging, the shrinking, the missing girls, the bill — is the long shadow of those two good things, and we cannot keep them while refusing it.— The whole argument, in one line
One question, read by the fields that actually study it. Each voice is given both its most hopeful and its darkest honest reading — with a note on how settled the evidence underneath is.
the hopeful readThis is the demographic transition completing on schedule, the arc Notestein described eighty years ago: death rates fall, birth rates follow, population stabilises. The textbook is working.
the darker readExcept the East Asian tail was not in the textbook. Fertility was meant to settle near replacement, not plunge to a third of it and keep going, and the low-fertility-trap researchers warn that below a point it may become self-reinforcing.
the hopeful readAnd yet the two I have will grow up healthier, better schooled, and more attended-to than I could have managed with five. The choice I resent is also one my grandmother never had.
the darker readThe surveys say I want more children than I will have, and they are right. It is not that I chose a small family; housing, hours, and childcare chose it for me. Call it freedom if you like.
the hopeful readLater retirement, higher productivity, and migration can each take a slice from the gap. None closes it alone, but the problem is arithmetic, not mystery, and arithmetic can be managed if we are honest early.
the darker readMy models only balance on assumptions already false. The ratio of workers to retirees is collapsing on a schedule fixed by births that already happened; no rebound in fertility could change the next thirty years even if it came tomorrow.
the hopeful readOr a smaller, richer, better-educated humanity, amplified by machines, keeps finding ideas with fewer heads. We have never run this experiment, so the pessimism is a hypothesis, not a forecast.
the darker readIf Jones is right that ideas need people, a shrinking population could quietly end the economic growth we treat as a law of nature, not with a bang but with a long, grey flattening.
the hopeful readBut the same fall is coming for us, faster than it came for anyone before, if we can get girls through school and children through their fifth year. A youthful population is a dividend if it is educated and employed, and a danger if it is not.
the darker readThe world frets about too few children while my country has six per woman and not enough schools, clinics, or jobs for them. The crisis here is the old one, and the global panic about empty cradles can sound like a rich world’s luxury.
Strongest case for hope
The fertility fall is, at its root, the best news of the modern age wearing an alarming costume. It is what it looks like when children stop dying and women start choosing. A quarter of children died before five within living memory; now it is one in twenty-five, girls’ schooling has nearly doubled, and the smaller families that followed are the direct, intended consequence. The population bomb that terrified 1968 was defused without the famines or coercion that were predicted. We are headed for a peak near ten billion, most of them out of poverty, then a gentle easing of pressure on a strained planet. The aging that follows is the flip side of people reliably reaching old age, the thing every generation before us wanted and almost none achieved. And there is a humane exit beginning to show in the data: where men share the home and the state shares the cost, the richest, most equal societies are nudging their fertility back up. These are problems of success, and the tools to manage them are the same ones that caused them.
Strongest case for despair
A society with fewer than one child per woman is not balancing; it is liquidating, halving itself each generation, and South Korea, China, Japan, Italy, and a lengthening list have crossed into that territory with no example anywhere of climbing back out. The aging is already locked: the workers of 2050 are the children not born in 2012, and that subtraction can only be paid for, through higher taxes and later retirements and thinner pensions no electorate will choose. Migration buys time for the rich world only by draining the young from the poor one, and runs into a political wall far below what the arithmetic needs. Underneath the language of free choice sits the desire gap: people report wanting more children than they have, so some of this fall is not preference but a world too costly and rushed to raise the families it claims to want. The same shrinking, crossed with son preference, erased tens of millions of girls before birth. And if growth itself needs people, the quiet end of this story is not a green calm but a long, graying stagnation.
The single thing to watch is not the world fertility rate but whether any low-fertility society sustainably climbs back through replacement. None has yet; a country that managed it, and showed how, would turn the verdict from a one-way slide into a manageable cycle, and the early rich-world reversal toward higher fertility where gender equality is greatest is the place to look.
Watch South Korea and China for whether the bottom has a floor. Watch Sub-Saharan Africa, whose pace of decline sets the height of the 2084 peak more than any other factor.
It darkens if below-replacement fertility proves contagious and irreversible, if the desire gap widens as children grow costlier, and if aging societies turn to coercing births rather than supporting them. It brightens if shared parenting and real childcare make children compatible with the lives people actually lead, and the family people want and the family they have finally meet.
Everything done to the numbers between the source and the chart, disclosed in full. Where a choice is editorial rather than measured, we say so.
- Total fertility rate
- The number of children a woman would bear if she experienced, at each age, the age-specific birth rates of a single given year. It is a period snapshot, not a completed family size, so it reacts to the timing of births and can dip or spike without a matching change in how many children people ultimately have. World, regional, and country series are from the UN World Population Prospects (2024) via Our World in Data and the World Bank’s mirror of the UN Population Division. Replacement is taken as about 2.1.
- History versus projection, and the fan
- Every chart that crosses the present draws measured history as a solid line and projection as a dashed one. Single projected lines use the UN’s medium variant; Fig. 20 shows the full fan — the UN low, medium, and high variants, which differ by roughly half a child per woman sustained and span more than seven billion people by 2100. The variants and the demographic-indicator series are taken directly from the UN WPP 2024 bulk files (CC BY 3.0 IGO); the medium population line and the long history also appear via Our World in Data.
- The rival projection (cited, not re-hosted)
- Fig. 20 cites an independent projection from the Institute for Health Metrics and Evaluation (Vollset et al., The Lancet, 2020), which peaks world population earlier and lower than the UN. It is referenced and linked, not charted from re-hosted data, because its terms are non-commercial. The disagreement between two careful teams is shown precisely because it is the honest measure of how uncertain the long-run future is.
- The drivers
- Child mortality (UN IGME, deaths before five per 100 live births) is shown as the principal cause; girls’ secondary enrolment and women’s labour-force participation (World Bank, from UNESCO and the ILO) and the adolescent fertility rate (UN Population Division via the World Bank) trace the human mechanism. The reversal of the fertility–development relationship at high incomes is attributed to the research of Myrskylä, Kohler & Billari (Nature, 2009) and Doepke, Hannusch, Kindermann & Tertilt (2022); the quantity–quality framing to Gary Becker; the transition framework to Frank Notestein; the low-fertility-trap hypothesis to Lutz and colleagues; and the depopulation-and-growth argument to Charles I. Jones (2022). These are characterised qualitatively and cited, never converted into numbers we did not measure.
- Aging, dependency, migration, sex ratio
- Share of population aged 65+ and the old-age dependency ratio are World Bank series from the UN Population Division. Net migration rate by income group and sex ratio at birth are taken directly from the UN WPP 2024 file. The income groups are the World Bank’s; the natural sex ratio at birth is about 105 boys per 100 girls, so sustained values above ~107 indicate sex selection.
- The desire gap (cited, not charted)
- The finding that people report wanting more children than they have draws on survey programmes — the Demographic and Health Surveys and rich-country equivalents — whose micro-data we do not re-host. It is discussed qualitatively and informs the despair reading; no specific figure is asserted as our own measurement.
- The composite verdict
- The headline verdict and the hope / despair / confusion reading on each chart are an editorial synthesis of the evidence, not a calculated score. For this question the synthesis deliberately holds the two readings unresolved, because the benign cause and the structural cost are the same fact seen from different positions. Every charted series is real, ingested, validated, and individually sourced and downloadable; cited research and surveys are linked, not re-hosted.
- Our World in Data — Children per woman (UN WPP) — ourworldindata.org/grapher/children-per-woman-un ↗ · CC BY 4.0 · vintage 2026World total fertility rate and the four country series (South Korea, China, Japan, Niger); UN World Population Prospects 2024.
- World Bank — Fertility rate, total (SP.DYN.TFRT.IN) — data.worldbank.org/indicator/SP.DYN.TFRT.IN ↗ · CC BY 4.0 · vintage 2026The regional fertility fan and the by-country spread; UN Population Division via the World Bank.
- Our World in Data — Population growth rate / births / median age (UN WPP) — ourworldindata.org/grapher/population-growth-rates ↗ · CC BY 4.0 · vintage 2026Growth rate, annual births, and median age, history and UN medium projection.
- Our World in Data — Population, with UN projections — ourworldindata.org/grapher/population-long-run-with-projections ↗ · CC BY 4.0 · vintage 2026World population, measured history and UN medium-variant projection to 2100.
- UN World Population Prospects 2024 — Demographic Indicators (direct) — population.un.org/wpp ↗ · CC BY 3.0 IGO · vintage 2024Taken directly from the published bulk files: the low/high projection fan, sex ratio at birth, and net migration by income group. UN DESA, Population Division.
- World Bank — girls’ secondary enrolment, women’s labour force, adolescent fertility — data.worldbank.org/indicator/SP.ADO.TFRT ↗ · CC BY 4.0 · vintage 2026SE.SEC.ENRR.FE (UNESCO), SL.TLF.CACT.FE.ZS (ILO), SP.ADO.TFRT (UN Population Division) — the drivers.
- World Bank — aging & dependency (SP.POP.65UP.TO.ZS, SP.POP.DPND.OL) — data.worldbank.org/indicator/SP.POP.65UP.TO.ZS ↗ · CC BY 4.0 · vintage 2026Share over 65 (world and by region) and the old-age dependency ratio; UN Population Division via the World Bank.
- UN IGME — Under-five mortality, via Our World in Data — childmortality.org ↗ · CC BY 4.0 · vintage 2026Deaths before age five per 100 live births; the cause underlying the fertility fall.
- IHME — Vollset et al., 'Fertility, mortality, migration, and population scenarios’ (The Lancet, 2020) — www.thelancet.com/journals/lancet/article/PIIS0140-6736(20)30677-2/fulltext ↗ · academic — link-only · vintage 2020The independent rival projection cited in Fig. 20 (peak earlier, ~9bn by 2100); referenced and linked, not re-hosted.
- Doepke, Hannusch, Kindermann & Tertilt — 'The Economics of Fertility: A New Era’ (2022); Myrskylä, Kohler & Billari (Nature, 2009) — www.nber.org/papers/w29948 ↗ · academic — link-only · vintage 2022The reversal of the fertility–development relationship at high incomes; cited qualitatively in Fig. 14.
- Charles I. Jones — 'The End of Economic Growth? Unintended Consequences of a Declining Population’ (AER, 2022) — www.aeaweb.org/articles?id=10.1257/aer.20201605 ↗ · academic — link-only · vintage 2022The argument that ideas need people, so depopulation could end growth; cited in Fig. 21.
- Lutz, Skirbekk & Testa — the low-fertility-trap hypothesis (2006); Pritchett — desired fertility and policy (1994) — www.jstor.org/stable/20058983 ↗ · academic — link-only · vintage 2006The trap (fertility self-reinforcing below ~1.5) and the policy-skeptic view (desired fertility drives actual); cited in the takes and back matter.
Cite this page
Reference
Hope & Despair. “Is the world running out of children?.” Hope & Despair, 2026. https://hopeanddespair.world/questions/is-the-world-running-out-of-children.
BibTeX
@misc{hopeanddespair:is-the-world-running-out-of-children,
  author       = {{Hope & Despair}},
  title        = {{Is the world running out of children?}},
  year         = {2026},
  howpublished = {\url{https://hopeanddespair.world/questions/is-the-world-running-out-of-children}},
  note         = {hopeanddespair.world, updated 2026-06-14}
}
Original prose, code, and chart designs are released under CC BY 4.0 ↗ — reuse freely with attribution. Source datasets keep their own licences, listed above. Add your access date when citing.
- Mobile-first chart system + redesign branch snapshot View diff →
Generated from the commit history — every edit to a number, a word, or a chart is tracked in the open. Browse the full history & diffs on GitHub →
in plain words
Still lost? Read this.
Here is the whole thing in plain words. A hundred years ago, having a lot of children was partly insurance, because so many died young. About one in four children did not reach their fifth birthday. Today, almost everywhere, that number has collapsed to fewer than one in twenty-five. Once parents could trust that their children would live, and once girls could go to school, work, and decide for themselves, families got smaller, fast. The average woman went from about five children in the 1960s to about two today.
That sounds like a problem only if you stop there. Mostly it is the opposite: it is what success looks like. The terrifying “population bomb” people feared in the 1960s never went off, not because of famine or force, but because billions of people freely chose to have fewer kids as their lives got better. The world will still grow for another sixty years or so, to around ten billion people, before it gently starts to shrink — though honest forecasters disagree by billions about exactly where it lands.
The catch is what a world of few children slowly becomes: an old one. With fewer young people coming up behind, the share of people over 65 has doubled, and there are fewer workers to support each retiree. That strains pensions, care, and budgets. The hardest cases, like South Korea at 0.7 children per woman, are already halving themselves each generation with no proven way to turn it around — and the rich world’s main fix, immigration, only works by drawing the young out of poorer countries. Quietly, too, surveys keep finding that people say they want more children than they actually have, which means some of this is not free choice but a world too expensive and rushed to raise the families people want.
So is the world running out of children? Not in the sense of disappearing. But in the places furthest down this road, there really are too few young people to keep things running the way they were built to run, and nobody has figured out how to change that without changing the good things that caused it. The honest one-liner for dinner: children stopped dying and women got to choose, so families got smaller, and now we have to pay for that gift by growing old — and we genuinely don’t yet know whether that’s a crisis or just a change.