Question 04 · Poverty
Is the world winning against poverty?
The steepest fall in the history of need — and it stalled, climbed the wrong way up the income ladder, and pooled into Africa. Whether a tenth of humanity is poor or four-fifths of it depends on where you draw a line.
you read
- “Poverty” here is mostly money poverty — income or consumption set against an international line. The poverty that is not money (poor health, no schooling, no safety, no voice) shows up only where a separate index catches it.
- The international line is a price, not a fact. It converts every currency through purchasing-power estimates that are rebased every few years, which moves every number on these charts with nobody’s actual life changing.
- Every chart runs on real ingested data — the World Bank’s Poverty and Inequality Platform, the World Development Indicators, the World Inequality Database, the ILO, and the WHO/UNICEF water programme — with source, data package, and lineage downloadable under each figure. The evidence panel at the top is a hand-composited orientation graphic, not a single measured series.
- Years after a country’s last household survey are nowcasts — model estimates, not counts. They are drawn here as the Bank publishes them; read the most recent points as projection, not observation.
evidence
Stand back two hundred years and the answer is unambiguous: almost everyone was poor, and now most people are not. Stand close to the last few years and the line goes flat — the count of the extreme-poor has barely moved since 2019, and in Africa it is rising.
The world count of the extreme-poor stopped falling around 2019 and Africa’s count kept rising, which is what turns a four-decade success into an open question about the next decade rather than a finished victory.
1 of 4 signals point to deterioration · 3 toward progress
A global rate of one-in-ten is no description of a village in the Sahel, where the rate never fell below one-in-two and the number of poor keeps climbing year on year.
the lived now
A world rate of one-in-ten means nothing in a village where it is still one-in-two and no surveyor has come in years.
Were our ancestors as poor as the poorest people alive today?
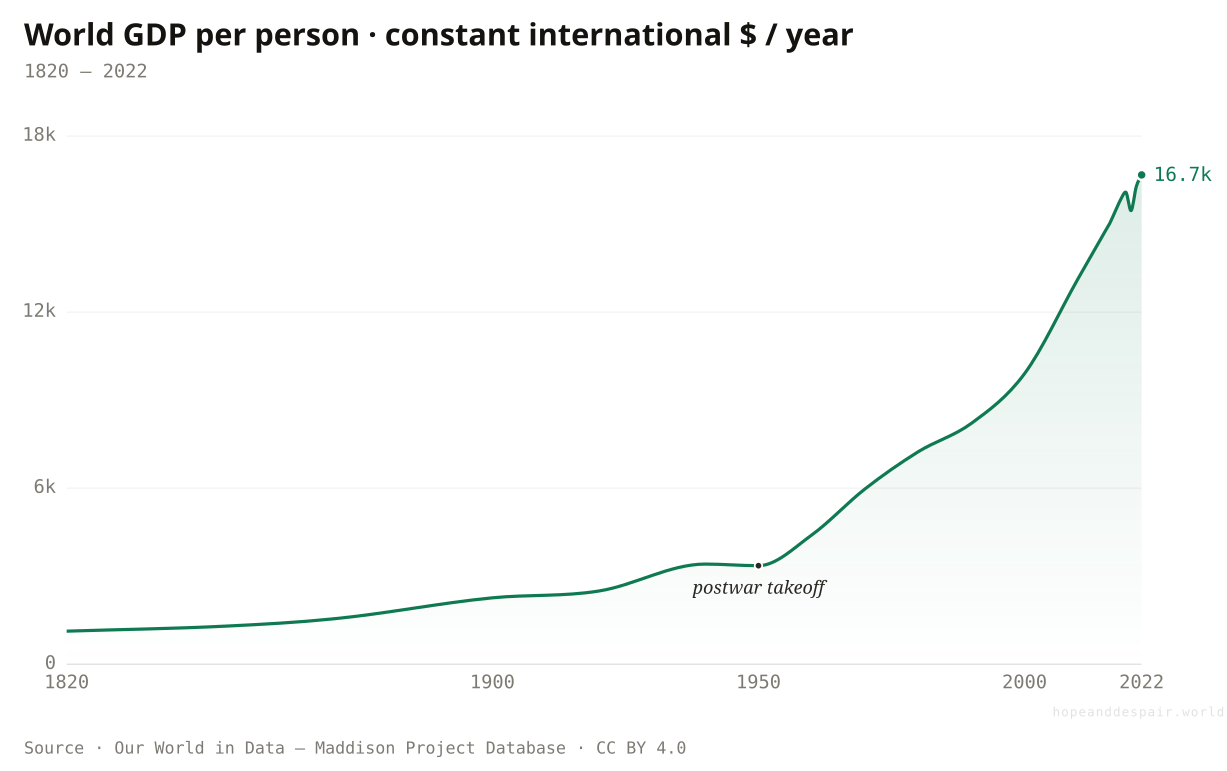
For all but the last two centuries, almost everyone was poor.
Go back far enough and the rich countries look like the poor ones look like everywhere else: a person produced in a year about what a subsistence farmer produces now. In 1820 the average human lived on the equivalent of a little over three dollars a day, and that figure had scarcely moved in a thousand years. Then, across a couple of centuries, world output per person multiplied roughly fifteen times over, to around forty-six dollars a day.
What broke the long flat was industry — first in Britain, then across the West, much later in Asia — and it arrived in different places centuries apart. That is the catch hidden inside this clean rising curve. It is a world average, and for most of its length the average was pulled up by a handful of countries while the rest stayed close to where humanity had always been. The escape was real, but for a long time it belonged to very few.
How this number was made
What it measures. Average economic output per person in a country or region per year. This data is adjusted for inflation and differences in living costs between countries.
Calculation. Selected entity World.
The displayed line is monotone-cubic smoothed for legibility only — it never moves a data point.
Mass poverty was the normal condition of humanity for all of recorded history, and in two centuries we left it behind.
The escape was wildly uneven — for most of this curve, the gains belonged to a few countries and bypassed the rest.
A single world average says nothing about who got rich and when; it blends the first industrial nations with the last and describes neither.
And lately — is the average income still climbing?
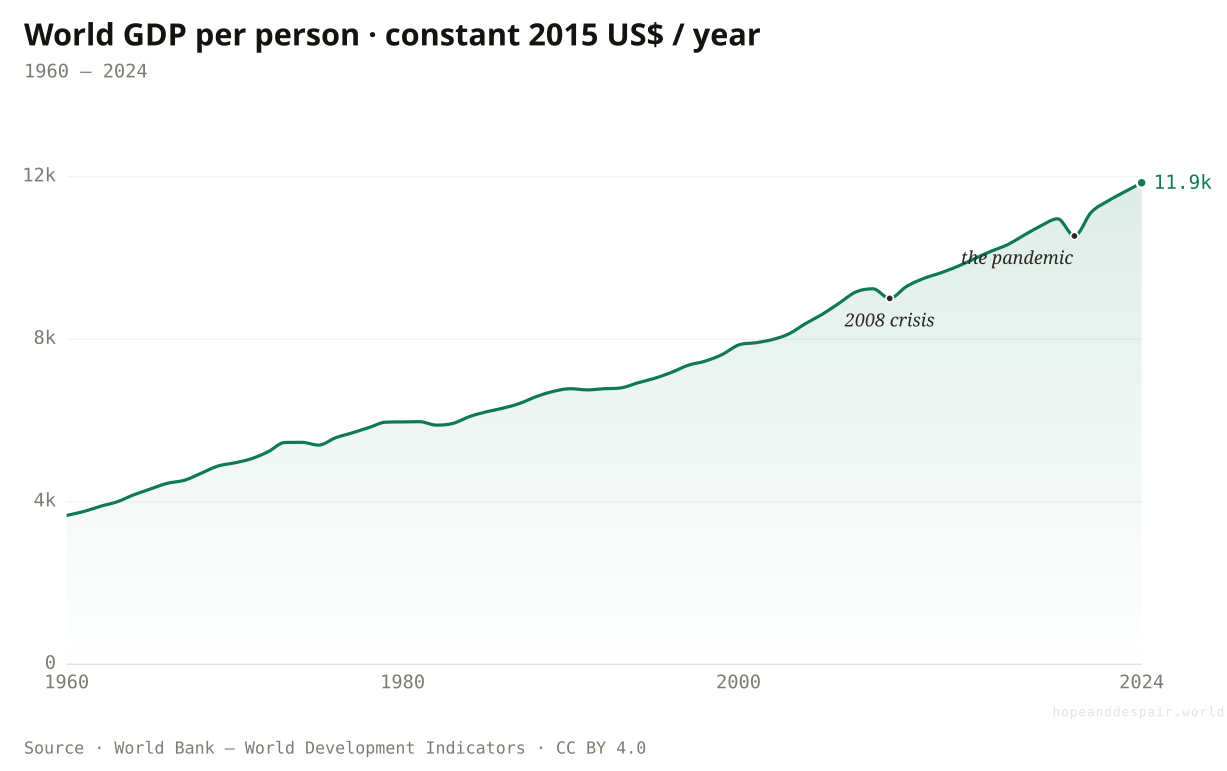
Adjusted for inflation, the world is more than three times richer per person than in 1960.
Hold the measuring stick still — count in dollars of one fixed year — and the modern slice of that long arc comes into focus. The average person had about 3,700 of today’s dollars to live on in 1960; by 2024 the figure was close to 11,900, a little more than three times as much. The climb is not smooth: you can read the 2008 financial crisis and the 2020 pandemic straight off the line, each a visible notch where the world economy shrank for a year before resuming.
This is the inflation-adjusted version of the figure most often quoted in plain dollars, and it sits lower than the curve above because it converts currencies at market exchange rates rather than by what money actually buys. The warning underneath it is the same one the rest of this article keeps returning to. An average is not a floor. The same growth that tripled the mean left the poorest region almost exactly where it began, which is why a rising world income and a stalled war on poverty can both be true.
How this number was made
What it measures. GDP per capita (constant 2015 US$)
Calculation. Selected entity WLD.
The displayed line is monotone-cubic smoothed for legibility only — it never moves a data point.
Even measured at market exchange rates, real income per person has more than tripled in two generations.
An average is not a floor — the same tripling left the poorest region almost exactly where it started.
Market-rate dollars and purchasing-power dollars give different levels, so this line and the one above measure one idea on two rulers.
How fast did the modern fall in poverty actually happen?
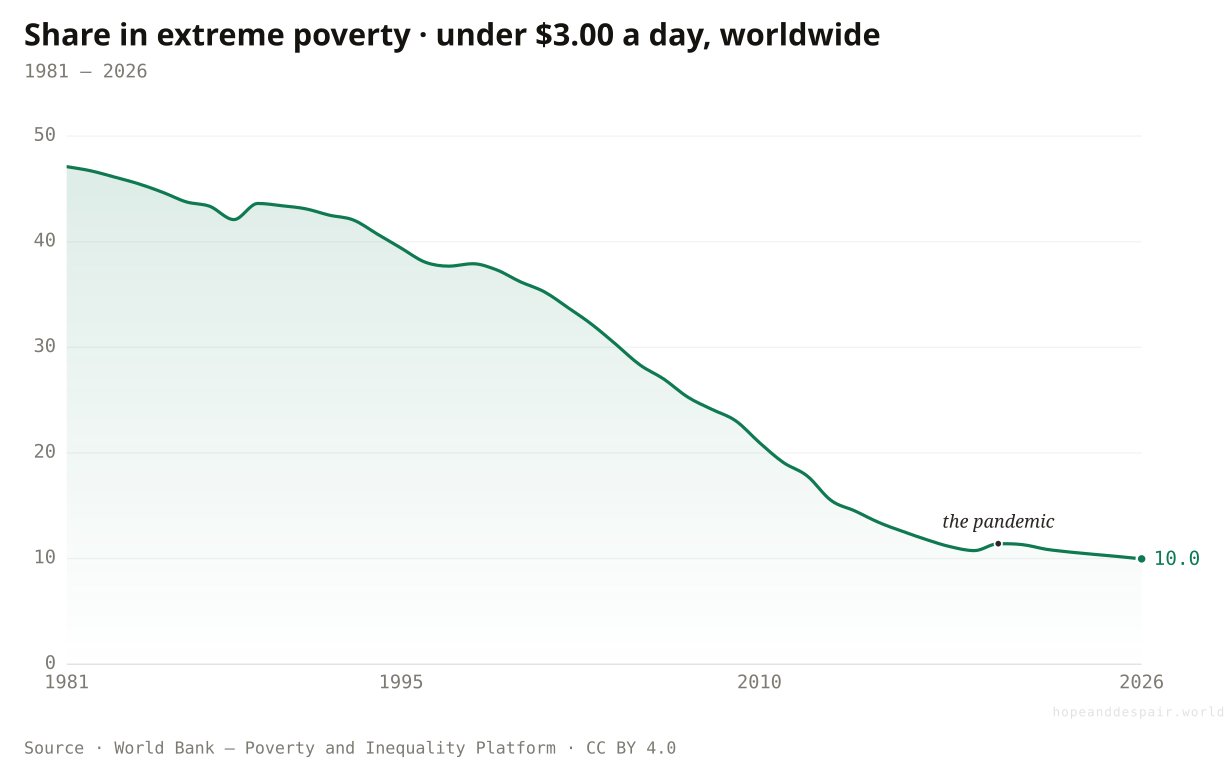
In forty years the share of humanity in extreme poverty fell by more than three quarters.
In 1981, measured against the line the World Bank now draws at three dollars a day, about 47 of every 100 people alive were extreme-poor. By 2024 it was close to 10. No previous span of human history moved the number that far that fast, and most of the distance was covered in a single generation between 1990 and 2015.
The engine was growth in Asia, which is the rest of this article waiting to be told. But the line on the right is the warning. The fall slowed after 2015, the pandemic pushed the rate back up in 2020, and since then it has crept rather than plunged. A curve that looked unstoppable for thirty years now looks like it is approaching something it cannot easily cross — the poverty that growth alone has never reached.
How this number was made
What it measures. Population below $3.00/day (2021 PPP), World
Roughly a billion people crossed out of extreme poverty in a single generation — the headline achievement of our age.
The fall has stalled near a tenth of the world, and the last stretch is the one growth has never managed on its own.
The exact figure swings every time the line is repriced, so the precise percentage matters less than the shape.
How many people are poor — is that even a single number?
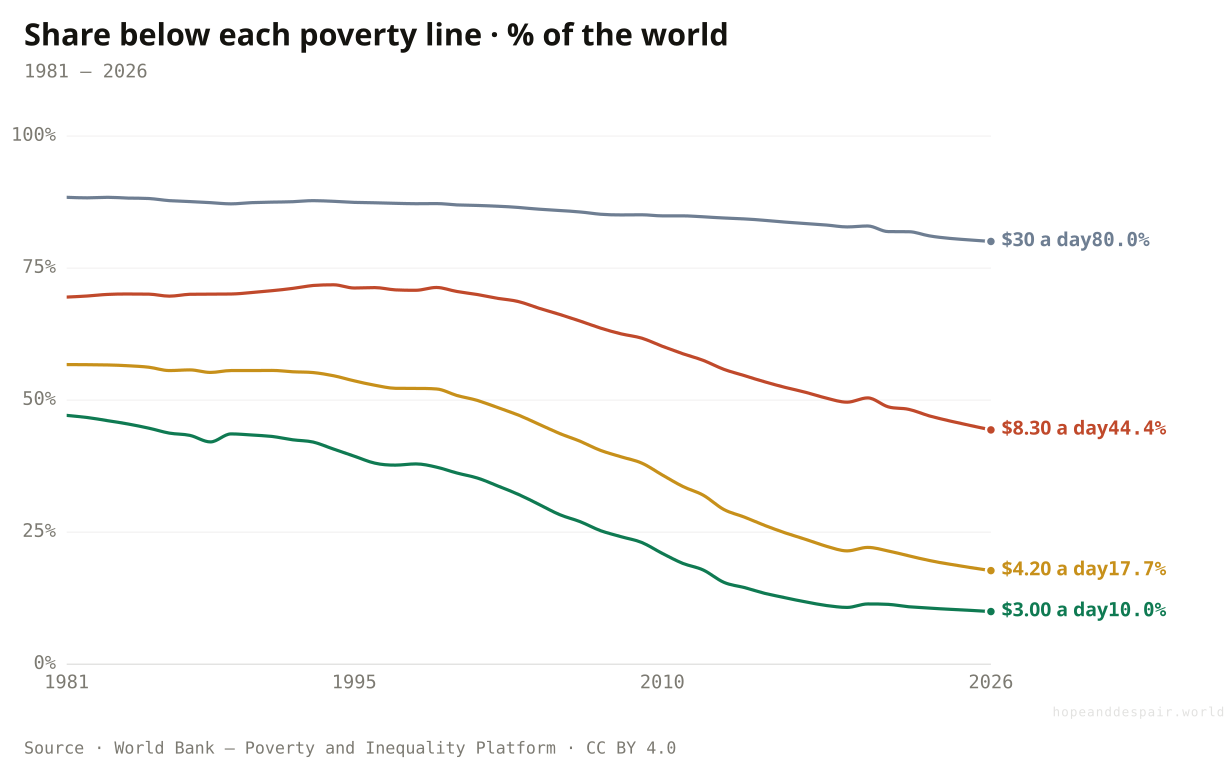
Move the line, and a tenth of the world becomes four in five.
Ask how many people are poor and the honest first answer is another question: poor by which line? At three dollars a day, about 11 of every 100 people qualified in 2022. Raise the line to $4.20 — a typical poverty line for a lower-middle-income country — and it is 21. Raise it again to $8.30, where many middle-income countries set theirs, and it is 48. Push it all the way to $30 a day, the line a rich country like the United Kingdom draws for its own citizens, and roughly four in every five people on Earth fall below it. Same planet, same year, four different headlines.
None of these lines is arbitrary, and none is the truth. The first three are the average of the national poverty lines that countries at each income level actually use, so the lowest tracks what the poorest countries call destitution and the highest tracks what a middle-income country calls getting by. The fourth is not a World Bank line at all — it is what a wealthy society considers the bottom, turned on the whole world as a thought experiment. Which one you quote decides whether the story is a near-finished triumph or a planet where most people are still scraping. The number is real. So is the choice behind it.
How this number was made
What it measures. Population below $30.00/day (2021 PPP), World
By every line, the share has fallen hard over forty years — the direction does not depend on the ruler.
By the line rich countries draw for themselves, the great escape barely happened — nearly nine in ten people were poor in 1981, and four in five still are.
There is no single true poverty line; the most-quoted number is the most flattering one.
If the rate keeps falling, why doesn’t the headcount empty out?
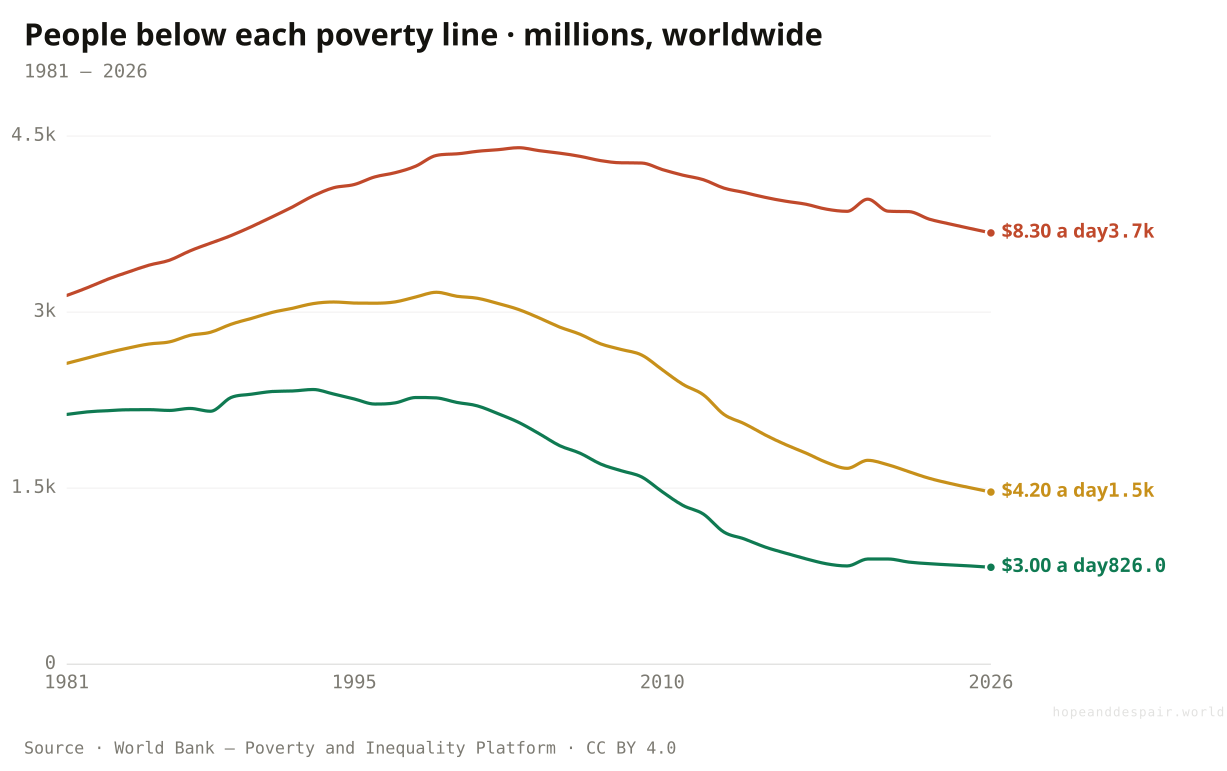
Nearly four billion people live on less than $8.30 a day.
Counts behave differently from rates. At the three-dollar line, about 870 million people were extreme-poor in 2022 — a number that has roughly halved since 1990. At $4.20 it was 1.6 billion. At $8.30 it was 3.9 billion, and that top figure has barely fallen in forty years: 3.1 billion in 1981, 3.9 billion now.
The reason the upper count holds while the rate drops is that the world kept adding people. A falling share of a growing population can leave the absolute number almost unchanged, and at the higher line it has. So the most quoted figure — the few hundred million in extreme poverty — is the one shrinking fastest, and the figure that covers most of humanity is the one standing nearly still. Both come from the same surveys; they just answer different questions.
How this number was made
What it measures. Number of people below $8.30/day (2021 PPP), World
The number in extreme poverty has roughly halved since its peak, even as the world added billions of people.
By the higher line, the count of the poor is no lower than it was in 1981 — growth ran in place against population.
Whether poverty is shrinking or stuck depends entirely on which line you count people under.
Can a country simply grow its way out of poverty altogether?
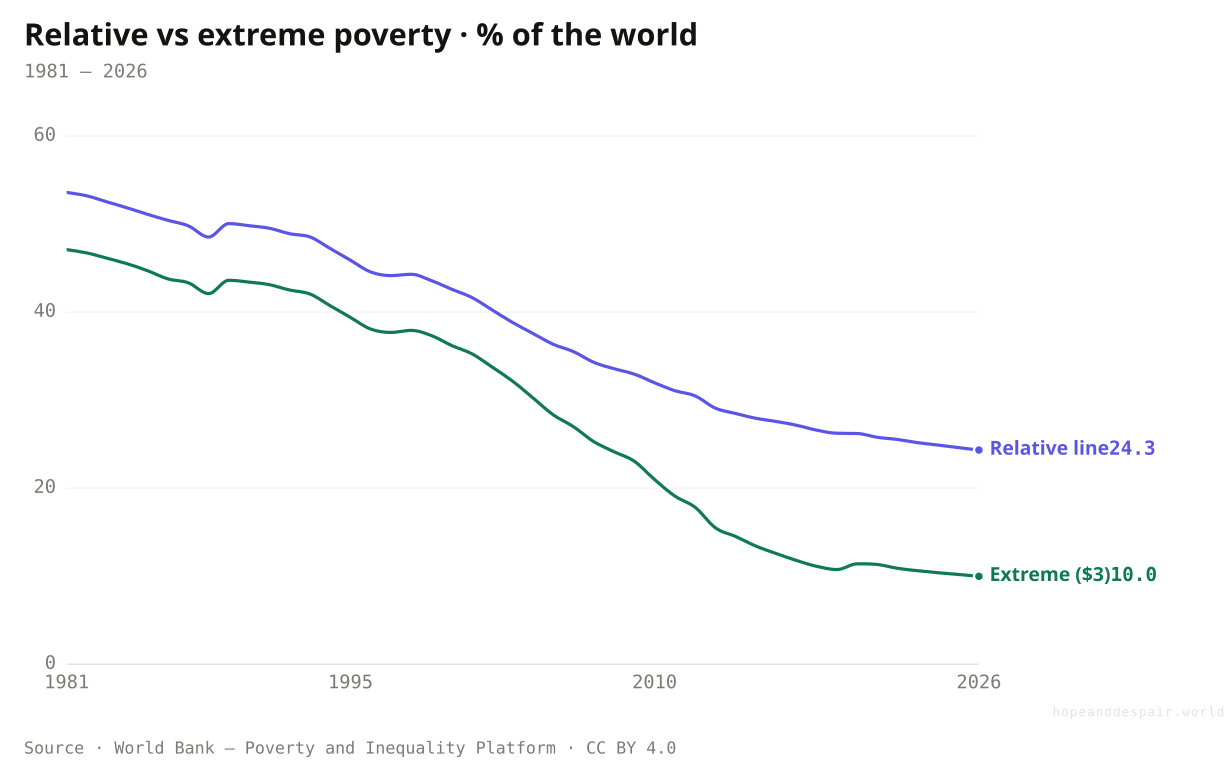
You cannot grow your way out of relative poverty.
The World Bank keeps a second kind of line that moves as a country gets richer — set at half the national median income, with a floor underneath it. By that societal line, about a quarter of the world was poor in 2022, and that share has barely shifted while absolute poverty collapsed: 54 percent in 1981, 26 percent in 2019, 25 today.
The two lines tell opposite stories on purpose. Absolute poverty asks whether you can meet basic needs, and growth answers it. Relative poverty asks how far you sit below the middle of your own society, and growth lifts the floor and the middle together, so the distance holds. A country can end destitution and still leave a quarter of its people poor by the standards of their neighbours. One of these is a problem economies can outgrow. The other one travels with them.
How this number was made
What it measures. Societal (relative) poverty rate, World
Even the relative measure fell by half — growth narrowed the gap to the middle, not only the distance to survival.
A quarter of humanity is still poor relative to its own society, and that share has hardly moved in fifteen years.
Relative and absolute poverty are different things wearing the same word, and they can move in opposite directions at once.
Did poverty fall everywhere, or only in some places?
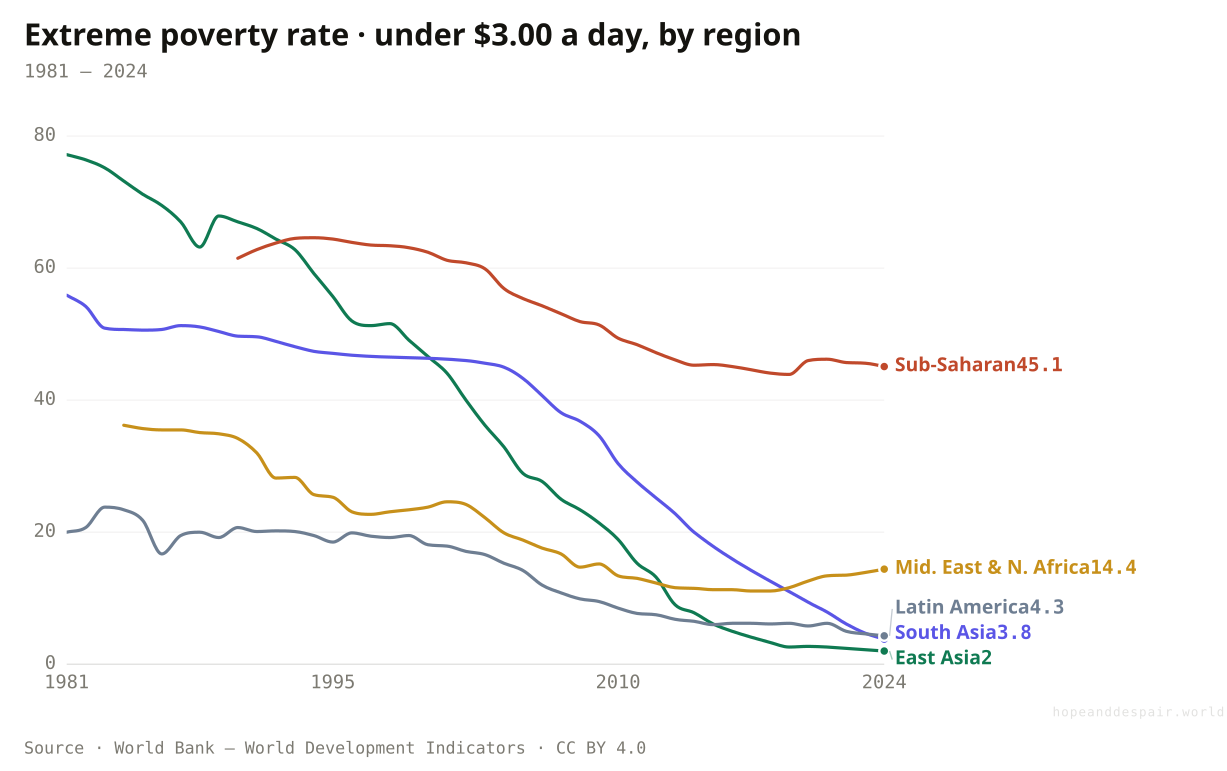
Every region’s poverty rate fell — and they did not fall together.
Follow each region’s poverty rate down and the spread is the story. East Asia went from 77 percent extreme-poor in 1981 to 2 percent in 2024 — the steepest mass escape ever recorded. South Asia fell from 56 to about 4. Latin America roughly quartered its rate. These are the great convergences: the regions that started poorest fell furthest and fastest.
Two lines bend the other way. Sub-Saharan Africa is the exception that shapes the whole article: its rate fell too, from about 61 percent in 1990 to the mid-forties, but it never collapsed the way Asia’s did, and after 2020 it ticked back up from 44 to 46 percent. The Middle East and North Africa is the quieter warning — down to about 12 percent by 2019, then climbing back toward 14 as war spread through Yemen, Syria, and Sudan. A region can be making progress and losing ground at once, and these two are doing both: their rates broadly improving over the long run, their grip on the world’s remaining poverty tightening. The next chart is why.
How this number was made
What it measures. Poverty headcount ratio at $3.00 a day (2021 PPP) (% of population)
Calculation. Selected entity EAS.
The displayed line is monotone-cubic smoothed for legibility only — it never moves a data point.
Over the long run every region cut its poverty rate, several of them to near zero.
Two regions — Africa and the Middle East — are now moving the wrong way, their rates rising since the pandemic.
A falling regional rate can still hide a rising number of poor people — the rate is only half the picture.
Where do the world’s poor actually live now?
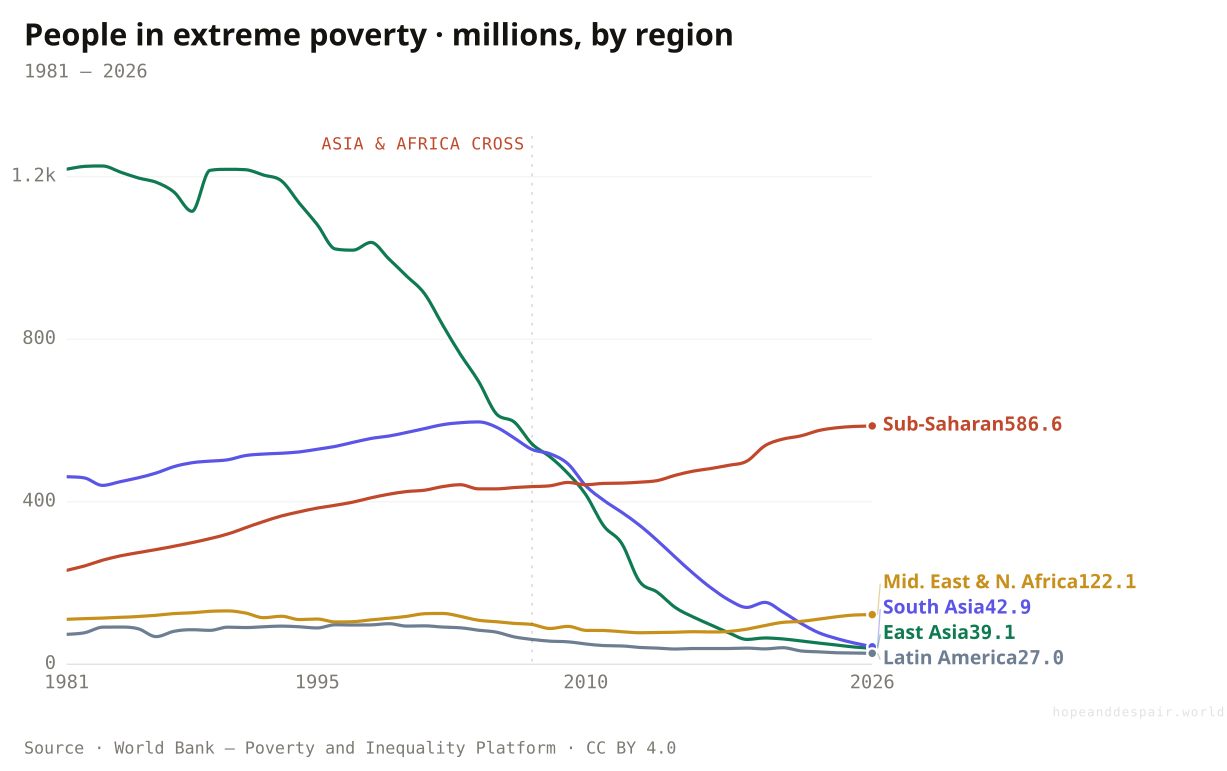
The world’s poor used to live in Asia. Now they live in Africa.
Forty years ago, East Asia held about 1.2 billion extreme-poor people — more than half of everyone on earth below the line. By 2026 it holds around 39 million. Over the same stretch Sub-Saharan Africa’s count climbed the other way, from 231 million to 587 million. The two lines cross near 2007, and after that Africa carries the largest single share of the world’s poverty.
This is the rate-and-count trap made visible. Africa’s poverty rate did fall — but its population grew faster than the rate dropped, so the number of poor rose even as the share declined. The global poor were not so much defeated as relocated: out of an Asia that grew explosively and into an Africa whose growth has not yet outrun its needs. Where the previous chart showed progress, this one shows where progress hasn’t gone.
How this number was made
What it measures. Number of people in extreme poverty (below $3.00/day, 2021 PPP), East Asia & Pacific
Asia drained its poverty almost completely — East Asia’s count fell by more than 1.1 billion people.
Africa’s poor more than doubled in number, and the continent now holds most of the world’s remaining poverty.
A region can lower its poverty rate and raise its poverty count at once, if its population grows faster than its rate falls.
Is “Sub-Saharan Africa” even one story?
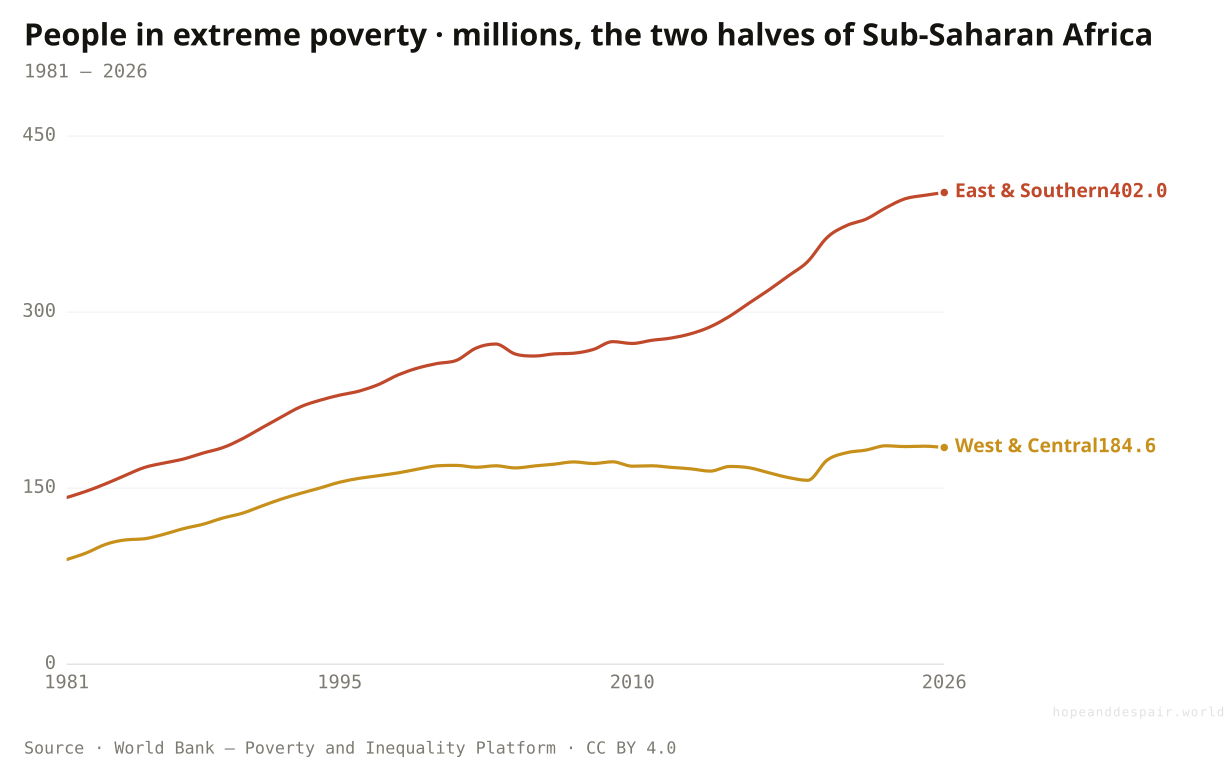
Even inside Africa the poverty is not spread evenly — it is piling up in the east and south.
Split that one Sub-Saharan line in two and the continent stops looking like a single place. The World Bank counts Africa as east-and-south and west-and-central, and the two halves have pulled apart. Eastern and Southern Africa — Ethiopia, the Sudans, Tanzania, Mozambique, Madagascar — saw its extreme-poor nearly triple, from about 142 million in 1981 to roughly 402 million. Western and Central Africa, where Nigeria and the Sahel sit, roughly doubled, from 89 to 185 million, even dipping for a stretch in the 2010s before turning back up.
Both halves are rising, which is the headline the continent shares. But the bulk and the steeper climb are in the east and south, where a long row of mid-sized, very poor countries stacks up and population is growing fastest. The single "Sub-Saharan" line in the previous chart is an average laid over a region coming apart — useful for the world picture, misleading if you read it as one economy. Where Africa’s poverty is worst, and where it is growing fastest, are questions the continental line cannot answer.
How this number was made
What it measures. Number of people in extreme poverty (below $3.00/day, 2021 PPP), Eastern & Southern Africa
Splitting the continent shows it is not a uniform failure — some countries within are holding their numbers down while others rise.
Both halves of Sub-Saharan Africa are adding poor people, and the east and south have nearly tripled their count in four decades.
Where the African line is drawn changes the story; one regional average can hide a continent diverging inside it.
How far apart are the richest and poorest regions, really?
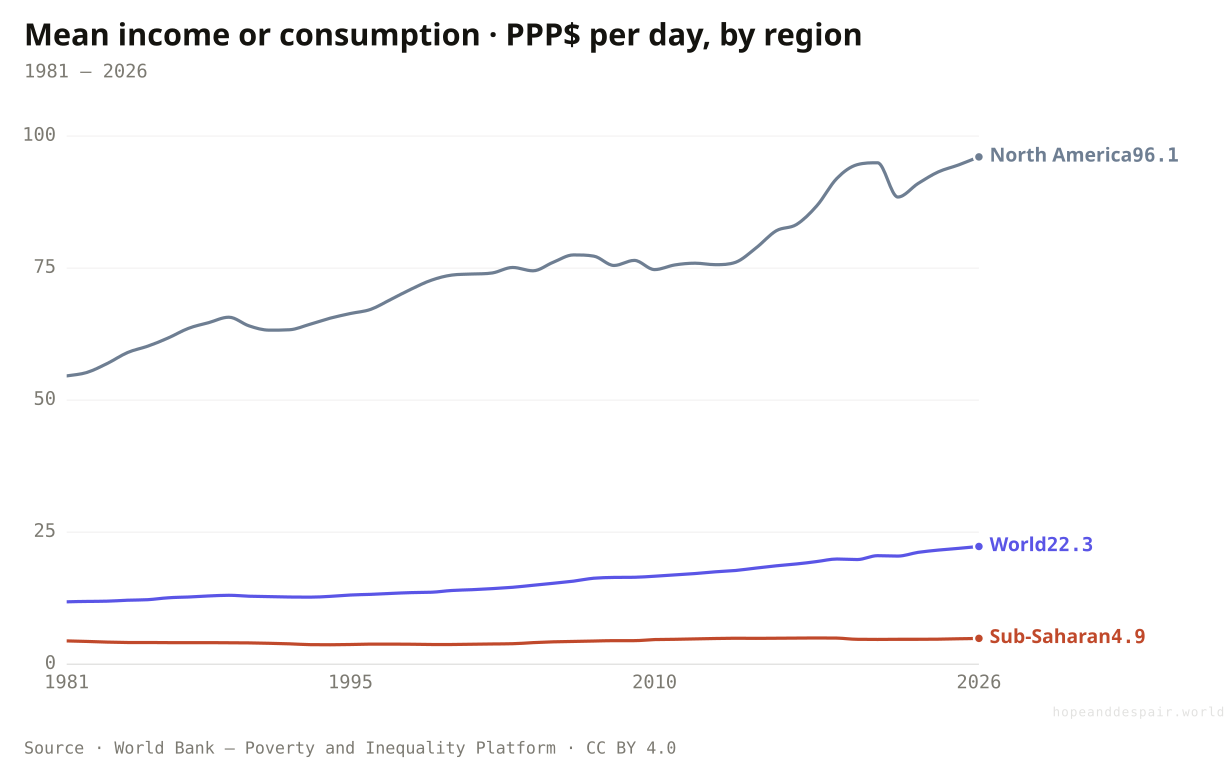
The richest region’s average income is about nineteen times the poorest’s — and the gap is not closing.
By the day, the average North American lived on about 88 dollars in 2022 and the average sub-Saharan African on about 4.70 — a gap of roughly nineteen to one. That alone is stark. What makes it a poverty story is the movement underneath: North America’s average income nearly doubled since 1981, while Africa’s has barely stirred, from about 4.40 to 4.90 dollars a day across more than four decades.
This is the engine the crossover chart was missing. Poverty empties out of a region when average incomes rise fast enough to pull people over the line, the way they did across Asia. Where the world’s poverty is now concentrated, that lift is not happening — incomes are nearly flat in real terms. A region cannot drain poverty it is not growing out of, and the poorest region has spent forty years close to standing still.
How this number was made
What it measures. Mean income or consumption per day, North America
The world’s average income roughly doubled in a generation — the middle of humanity is markedly richer.
The poorest region’s average has not moved in forty years, while the richest’s pulled further ahead.
Averages hide the spread inside each region; a regional mean can rise while its poorest people gain nothing.
Among the people still poor, how far below the line do they fall?
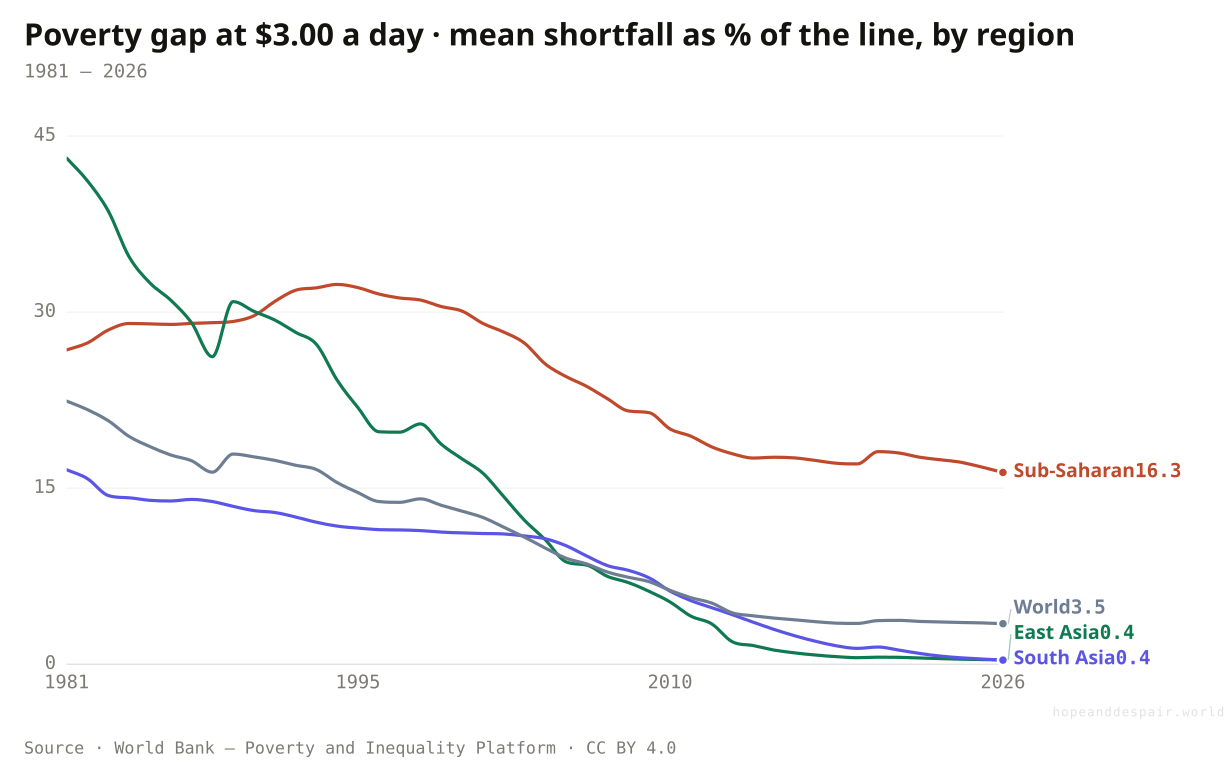
Africa’s poverty is the deepest in the world, as well as the most widespread.
A headcount treats everyone below the line alike, whether they are a cent short or living on almost nothing. The poverty gap corrects for that: it measures how far below the line people fall on average, counted as a share of the line itself. Read that way, the regions pull apart. East Asia’s gap has all but closed — about half a percent — so the few who remain poor there sit just under the line. South Asia’s is nearly as small. Sub-Saharan Africa’s is around 16 percent, down from the high twenties in the 1980s but a world away from Asia’s near-zero.
That figure is the hard core of the whole problem. A shallow gap can be closed by a little growth nudging people over a line they already sit close to. A deep gap means the poor are a long way down, and the same growth lifts them without carrying them across. So Africa shoulders a burden the count chart only half revealed: not the most poor people alone, but the poor who are furthest from the line they need to clear. The depth is what turns a hard problem into an entrenched one.
How this number was made
What it measures. Poverty gap at $3.00/day (2021 PPP), Sub-Saharan Africa
In Asia the gap has all but vanished — the poor who remain sit within a hair of the line.
Africa’s poverty gap has narrowed only slowly and still sits near 16 percent — its poor are both the most numerous and the deepest down.
Depth and headcount can move apart; a region can lower its count while the poverty of those left behind stays just as deep.
Is poverty only about money?
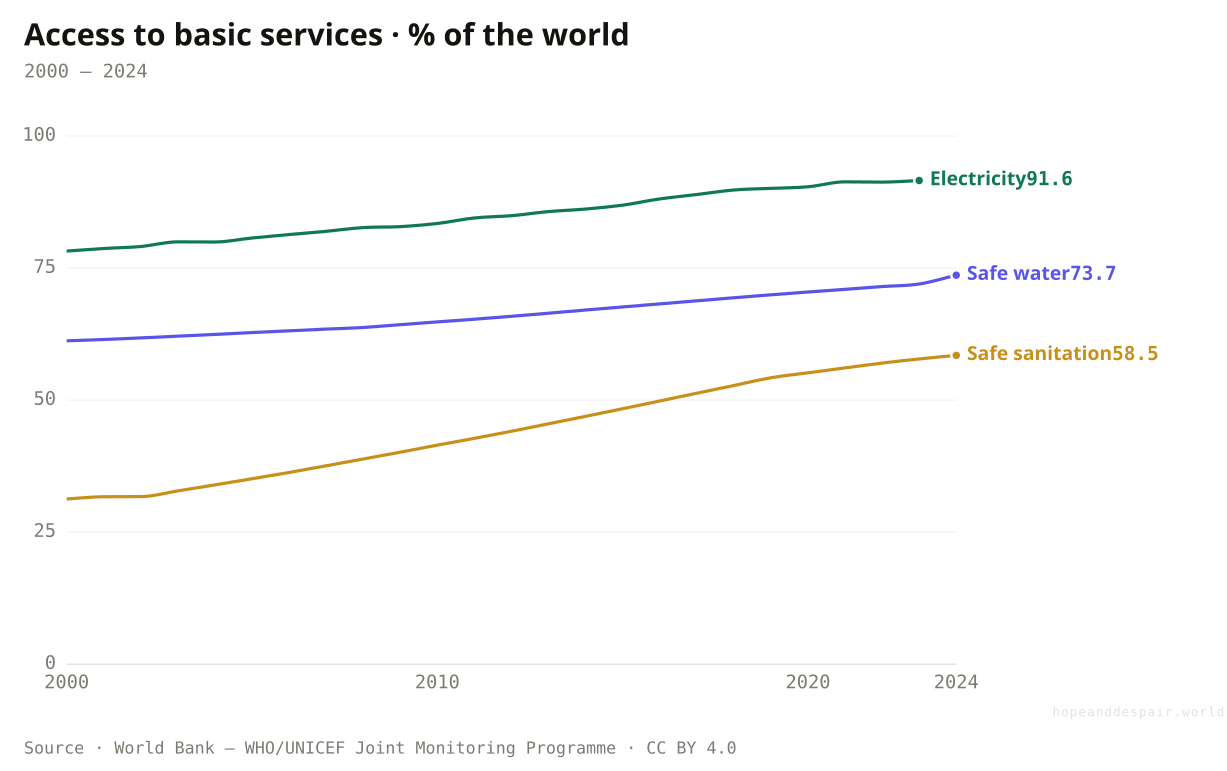
By the measures that aren’t money, the floor rose almost everywhere.
Money is one axis of poverty, and on the others the news is better. The share of the world with safely managed drinking water climbed from 61 percent in 2000 to 74 percent. Safe sanitation went from 31 percent to 58. Access to electricity reached 92 percent of the planet. These are the living-standards rungs a multidimensional poverty index actually counts, and they kept rising even through the income stall.
That matters because it means a person can be poor in dollars and less poor in daily life — gaining a tap, a toilet, a light — at the same time. It also splits the verdict in a useful way. The slowest progress is in the same places the count chart flagged: Sub-Saharan Africa still trails on every one of these. But the direction, almost everywhere, is up, and these are gains a wage figure on its own will never show you.
How this number was made
What it measures. Access to electricity means having an electricity source that can provide very basic lighting, and charge a phone or power a radio for 4 hours per day.
Calculation. Selected entity World.
The displayed line is monotone-cubic smoothed for legibility only — it never moves a data point.
Water, power, and sanitation reached hundreds of millions more people even while incomes stalled — real gains money charts miss.
Two in five people still lack safe sanitation, and the gaps sit in the same poorest places.
Income poverty and material deprivation overlap but aren’t the same set of people, so the two can move at different speeds.
If you measure poverty by deprivation instead of dollars, where is it worst?
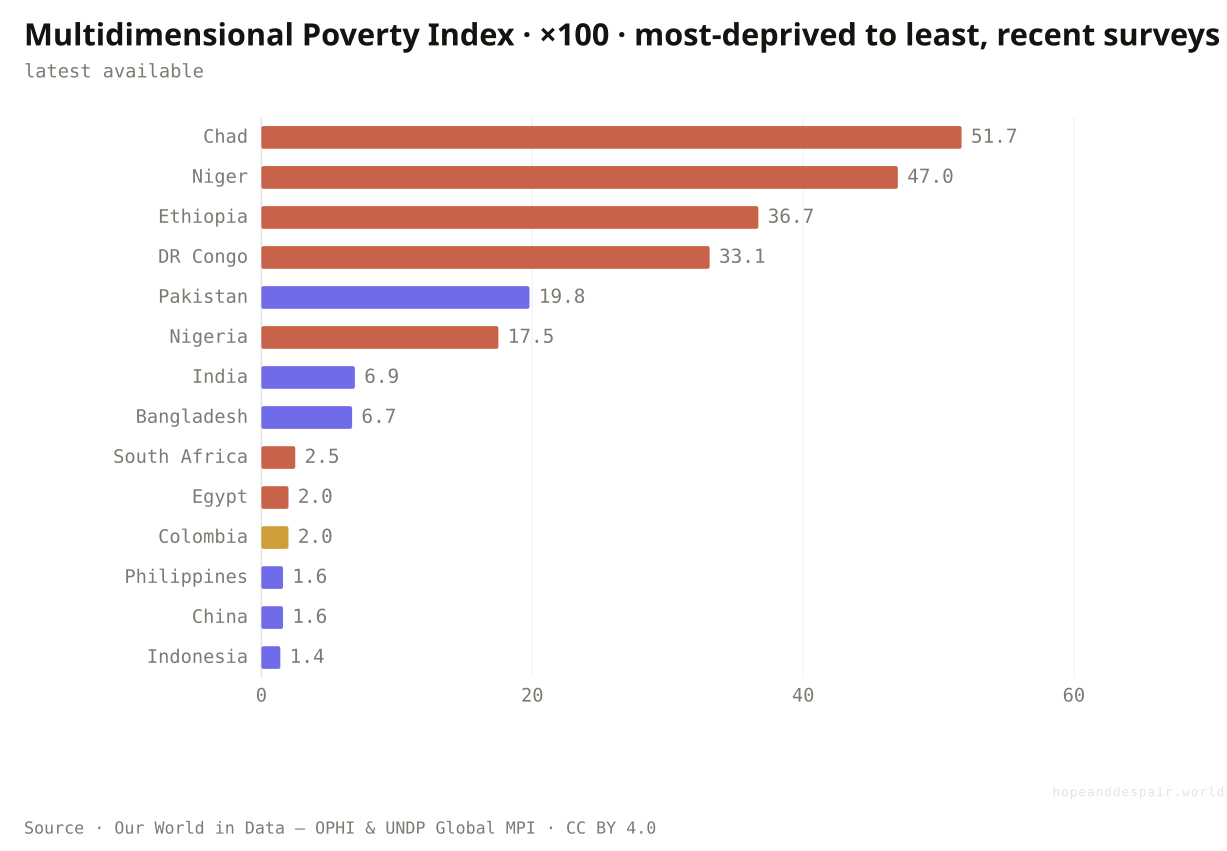
By a yardstick that counts health and schooling, not just cash, the poorest places look poorer still.
The dollar line asks one question — can you buy a basket of goods — and answers it with a single number. The Multidimensional Poverty Index asks a different set: is a child in the household out of school, is anyone undernourished, does the home have a clean floor, a toilet, electricity, safe water. It counts a person as poor if they are deprived on enough of these at once, and weights the count by how many deprivations pile up. The result is a map that mostly agrees with the income map — and sometimes sharply doesn’t.
The agreement is the Sahel and central Africa, where the bars run highest: in Chad and Niger around half the population is multidimensionally poor, deprived across health, schooling, and the basics of a home. The disagreement is more telling. India’s score is modest here even though it holds an enormous number of the income-poor, because schools and water reached further than wages did. South Africa’s is low on deprivation yet the country is among the most unequal on earth. Money and deprivation are two readings of the same word, taken with different instruments, and where they part is exactly where a single poverty number misleads.
How this number was made
What it measures. Global Multidimensional Poverty Index (national, current-margin estimate), latest available survey per country, ×100; a curated 14-country spread. MPI = headcount × average deprivation intensity across 10 indicators.
Calculation. MPI ×100, latest available survey per country, 14 curated countries sorted descending.
By this fuller measure too, deprivation has retreated to a shrinking set of countries — most of Asia now scores near zero.
Where it remains, it is severe: half of Chad and Niger are deprived across health, schooling, and home at once.
Money poverty and deprivation poverty rank countries differently, so which places are 'poorest’ depends on the instrument you pick.
Are the poor poor because they don’t work?
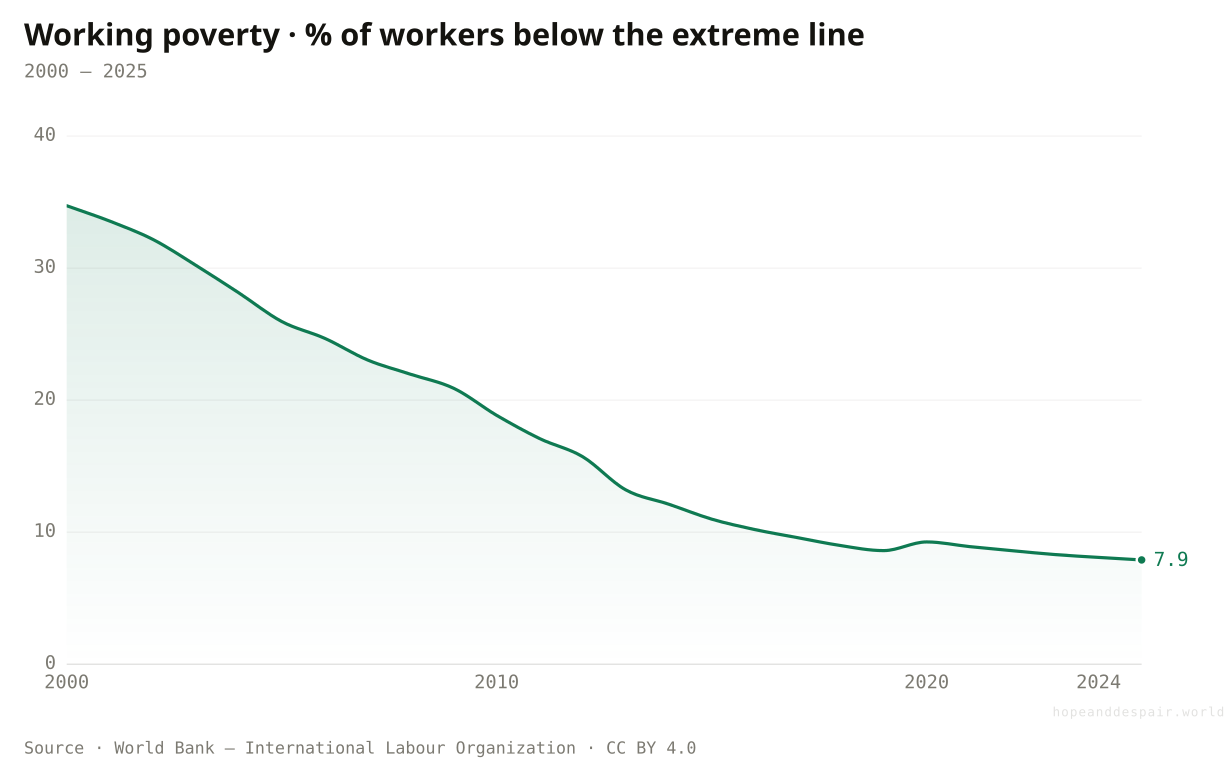
Most of the world’s poor have jobs.
Idleness is rarely the cause. In 2000, about 35 percent of the world’s workers earned too little to clear the extreme line even while employed; by 2024 that working-poverty rate had fallen to 8 percent. The drop tracks the broader poverty fall almost exactly, because the same thing drove both — work in Asia became far more productive, and a more productive day’s labour pays its way over the line.
What the fall hides is how thin the margin still is. Most jobs in poor countries are informal, off the books and without a contract, and a wage can sit just above the poverty line while a single illness or a failed harvest drops the household back under it. Having work stopped being a guarantee of escaping poverty somewhere in there. For a great many people it became the more precarious thing: enough to be counted as not-poor, not enough to be safe.
How this number was made
What it measures. Working poverty rate — employed living in extreme poverty (<$2.15/day), World
The share of workers too poor to clear the line fell by three quarters — work became a way out, not a trap.
Most poor people already work; for them poverty is not about jobs but about what a job pays and how easily it vanishes.
Being counted just above the line is not the same as being secure — the figure hides how many sit one shock from falling back.
As poverty fell, did the gap between rich and poor close too?
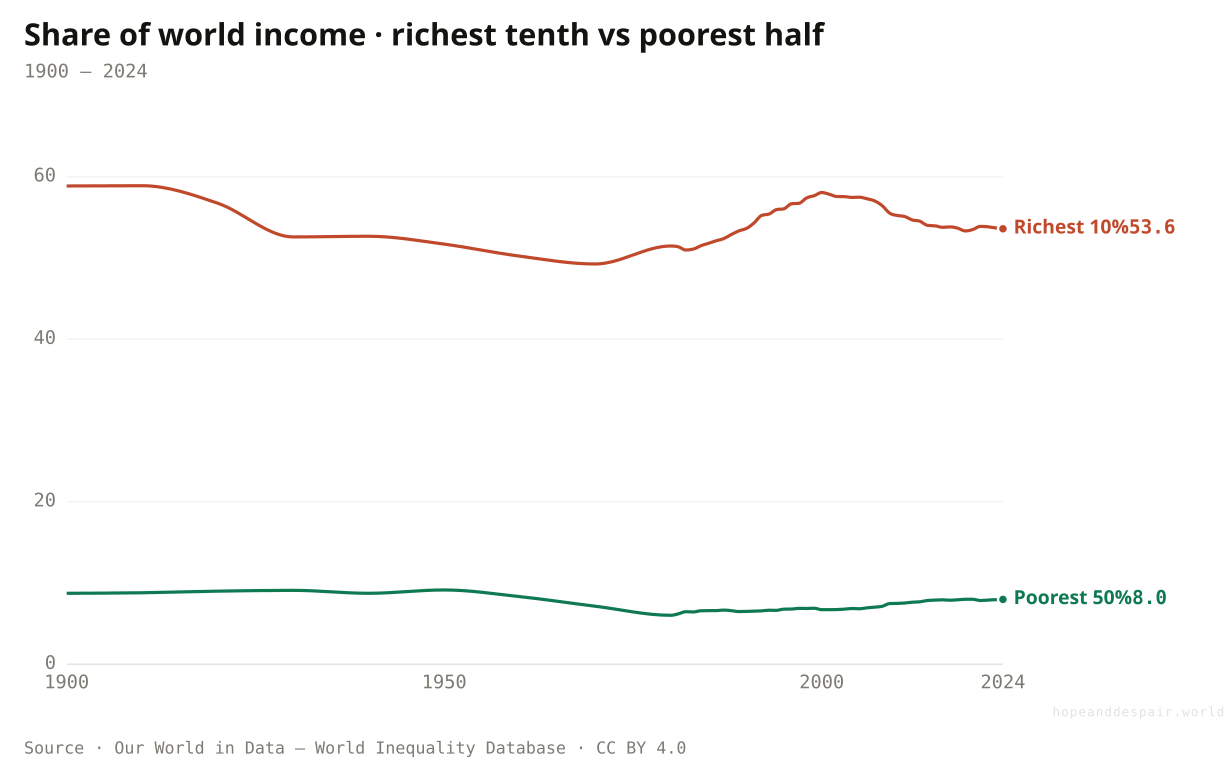
Between countries the gap narrowed; inside them it widened.
As Asia caught up to the West, the gap between nations shrank — and that convergence is the main reason global poverty fell at all. But look inside the world rather than between its countries and a different line appears. The share of all world income going to the poorest half of people is about 8 percent today, against more than half for the richest tenth, and the poorest half’s share has hardly climbed.
The long view sharpens it. In 1820 the bottom half of humanity took around 14 percent of world income; industrialisation cut their share as the West pulled away, and it has only partly recovered. So the poor of the world caught up to other countries faster than they caught up to the rich inside their own. Two true things, pointing opposite ways: the distance between nations is the smallest in a century, and the distance within them is wide and stubborn.
How this number was made
What it measures. The share of income received by the richest 10% of the population. Income here is measured before taxes and benefits.
Calculation. Selected entity World.
The displayed line is monotone-cubic smoothed for legibility only — it never moves a data point.
The gap between countries is the narrowest in a century — the poorest nations are catching up to the richest.
The poorest half of the world still receives about 8 percent of its income, a share that has barely moved.
Inequality between countries and within them move separately; falling global poverty hides a widening gap inside many societies.
How unequal are countries inside their own borders?
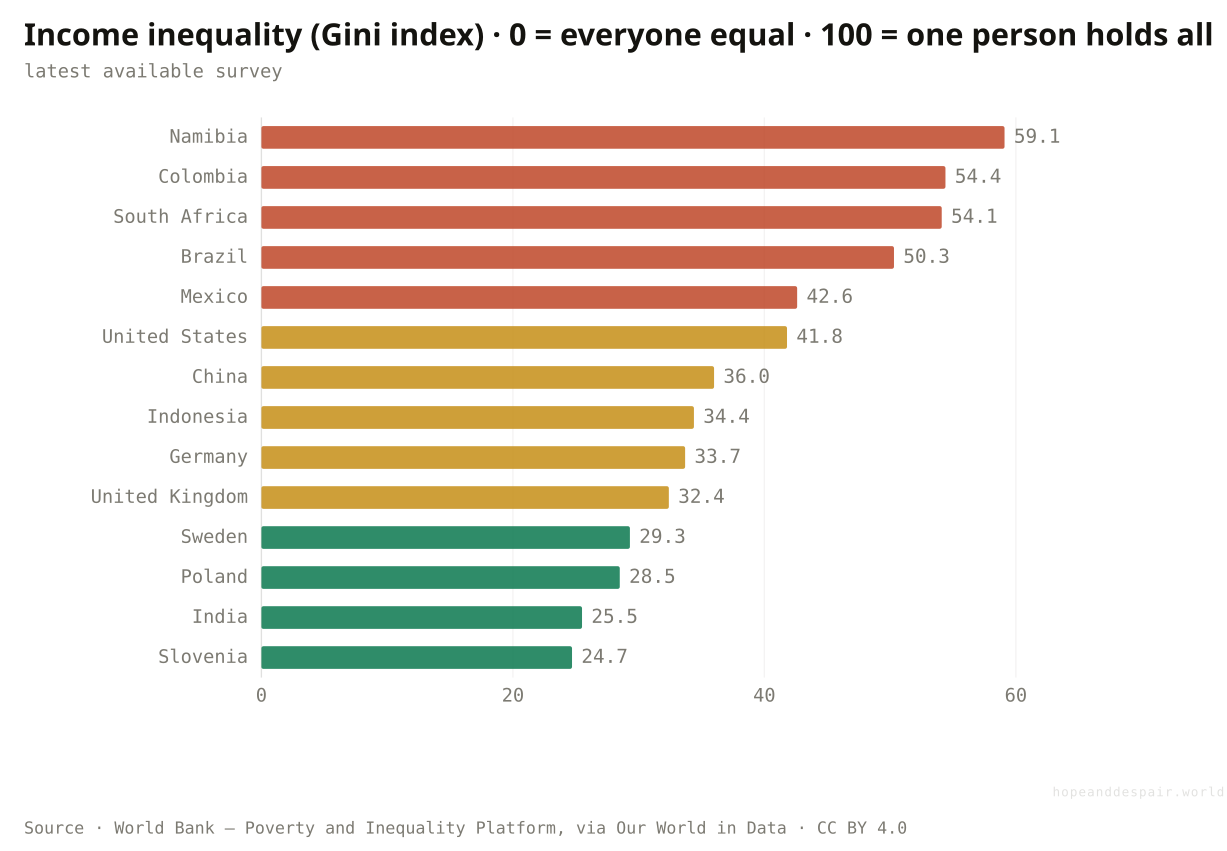
Some middle-income countries are far more unequal than either the rich world or the poorest.
The Gini index squeezes a whole income distribution into one number: zero if everyone holds an equal share, a hundred if one person holds it all. Ranked that way, the most unequal places are not the richest or the poorest but a particular band in between. Southern Africa and Latin America sit at the top — Namibia near 59, Colombia and South Africa in the low fifties, Brazil at 50 — levels where the distance between a country’s rich and poor is its own kind of poverty.
The surprises are in the order. The United States, at around 42, is markedly more unequal than Germany or the United Kingdom in the thirties, and far above Sweden near 29. India comes in low, around 26, which sounds like good news until you remember the previous charts: a country can spread a small pie evenly and still leave most of its people poor. So inequality and poverty are not the same problem. A place can be poor and equal, rich and unequal, or — as Southern Africa shows — carry deep inequality layered on top of deprivation, the hardest combination to shift.
How this number was made
What it measures. Gini index of income or consumption, latest available survey per country (2015–2025); rescaled ×100. A curated 14-country spread.
Calculation. Latest Gini survey per country, ×100, 14 curated countries sorted descending.
High inequality is not destiny — countries at similar income levels span the whole range, so policy clearly moves it.
In the most unequal countries the gap between rich and poor rivals anything in the historical record, and it barely shifts.
A low Gini can hide widespread poverty, and a high one can sit atop real prosperity — the number rates the spread, not the level.
Is the world still on track to end extreme poverty?
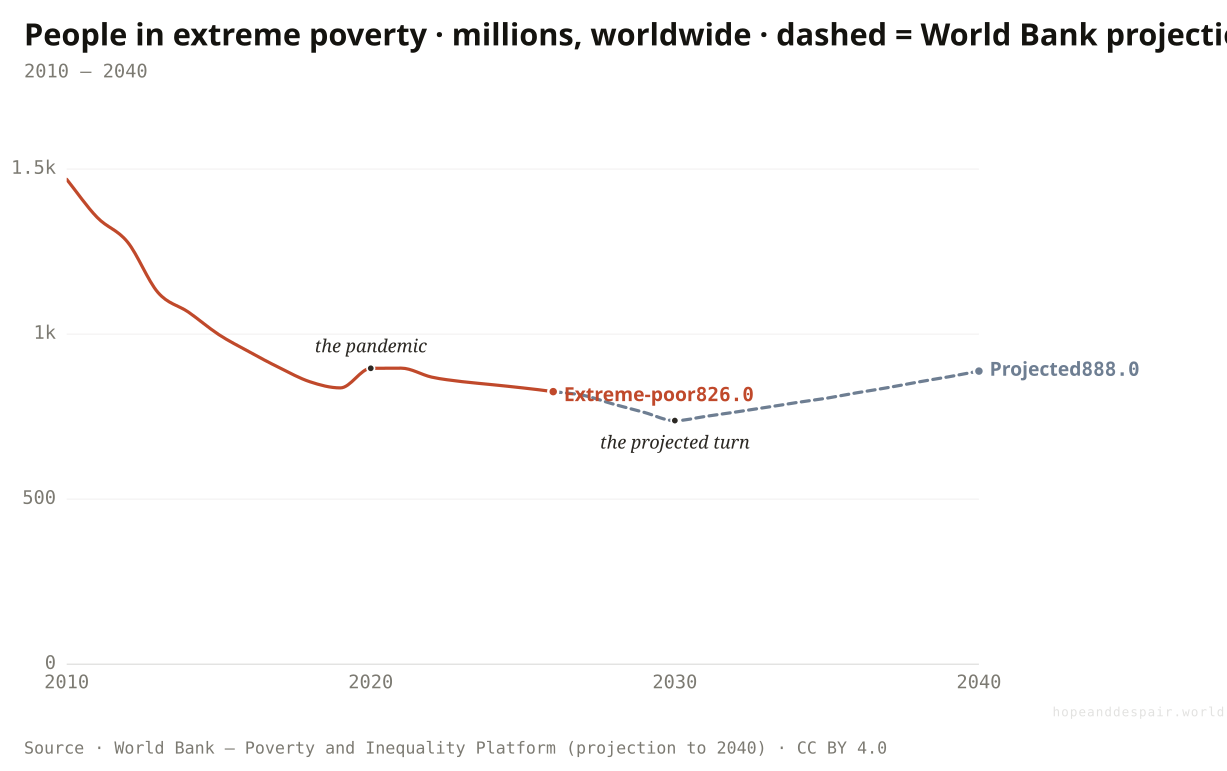
The fastest fall in the history of need ran out of speed.
For three decades the count of the extreme-poor fell at a pace with no precedent in the human record. Averaged across every year since 1990, about 115,000 people crossed out of extreme poverty each day; at the height of it, in the 2000s, the figure ran past 200,000. Then it levelled off. The number dropped from 1.47 billion in 2010 to 837 million in 2019, and there it more or less stopped, the pandemic nudging it back up in 2020. Since then the daily pace has collapsed to a few thousand, and by 2026 the count sits near 826 million, almost exactly where 2019 left it. The plunge of the earlier chapters became a plateau.
The goal the world signed up to — extreme poverty effectively gone by 2030 — will be missed: the Bank’s own projection has about 740 million people still below the line in 2030, the low point of the dashed path. Then the line turns back up. On the Bank’s numbers the count climbs toward 890 million by 2040, as the poor who remain concentrate in economies that are barely growing — the first sustained rise in extreme poverty since the 1980s, the long descent going into reverse. What is left is the hard core of the problem, dug into fragile and conflict-ridden states where ordinary growth has never reached and a survey often cannot go. Whether this flat stretch is the story’s ending or only a pause is genuinely unknown, which is the honest temperature of it. The recent points here are nowcasts: trust the shape of the line, not its last decimal.
How this number was made
What it measures. Number of people in extreme poverty (below $3.00/day, 2021 PPP), World
Even after the stall, the count sits near its lowest level ever — the long fall has not reversed, only paused.
Progress flattened after 2019, the 2030 goal is out of reach, and the Bank’s own projection has the count climbing again toward 890 million by 2040.
The reversal after 2030 is a projection, not a measurement — but so is much of the recent line; these are model estimates, not counts.
Poverty was never one number. It is a line someone draws, and a place someone is born.— Progress and catastrophe coexist
One question, read by the fields that actually study it. Each voice is given both its most hopeful and its darkest honest reading — with a note on how settled the evidence underneath is.
the hopeful readGrowth in Asia did what no aid programme could — it carried a billion people over the line.
the darker readGrowth has stopped reaching the poorest, and Africa’s count of the poor is still climbing.
the hopeful readBy every absolute line, the share of the poor has fallen for forty straight years.
the darker readThe line is a choice and the surveys miss the rich, so the real distance is wider than the numbers admit.
the hopeful readFalling birth rates across Asia turned a falling rate into a falling number.
the darker readAfrica’s population is still outgrowing its incomes, so its number of poor keeps rising even as its rate dips.
the darker readA world rate of one-in-ten means nothing in a village where it is still one-in-two and no surveyor has come in years.
the hopeful readThe material floor — water, power, sanitation — rose almost everywhere, even where wages did not.
the darker readA quarter of the world is still poor next to its own neighbours, and growth does not close that gap.
Strongest case for hope
The long view is the real story. In two centuries the normal human condition flipped from almost everyone poor to most people not, and in a single recent generation roughly a billion people crossed out of extreme poverty — the fastest such fall ever measured. The forces behind it, broad-based growth and rising productivity, have not vanished, and the non-money floor of water, power and sanitation is still rising. A stalled decade does not undo a transformed century.
Strongest case for despair
The fall has stalled near a tenth of the world, the 2030 goal of ending extreme poverty will be missed, and the remaining poverty has concentrated into Africa and fragile states where growth has never reached. Africa’s count of the poor is still rising. By the higher lines most countries actually use, half of humanity is still poor and that number has scarcely fallen in forty years.
A decade of sub-Saharan African incomes growing faster than its population, pulling the regional poverty count down rather than up, would strengthen the hope case decisively. A second consecutive decade with the global extreme-poverty count flat or rising — growth failing to resume in the poorest places — would confirm the despair reading that the great escape is over.
Everything done to the numbers between the source and the chart, disclosed in full. Where a choice is editorial rather than measured, we say so.
- Every figure is real
- Every chart runs on data ingested through our open pipeline, with downloadable source, data package, and lineage under each. The only hand-made element is the evidence panel at the top — the long-run hero curve and the four signal sparklines — a composited orientation graphic, flagged as such.
- Counts come straight from the source
- The number-of-poor charts are the World Bank’s own Poverty and Inequality Platform figures (its
pop_in_povertyfield), not a rate multiplied by a population. Where the Bank publishes the count, we publish the count. - The line and the price base
- Each poverty figure carries its line ($3.00, $4.20, $8.30 a day) and its purchasing-power base (2021 PPP). Lines from different price bases are never drawn on one axis — a $2.15 point beside a $3.00 point would be a unit error, not a trend.
- The $30-a-day line
- The top rung of the ladder chart is not a World Bank line. The first three ($3.00 / $4.20 / $8.30) are the Bank’s low-, lower-middle-, and upper-middle-income lines; $30 is the order of magnitude a wealthy country like the UK uses for its own citizens, re-expressed in the same 2021 PPP and applied to the whole world — Max Roser’s thought experiment for what global poverty looks like judged by rich-world standards. The share below it is pulled live from the World Bank PIP at the $30 line, not borrowed from a different price base.
- Nowcasts, marked as such
- Years after a country’s last survey are model nowcasts, not counts, and most recent global points lean on them. The line’s shape is trustworthy; its final decimals are projection, and the prose says so wherever it leans on them.
- Consumption vs income
- Poor countries usually measure poverty by consumption, richer ones by income; the two are not strictly comparable, which slightly biases cross-region and relative-poverty comparisons. We report each series as its source measures it.
- Re-host vs. link-only
- We re-host only openly-licensed data (CC BY / CC0). The World Bank PIP and WDI, the World Inequality Database (via OWID), the ILO, the WHO/UNICEF water programme, and Maddison all qualify; restricted sources would be cited and linked instead.
- The verdict
- Each signal is classed improving or worsening by the sign of its change across the visible window. The headline verdict is an editorial reading of those signals — deliberately not a single computed index.
- World Bank — Poverty and Inequality Platform (PIP) — pip.worldbank.org ↗ · CC BY 4.0 · vintage 2026-06Counts, rates, mean income, and relative poverty by world region, 1981–2026 (2021 PPP).
- World Bank — World Development Indicators — data.worldbank.org ↗ · CC BY 4.0 · vintage 2026-06Regional extreme-poverty rates and basic-services access.
- World Inequality Database (WID) — wid.world ↗ · CC BY 4.0 (via OWID) · vintage 2026Income shares of the top 10% and bottom 50%, worldwide.
- Maddison Project Database — www.rug.nl/ggdc/historicaldevelopment/maddison ↗ · CC BY 4.0 (via OWID) · vintage 2026World GDP per person in the long run, from 1820.
- International Labour Organization (ILOSTAT) — ilostat.ilo.org ↗ · CC BY 4.0 · vintage 2026Working poverty — workers below the extreme line.
- WHO/UNICEF Joint Monitoring Programme — washdata.org ↗ · CC BY 4.0 (via the World Bank) · vintage 2026Access to safe drinking water, sanitation, and electricity.
- Our World in Data — Poverty — ourworldindata.org/poverty ↗ · CC BY 4.0 · vintage 2026-06Keystone aggregator and documentation for the poverty and inequality series.
- Our World in Data — Extreme poverty in brief (Max Roser) — ourworldindata.org/extreme-poverty-in-brief ↗ · link-only · vintage 2026The $30-a-day thought experiment: apply the poverty line rich countries use for themselves to the world, and roughly four in five people fall below it.
- Our World in Data — “$3 a day: a new poverty line — what changed, and why?” — ourworldindata.org/new-international-poverty-line-3-dollars-per-day ↗ · link-only · vintage 2026The World Bank’s 2025 rebasing to 2021 PPP — why the lines moved to $3.00 / $4.20 / $8.30 and the rich-country line stays near $30; grounds the “line is a price, not a fact” caveat.
- Our World in Data — Projections of extreme poverty (World Bank) — ourworldindata.org/grapher/projections-extreme-poverty-wb ↗ · CC BY 4.0 · vintage 2026World Bank projection of the extreme-poor count to 2030 (~740 million still below $3.00/day) — the dashed line in the “still on track?” chart.
- Our World in Data — “The end of progress against extreme poverty?” (Max Roser) — ourworldindata.org/end-progress-extreme-poverty ↗ · link-only · vintage 2026Roser’s 2026 essay: about 115,000 people left extreme poverty each day since 1990, but the poorest now live in economies that have not grown, so on current trends progress halts and reverses after 2030. Grounds the pace figure and the post-2030 reversal in the “still on track?” movement.
Cite this page
Reference
Hope & Despair. “Is the world winning against poverty?.” Hope & Despair, 2026. https://hopeanddespair.world/questions/is-the-world-winning-against-poverty.
BibTeX
@misc{hopeanddespair:is-the-world-winning-against-poverty,
  author       = {{Hope & Despair}},
  title        = {{Is the world winning against poverty?}},
  year         = {2026},
  howpublished = {\url{https://hopeanddespair.world/questions/is-the-world-winning-against-poverty}},
  note         = {hopeanddespair.world, updated 2026-06-14}
}
Original prose, code, and chart designs are released under CC BY 4.0 ↗ — reuse freely with attribution. Source datasets keep their own licences, listed above. Add your access date when citing.
- Mobile-first chart system + redesign branch snapshot View diff →
Generated from the commit history — every edit to a number, a word, or a chart is tracked in the open. Browse the full history & diffs on GitHub →
in plain words
Still lost? Read this.
Here is the whole argument in one breath. Two hundred years ago almost every human being on earth was poor — living on the equivalent of about three dollars a day, the same line we now use to mark destitution. Today most people are not. Somewhere around a billion of them crossed out of extreme poverty in just the last generation, mostly because Asia grew. That is real, and it is the largest improvement in material life the species has ever recorded.
But hold two facts next to it. First, the number you hear depends on a line a committee chose: at three dollars a day a tenth of the world is poor, and at the line many middle-income countries actually use, it is half. Second, the fall has stalled. Since about 2019 the count of the extreme-poor has stopped dropping, and in Sub-Saharan Africa it is rising — the world’s poverty has drained out of Asia and pooled into Africa and the fragile states, the places ordinary growth has never reached.
So the honest answer is both, and the seam between them is the whole point. Across two centuries, we are winning against poverty by a margin our ancestors could not have imagined. Across the last decade, the winning slowed to a crawl, and whether it resumes is genuinely unknown. The one thing you can say at dinner and be right: ask how many people are poor, and the truest first answer is a question back — poor by which line, and in which year, and where?