Question 09 · Knowledge
Who shapes science now?
Science is no longer a small Western archive. It is a ten-million-work-a-year machine, increasingly open, increasingly Asian, increasingly collaborative, and still brutally unequal in who gets seen.
The lazy story is that science publishes more papers every year. True, but thin. OpenAlex lets us ask the better question: who is connected to the graph of knowledge, where are they, what fields dominate, what is open, and who gets attention?
A word on where these numbers come from. OpenAlex is a free, open catalogue of the world’s scholarly record, run by the non-profit OurResearch and placed in the public domain. It was built as an open answer to the paywalled indexes that long decided who counted as part of the literature, such as Web of Science and Scopus. It now links hundreds of millions of works to their authors, institutions, countries, fields, and citations. That openness is the whole reason a page like this one can rebuild the map directly, instead of trusting a commercial gatekeeper. It also casts a wider net than the old indexes, so its counts run higher and should not be read as the same thing as journal-only statistics.
Read that way, the answer is not one mood. The hopeful version is real: knowledge is more open, less Western, and more collaborative than it was in 2000. The despairing version is also real: visibility still concentrates around rich institutions, old prestige systems, and fields with money, labs, English, and citation machinery behind them.
you read
- OpenAlex counts scholarly works, not only journal articles. Its graph includes articles, books, proceedings, preprints, repositories, and other research objects where metadata exists. That breadth is the point, but it is broader than older journal-article statistics.
- Country counts are country-attributed, not nationally exclusive. A paper with authors in China and Germany can count for both. That is correct for collaboration, but it means country bars are not slices of one pie.
- Citations are an influence proxy, not a truth meter. Citation-normalized top-10% status is useful because it adjusts for field and year, but citations still follow language, prestige, network, and topic fashions, and some national literatures cite heavily within themselves.
- OpenAlex sees the indexed world, not all of science. Like every large bibliographic database, it covers English-language and DOI-bearing work best, and it under-counts local-language journals, books, and scholarship outside the main indexing pipelines. The whole graph is the visible part of science, not its full extent.
- A work count measures visibility, not value. Appearing in the graph is not the same as being correct, replicated, useful, or even read. Output rises through genuine discovery, but also through pressure to publish and through predatory journals, which inflate some countries and fields more than others.
- The data shows participation, not power. OpenAlex is strong on who appears, where, and in what field. It is weak on who paid, who led, whose question it was, and who holds first and corresponding authorship. The article’s central tension, participation versus control, lives largely in what this data cannot see.
- Everything OpenAlex-derived here is snapshotted through the official API under CC0. The article uses grouped aggregates, not live requests at page load.
How large is the visible research system?
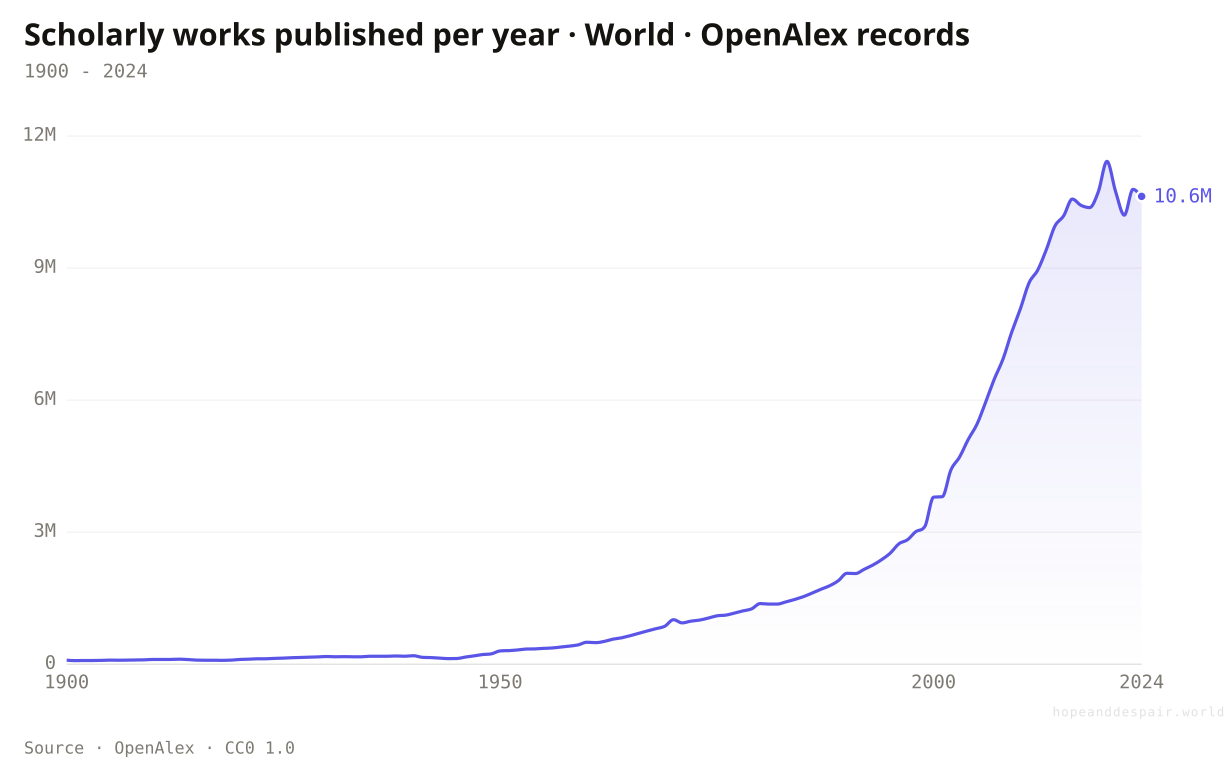
OpenAlex records about 10.6 million scholarly works published in 2024, up from under 100,000 in 1900.
Start with the scale, because it changes the meaning of every other chart. In 1900, OpenAlex records about 92,000 scholarly works. By 2000 it records 3.8 million. By 2024, 10.6 million. The line is not a clean climb to the present. It peaks near 11.4 million around 2020, then dips, but that dip is mostly a counting effect: the newest years are still being indexed. A real slowdown and a simple lag look the same for now. Some of the long-run rise is better indexing too. The broad fact survives all of it: science became an industrial-scale human activity.
That is hopeful if your problem needs more eyes, instruments, languages, and local knowledge. It is terrifying if your problem is judgment. The scarce resource is no longer a place to publish. It is attention, synthesis, replication, and knowing which claims actually changed the map.
How this number was made
What it measures. Scholarly works published per year, World
More people, institutions, and fields can now contribute to the formal record of knowledge.
A literature this large can bury signal under output, incentives, and unreadable abundance.
The count mixes real growth with better indexing, and the post-2020 years are still filling in, so recent dips may be lag, not decline.
Where is new science being produced now?
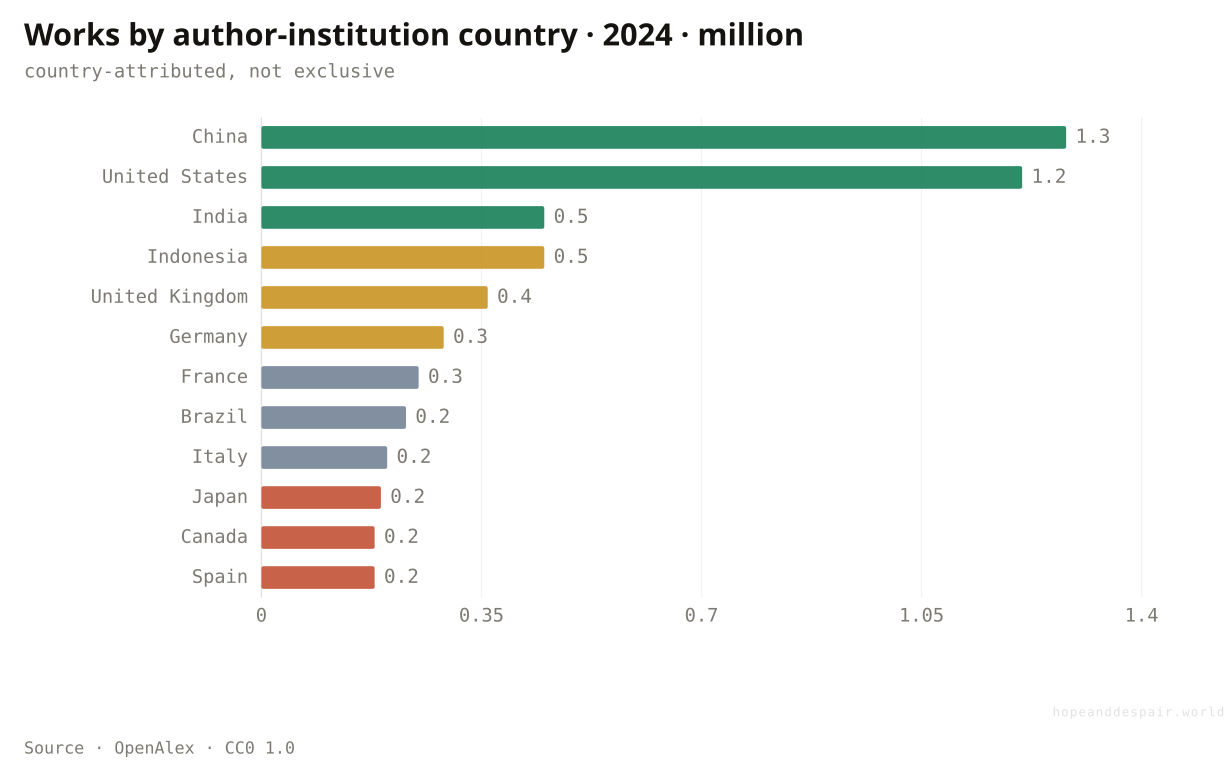
In 2024, China and the United States are nearly tied in OpenAlex country-attributed works.
This is the first big map change. In OpenAlex’s 2024 country grouping, China appears on about 1.28 million works and the United States on about 1.21 million. India and Indonesia follow at about 450,000 each, with the United Kingdom, Germany, France, Brazil, Italy, Japan, Canada, and Spain behind them.
Do not read this as a quality ranking. It is a presence ranking. Large countries, large university systems, publication incentives, and collaboration all matter. But presence matters. The old mental picture of science as a North Atlantic archive with everyone else reading along is obsolete.
How this number was made
What it measures. Works published in 2024, grouped by countries attached to authorship institutions. A multi-country paper can count once for each country represented.
Calculation. Group 2024 works by author institution country; show the top 12 in millions.
The production of formal knowledge is no longer monopolized by old Western research powers.
Raw output rewards scale, incentives, and indexing; it does not tell us whose work shapes the field.
A collaborative paper counts for every represented country, so the bars show footprint, not ownership.
How fast did the map move?
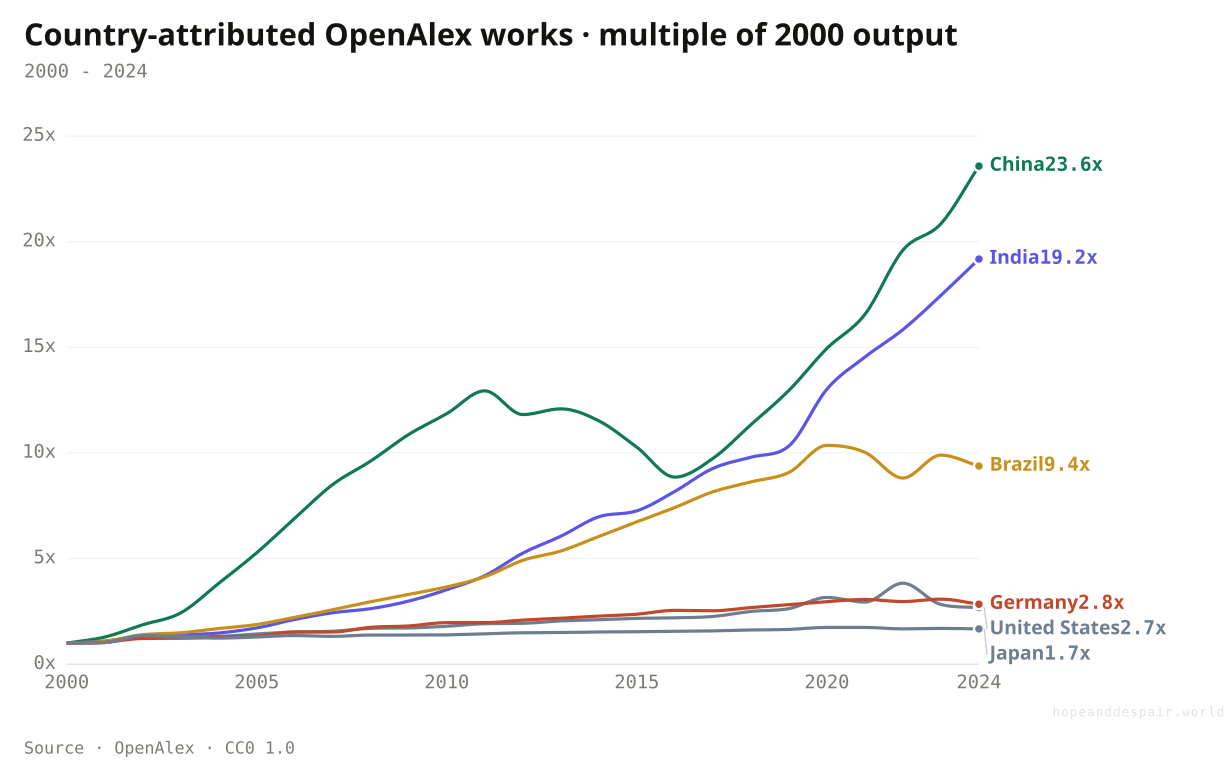
China’s country-attributed OpenAlex output rose about 23.6x from 2000 to 2024; India’s rose about 19.2x.
The 2024 bar is a snapshot. This is the motion behind it. Put each country’s OpenAlex footprint on a 2000 = 1x scale and the shift becomes obvious: China reaches about 23.6x by 2024, India 19.2x, and Brazil 9.4x. The United States, Germany, and Japan remain large research systems, but their visible output grew much more slowly from already large bases.
This is why the map feels different. The United States did not vanish; it grew. But China and India grew much faster, enough to change the center of gravity of the visible research system inside one generation.
How this number was made
What it measures. China country-attributed OpenAlex works as a multiple of its 2000 value.
Calculation. Divided China yearly country-attributed work count by its 2000 value.
The displayed line is monotone-cubic smoothed for legibility only — it never moves a data point.
A much larger share of humanity now has institutions visible in the formal research graph.
Growth multiples can make smaller bases look explosive; they say nothing by themselves about influence or quality.
This is country footprint, not exclusive national production; collaborations lift more than one line.
Who gained share of the whole graph?
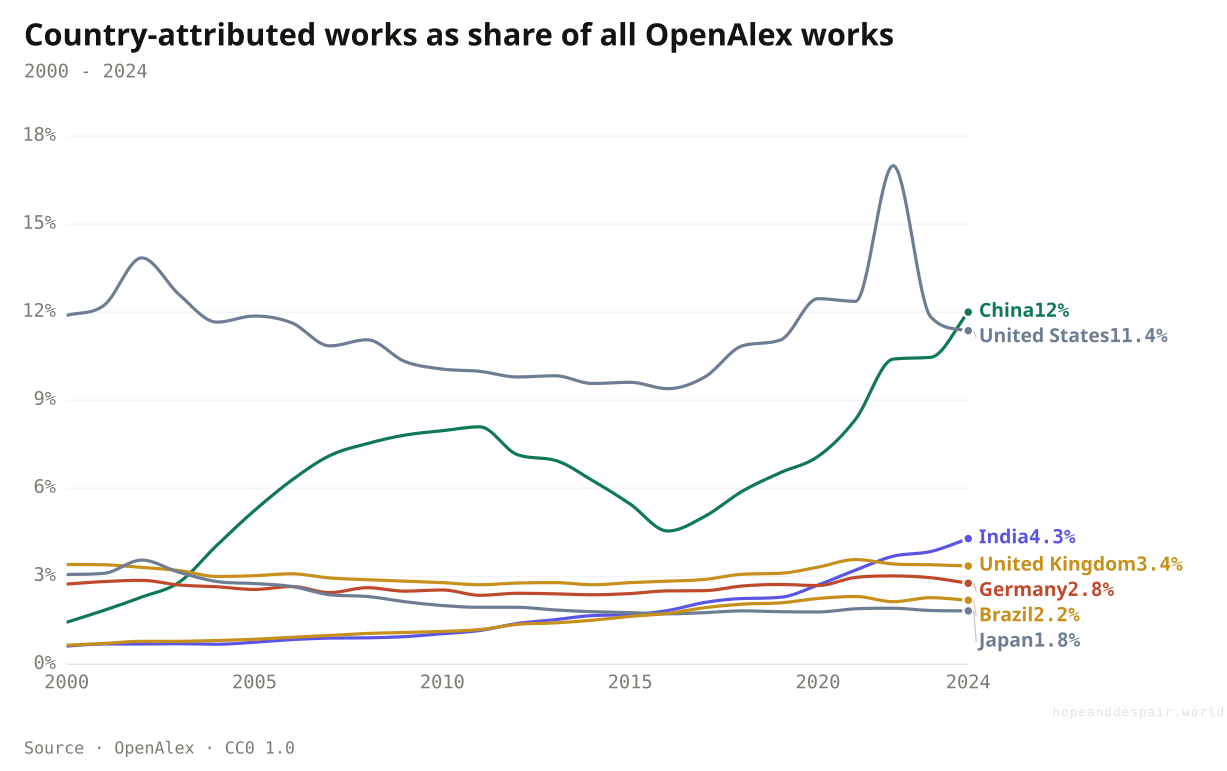
China’s share of all OpenAlex works rose from about 1.4% in 2000 to 12.0% in 2024.
The share chart asks a stricter question than the multiple: not just who grew, but who grew faster than the whole research system. China rises from about 1.4 percent of OpenAlex works in 2000 to about 12.0 percent in 2024. India rises from about 0.6 percent to 4.3 percent. Brazil rises from about 0.7 percent to 2.2 percent. The United States remains huge, the United Kingdom and Germany are roughly stable, and Japan’s share falls as the rest of the system grows around it.
This is the better chart for 'who gained ground.' The story is not American collapse. It is the end of an old monopoly.
How this number was made
What it measures. China country-attributed works as a share of all OpenAlex works in the same publication year.
Calculation. Divided China yearly country-attributed work count by all OpenAlex works in the same year.
The displayed line is monotone-cubic smoothed for legibility only — it never moves a data point.
The formal record of science is less concentrated in one old center than it was in 2000.
A larger share of works is not the same as a larger share of funding, prestige, or agenda-setting power.
Fast-rising shares can reflect real capacity, indexing changes, publication incentives, or all three.
How did the field mix change?
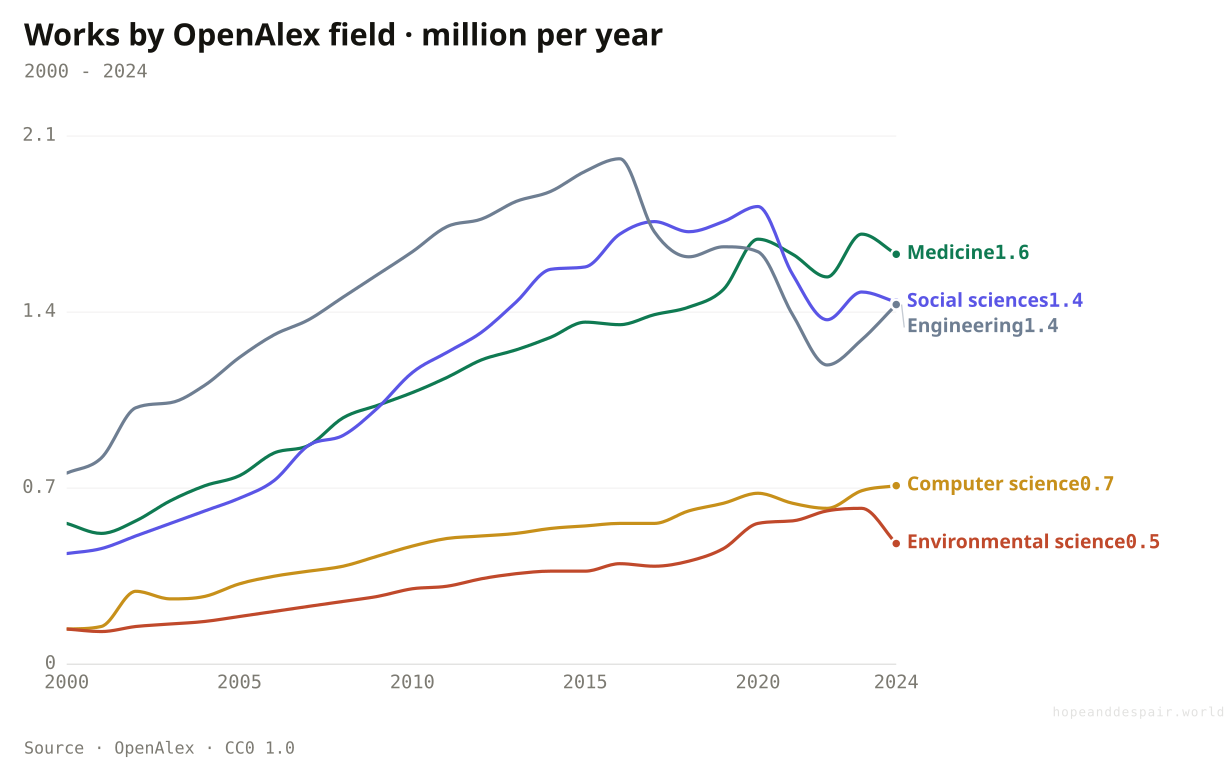
Medicine remains the largest selected field, but computer science grew fastest: about fivefold since 2000.
A 2024 field ranking tells us what is large now. The time series tells us what changed. Medicine grows from about 0.56 million works in 2000 to 1.63 million in 2024. Social sciences rise from 0.44 million to 1.44 million. Engineering starts high and grows more slowly, from 0.76 million to 1.43 million. Computer science rises from 0.14 million to 0.71 million.
That shape is the modern research agenda in motion: health remains enormous; society and environment expand; computing becomes a general-purpose research language rather than one field among others.
How this number was made
What it measures. OpenAlex works per year whose primary topic field is Medicine.
Calculation. Filtered works to primary topic field Medicine, grouped by publication year, 2000-2024, shown in millions.
The displayed line is monotone-cubic smoothed for legibility only — it never moves a data point.
The system is broad enough to work on disease, engineering, environment, society, culture, and computation at once.
Fields with money, institutions, and publication volume can dominate the visible archive and the public imagination.
Field labels simplify messy interdisciplinary work; the same paper can belong intellectually to more than one frontier.
Which fields accelerated most?
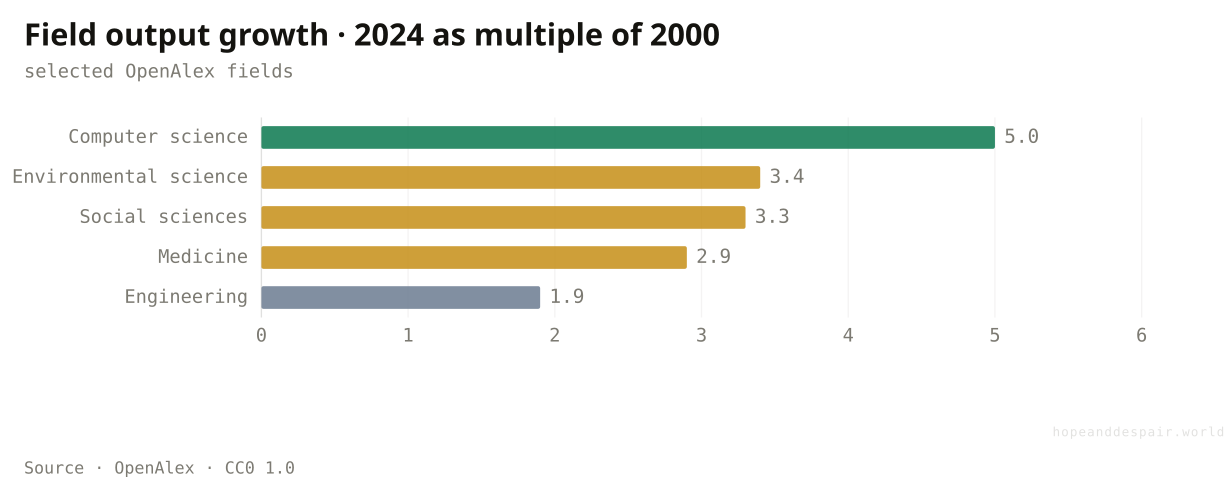
Among these large fields, computer science output is about five times its 2000 level.
Normalize each field to its own 2000 level and the hierarchy changes. Computer science is the clear accelerator, roughly five times its 2000 output by 2024. Environmental science and social sciences more than triple. Medicine almost triples. Engineering, already large in 2000, roughly doubles.
This is why the field story needs a transformation. Raw counts tell you what is biggest. Indexed growth tells you what is changing fastest.
How this number was made
What it measures. Selected OpenAlex fields, with 2024 output divided by 2000 output.
Calculation. Computed 2024/2000 output multiple for selected large fields.
New fields and cross-cutting tools can scale quickly through the research system.
Acceleration can reflect publication incentives and hype as much as genuine discovery.
A fast-growing field may still be smaller than a slower-growing field; growth and size answer different questions.
How much of new research is free to read?
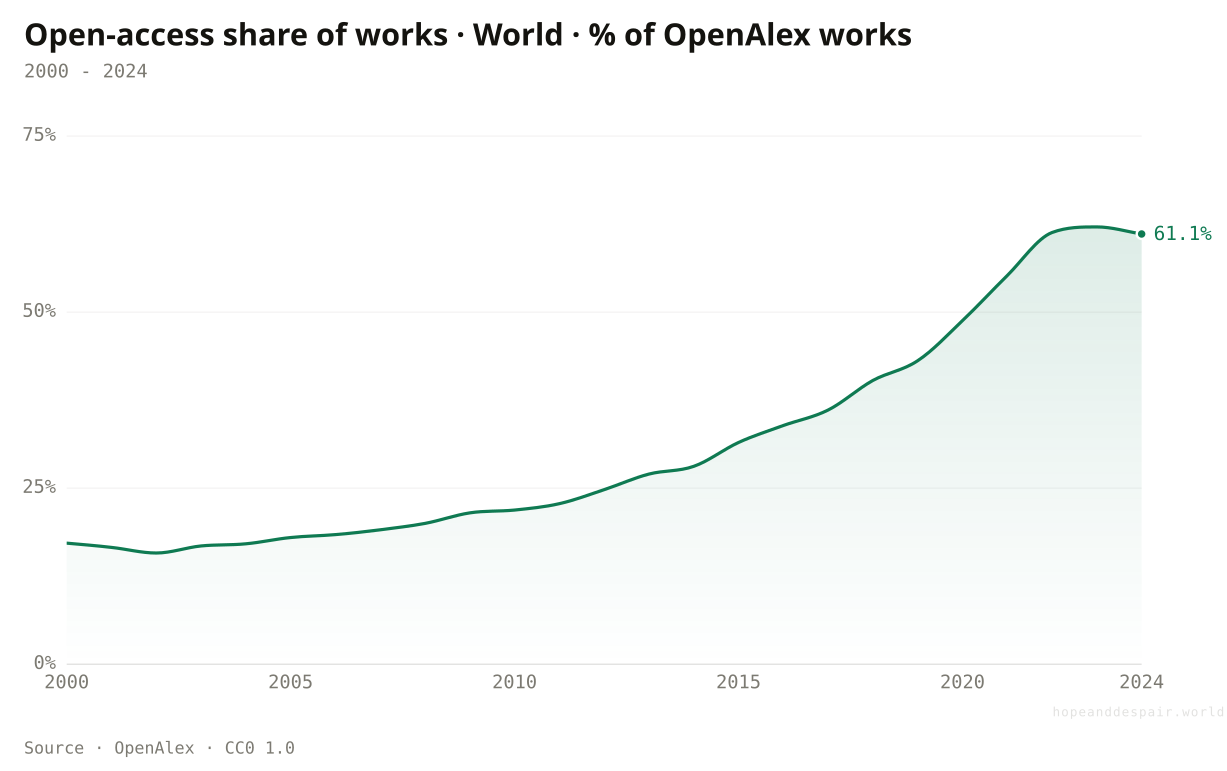
Open access climbed from about 17% of works in 2000 to about 61% in 2024.
Counting works is one thing. Counting which ones a stranger can actually open is another. In 2000, about 17 percent of that year’s works were open access. The share barely moved for a decade, sitting in the low twenties through the late 2000s. Then it turned sharply upward: about 32 percent by 2015, about 49 percent by 2020, and about 61 percent by 2024.
The bend is not an accident. Through the 2010s preprint servers spread beyond physics, research funders began requiring open deposit, and national policies such as Europe’s Plan S pushed public research toward open journals. The result is a quiet inversion. For most of the modern record, reading the frontier meant paying for it. Now, for the first time, most new work is open by default.
How this number was made
What it measures. Share of OpenAlex works marked open access, by publication year.
Calculation. Divided yearly open-access works (is_oa:true) by all works in the same publication year.
The displayed line is monotone-cubic smoothed for legibility only — it never moves a data point.
Most new research is now reachable by anyone with a connection, not only by people inside subscribing institutions.
Open to read is still not open to understand, reproduce, or build on, and some open access is paid for by author fees that exclude poorer labs.
OpenAlex’s open-access flag mixes gold, green, hybrid, and bronze routes, which differ in how durable and reusable the access really is.
What kind of open is it?
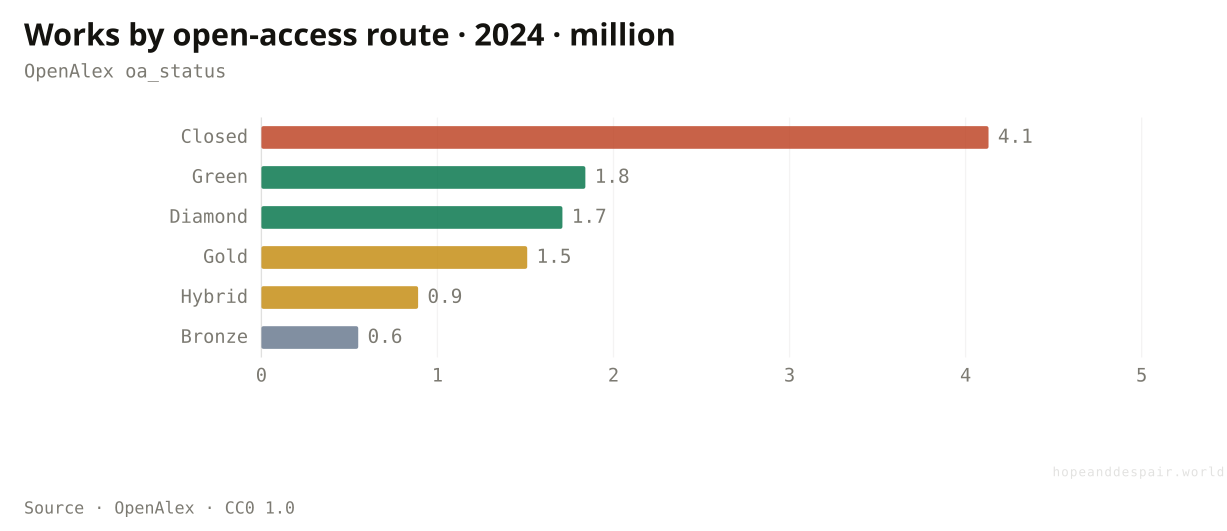
About 39% of 2024 works are still paywalled; the open majority is spread across five different routes.
Open access is not one thing. OpenAlex sorts each work into a route. In 2024 about 39 percent are closed, behind a paywall. The rest are open in five different ways. The largest open routes are green, where an author self-archives a copy, and diamond, where the journal is open and charges the author nothing. Gold journals are open but usually charge a publication fee. Hybrid and bronze are open articles sitting inside otherwise paywalled venues, and bronze in particular can be switched off at a publisher’s discretion.
The split matters for the despair reading. Diamond and green cost a reader nothing and an author little, so they widen access without a wallet test. Gold and hybrid shift the cost from readers to authors, which can move the barrier from rich libraries to funded labs. So more open is real, but how durable and how fair that openness is depends on which route is growing.
How this number was made
What it measures. Works published in 2024 by open-access route. Diamond and gold are open journals (diamond charges no author fee); green is self-archived; hybrid and bronze are open articles in otherwise paywalled venues; closed is paywalled.
Calculation. Group 2024 works by open-access route (open_access.oa_status); show counts in millions.
Most of the literature is now open in some form, and the no-fee routes, diamond and green, are a large part of it.
Author-paid routes can move the barrier from readers to researchers, favouring funded labs over poorer ones.
Route labels come from metadata and licences that change over time, and bronze access can be withdrawn.
Where is research most open to read?
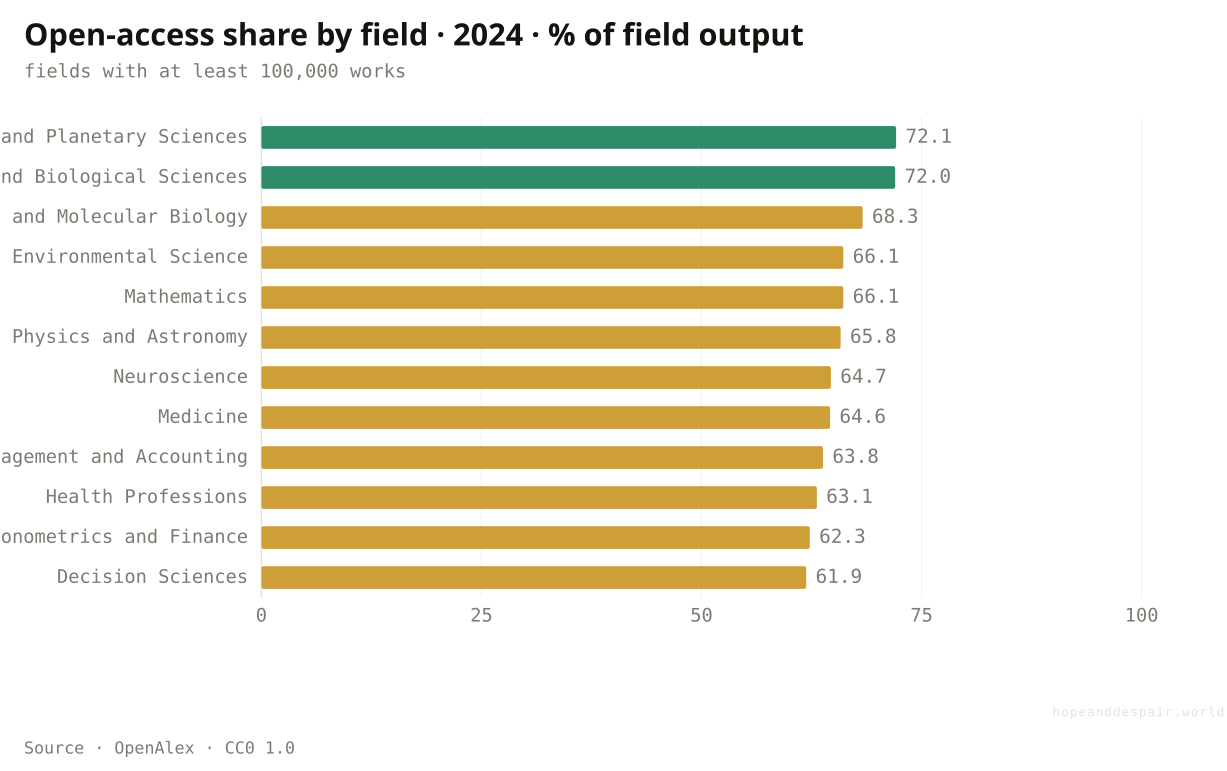
In large fields, open-access shares now commonly sit above 60%.
The access story is more interesting by field than in total. In 2024, large OpenAlex fields such as earth and planetary sciences, agricultural and biological sciences, biochemistry, environmental science, mathematics, physics, neuroscience, and medicine all sit around the low-to-high sixties or low seventies in open-access share.
That is a real change in the social contract of science. It means a student, patient advocate, engineer, journalist, or small-city researcher can often reach the paper without a subscription wall. It does not make the paper understandable, trustworthy, translated, or reusable. But the locked door is opening.
How this number was made
What it measures. Open-access share of 2024 works by OpenAlex primary topic field. Only fields with at least 100,000 works are shown.
Calculation. Divide open-access 2024 field counts by total 2024 field counts; show fields with at least 100,000 works.
The frontier is less locked away than it used to be; access is becoming normal in many major fields.
Open to read is not open to understand, reproduce, translate, or build on.
Open-access metadata is imperfect, and fields differ in preprint, repository, and journal culture.
Where does the visible record actually live?
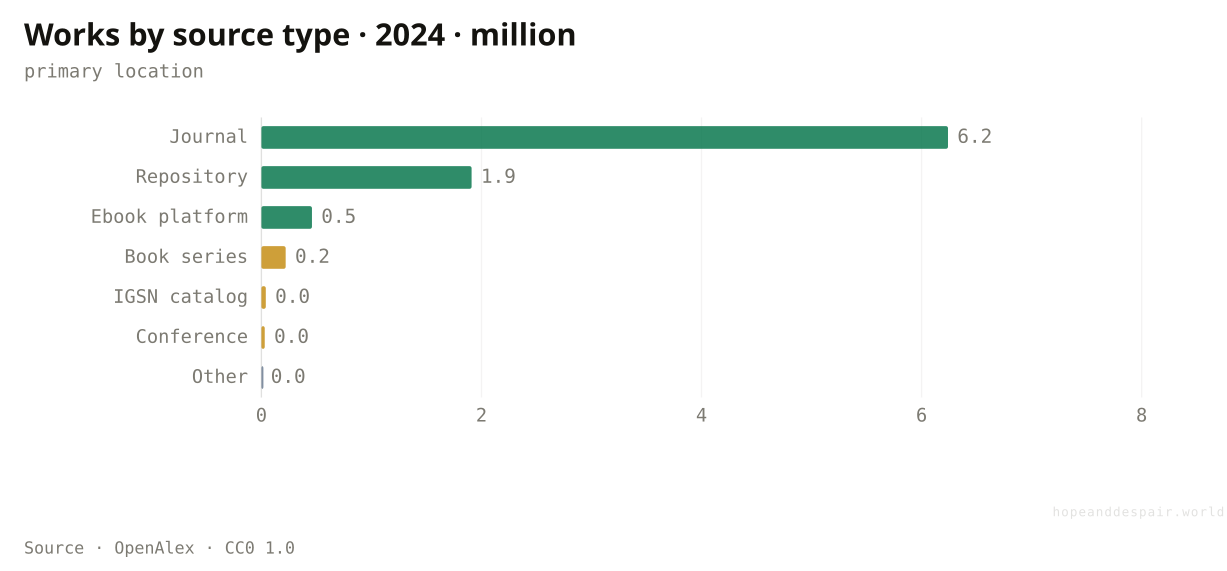
Journals still hold most works, but repositories now carry nearly a fifth of the annual record.
A work has to live somewhere, and that somewhere is changing. In 2024, journals are still the main home of the record, with about 6.2 million works. But repositories, the open archives where authors deposit preprints and accepted manuscripts, now carry about 1.9 million, close to a fifth of the year’s total. Ebook platforms, book series, and a long tail of conferences and data catalogues make up the rest.
This is the plumbing behind the openness story. The rise of repositories is much of what green open access means in practice, and preprint servers are why some fields now circulate findings months before formal publication. It also stretches what counts as the literature, because a deposited manuscript and a peer-reviewed article both appear in the graph, even though they have passed through very different amounts of checking.
How this number was made
What it measures. Works published in 2024, grouped by the source type of their primary location in OpenAlex.
Calculation. Group 2024 works by primary location source type; show counts in millions.
Open repositories and preprints now carry a large slice of the record, speeding how findings spread.
Mixing checked and unchecked work in one graph makes it easier to mistake a draft for a settled result.
Source-type metadata is coarse, and the same work can exist as both a preprint and a journal article.
Is science becoming more international?
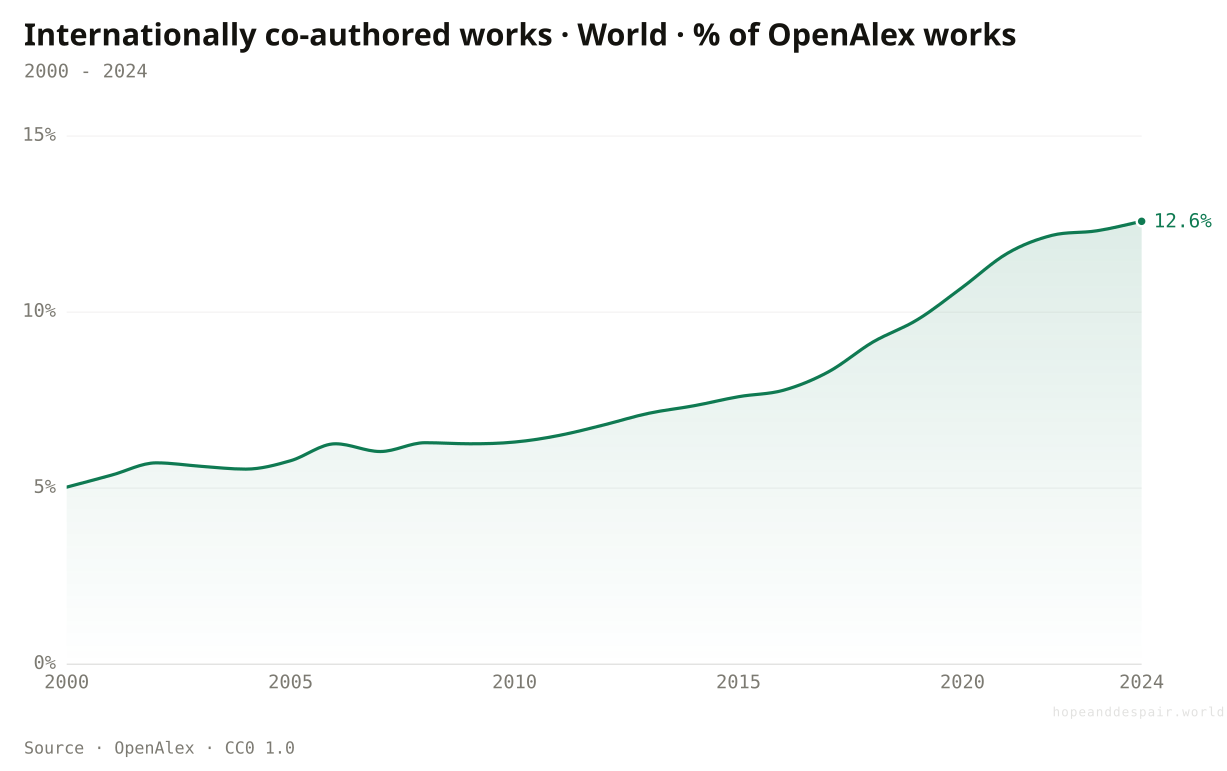
The share of works with institutions in more than one country rose from about 5.0% in 2000 to 12.6% in 2024.
The graph is knitting together. In 2000, only about one in twenty OpenAlex works had authorship institutions from more than one country. By 2024 it is about one in eight. That is not a majority. Most research is still nationally contained. But the direction is clear.
International collaboration is not automatically virtuous. It can reproduce hierarchy, with rich-country labs setting agendas and poorer-country partners supplying sites, samples, or local access. But it also means problems can be attacked at the scale they actually exist: pandemics, climate, food systems, migration, oceans, and AI are not domestic objects.
How this number was made
What it measures. Share of OpenAlex works with authorship institutions in more than one country.
Calculation. Divided yearly works with countries_distinct_count > 1 by all yearly works, 2000-2024.
The displayed line is monotone-cubic smoothed for legibility only — it never moves a data point.
More of science is now made across borders, which fits the scale of the problems science is asked to solve.
Collaboration can still be unequal: one institution writes the agenda while another supplies the terrain.
Country counts depend on institutional metadata, so unaffiliated or poorly parsed works are easier to miss.
Is the Global South entering the visible graph?
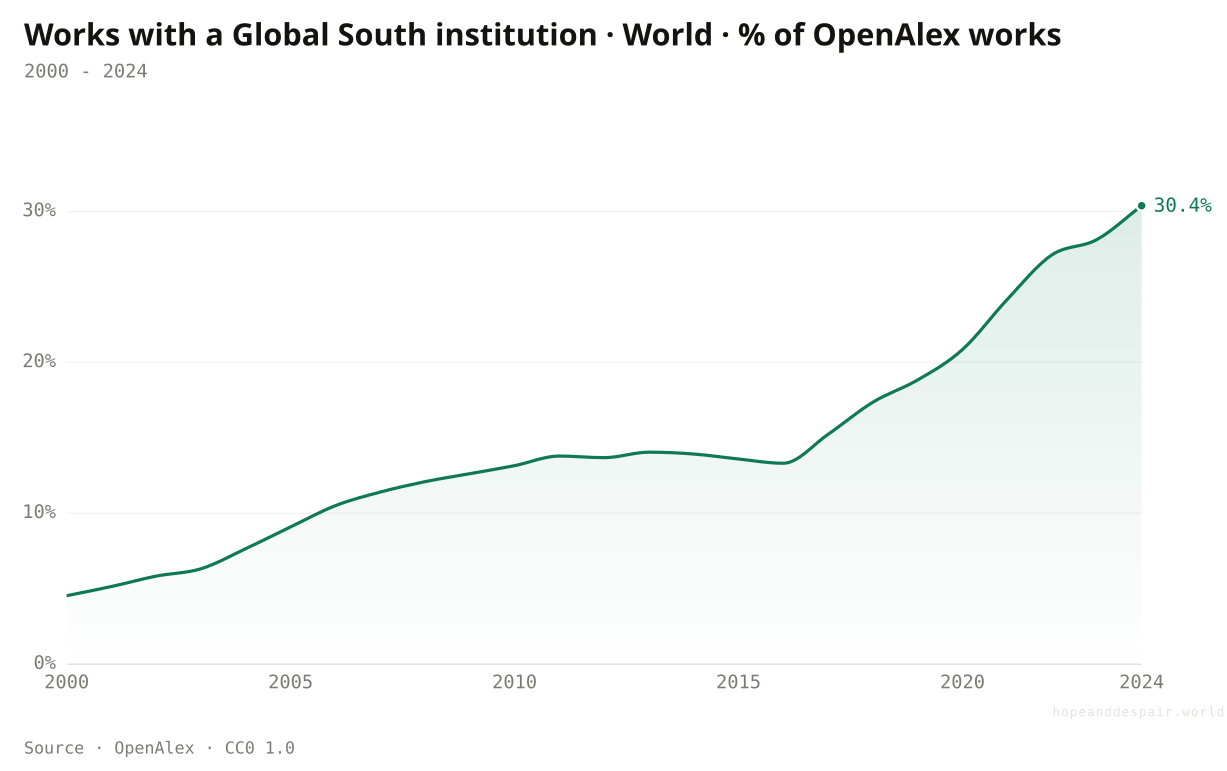
The share of works with a Global South institution rose from about 4.5% in 2000 to 30.4% in 2024.
This is the most hopeful line in the piece. OpenAlex’s Global South institution flag appears on about 4.5 percent of works in 2000 and about 30.4 percent in 2024. That is not equality. It is a large opening in the formal map of knowledge.
The hard part is what the line does not say. A paper can include a Global South institution while the money, journal prestige, equipment, language, citation network, and theory-making power sit elsewhere. Participation is not control. Still, a world where more researchers can appear in the graph is different from one where they are invisible.
How this number was made
What it measures. Share of OpenAlex works with at least one authorship institution marked Global South.
Calculation. Divided yearly works with a Global South authorship institution by all yearly works, 2000-2024.
The displayed line is monotone-cubic smoothed for legibility only — it never moves a data point.
The visible research system is far less exclusively rich-world than it was at the start of the century.
Being present in the graph is not the same as setting the agenda or receiving equal credit.
OpenAlex’s Global South flag is institution-based; author identity, funding control, and leadership are harder questions.
What language is the visible record written in?
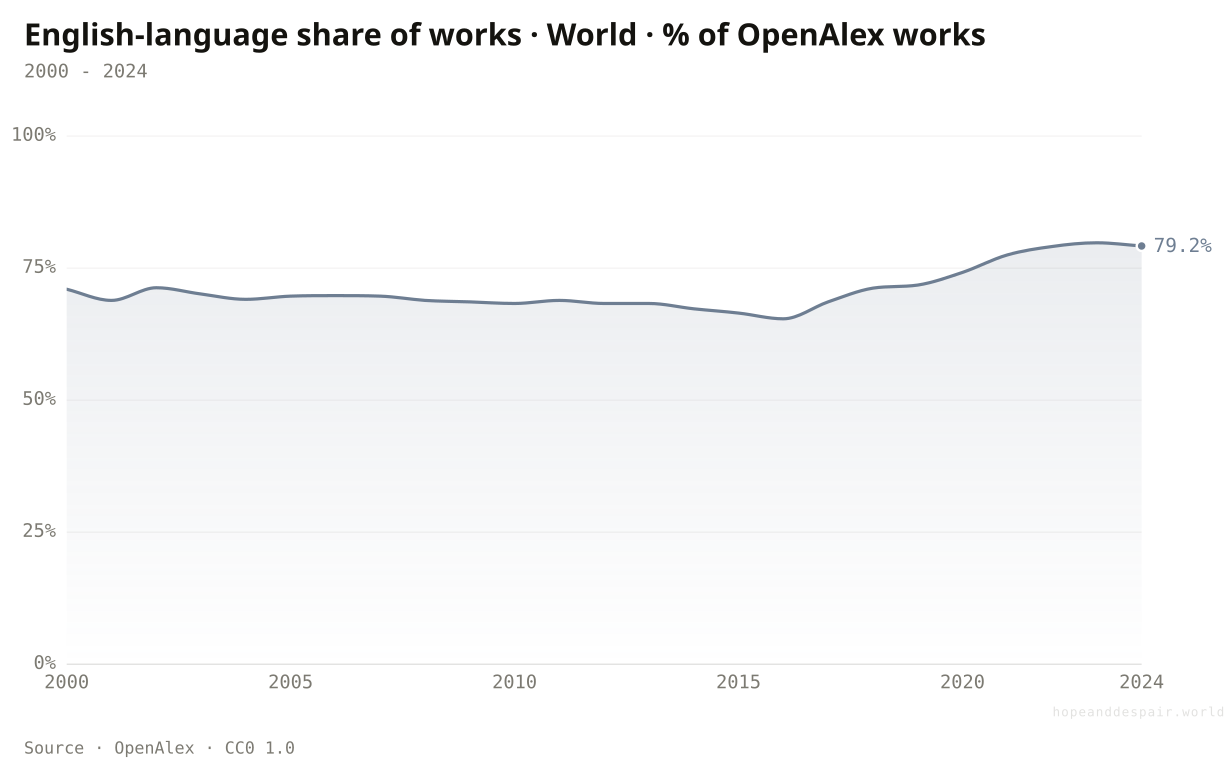
About 79% of 2024 works are in English, and that dominance has not faded in two decades.
Visibility has a language. Across the whole period, most of the indexed record is in English: about 71 percent in 2000. The share actually slipped through the 2000s as more local-language work was indexed, reaching about 66 percent by 2015. Then it climbed again, to about 79 percent by 2024. Read the recent rise with care. Non-English and local journals tend to enter OpenAlex more slowly, so the newest years over-count English much as they under-count everything else.
The honest summary is not decline. English dominance is sticky, sitting between two-thirds and four-fifths of the visible record for two decades. After English, the largest languages in 2024 are Portuguese, Spanish, German, and Indonesian, the last echoing the same national platforms that lifted Indonesia up the country ranking. A researcher who writes in another language is not absent from science. They are just harder to see in this graph, and harder to cite.
How this number was made
What it measures. Share of OpenAlex works detected as English, by publication year.
Calculation. Divided yearly works with language:en by all works in the same publication year, 2000-2024.
The displayed line is monotone-cubic smoothed for legibility only — it never moves a data point.
More non-English work is indexed than two decades ago, so the record is less exclusively Anglophone than at its peak.
Writing in English still decides who is easily found and cited; other-language scholarship stays harder to see.
Language is auto-detected and missing for some works, and recent years over-count English because local journals index slowly.
Who produces the visible record?
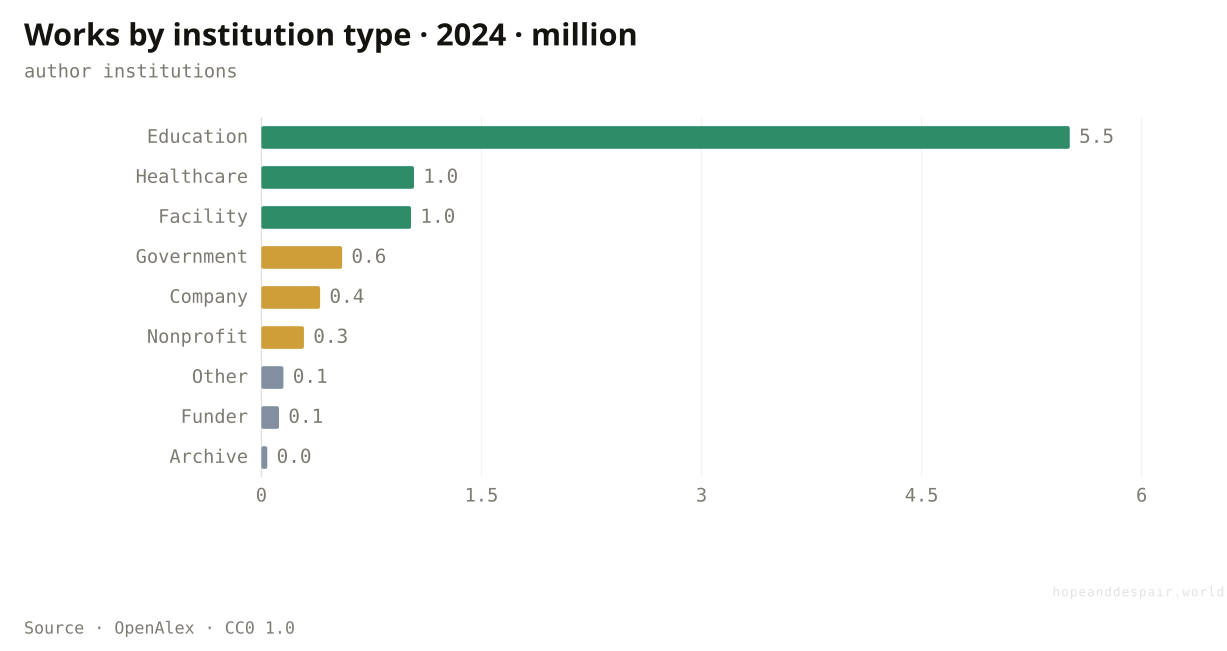
Education institutions dominate, but hospitals, facilities, governments, companies, and nonprofits all appear at scale.
OpenAlex is useful because it does not stop at papers. It connects works to institutions, and those institutions have types. In 2024, education institutions appear on about 5.5 million works. Healthcare and facilities each appear around one million. Government, companies, nonprofits, funders, archives, and others form the rest.
That is the modern research system: universities, hospitals, national labs, companies, field stations, repositories, funders, and infrastructure. Treating science as only universities misses how medicine, AI, energy, defence, agriculture, and climate knowledge are actually made.
How this number was made
What it measures. Works published in 2024, grouped by type of authorship institutions attached in OpenAlex.
Calculation. Group 2024 works by authorship institution type; show counts in millions.
Knowledge production is a broad infrastructure, not just a campus activity.
Corporate, government, and funder power can shape what questions are asked and what stays invisible.
Institution-type metadata is coarse; the same organization can play several roles in the research system.
Who gets highly cited?
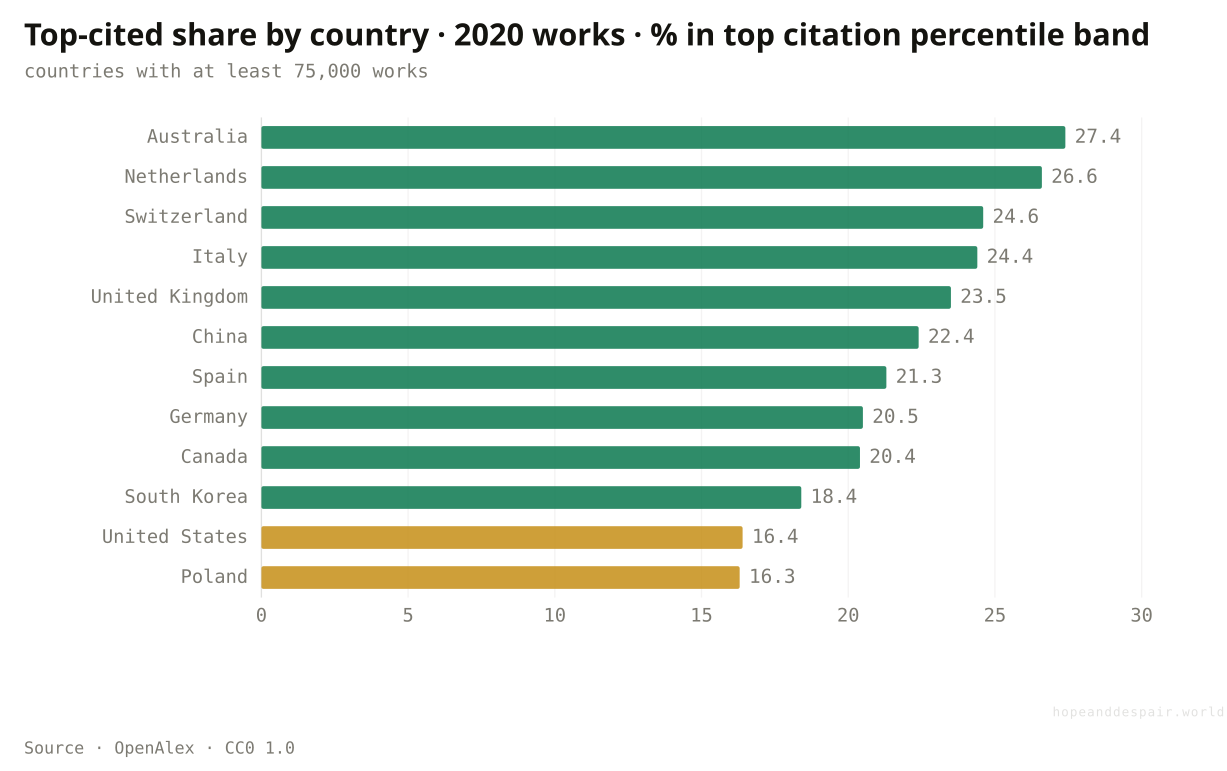
Among large 2020 producers, smaller rich research systems can have a higher top-cited share than the biggest producers.
Volume and attention are different maps, and laying one over the other breaks the obvious story. Using 2020 works so citations have time to accumulate, OpenAlex’s citation-normalized top-10% flag ranks Australia first at about 27 percent, with the Netherlands, Switzerland, Italy, and the United Kingdom close behind. The surprise is lower down the list. China, the largest producer by raw volume, sits sixth at about 22 percent, above Germany and Canada. The United States, the old prestige center, lands near the bottom of this group at about 16 percent.
Read this as a signal, not a scoreboard. Highly cited work follows field mix, language, collaboration networks, journal placement, and rich-country visibility. China’s high share in particular is contested, because part of its citation flow circulates inside its own fast-growing literature. The United States reads low partly because OpenAlex indexes a wide American tail of reports and repository items that almost nothing cites. The narrow but real takeaway: producing the most work is not the same as producing the most-noticed work.
How this number was made
What it measures. Share of a country-attributed 2020 works that OpenAlex marks as being in the top 10 percent of citation-normalized percentile. Countries shown have at least 75,000 2020 works.
Calculation. Divide top-10-percent cited 2020 works by all 2020 works for each author-institution country.
Influence is not only a brute-volume game; smaller systems can punch above their output.
Citations still reward prestige, English, networks, and fashionable fields, not just truth or usefulness.
Citation influence should be read with field, collaboration, and time-lag context; it is a signal, not a verdict.
Science is becoming more open and more global. The question is whether power is moving as fast as participation.— Hope & Despair
One question, read by the fields that actually study it. Each voice is given both its most hopeful and its darkest honest reading — with a note on how settled the evidence underneath is.
the hopeful readThe open-access charts matter most. Much more of the literature is reachable without a campus login.
the darker readReachable is not equal. Language, training, compute, journals, and networks still decide who can use the work.
the hopeful readParticipation in the visible graph has changed dramatically since 2000.
the darker readParticipation can be subordinate. Credit, authorship order, funding, and agenda-setting power may still sit elsewhere.
the hopeful readThe graph shows where new capacity exists and where collaboration could solve problems too large for one country.
the darker readFunding can amplify existing prestige rather than build neglected institutions, languages, and local questions.
Strongest case for hope
The hopeful case is strong: knowledge is multiplying, more of it is open, Asia and the Global South are far more visible, and cross-border science is rising. OpenAlex makes a public graph of a system that used to be mostly locked behind commercial indexes.
Strongest case for despair
The despairing case is that visibility is not equality. The graph can expand while power remains concentrated: rich institutions, English-language journals, citation networks, funders, companies, and prestige systems still shape what gets counted, cited, trusted, and turned into policy.
This verdict would move toward hope if Global South participation kept rising together with leadership measures: corresponding authorship, first authorship, local funding, open data, local-language dissemination, and top-cited work across neglected fields. It would move toward despair if participation rose only as junior partnership while citations, money, infrastructure, and agenda-setting stayed concentrated.
Everything done to the numbers between the source and the chart, disclosed in full. Where a choice is editorial rather than measured, we say so.
- OpenAlex API
- The article uses official OpenAlex
group_byqueries, snapshotted underdata/sources/openalex. The page never calls the API at runtime. - Country attribution
- Country bars group works by
authorships.institutions.country_code. A multi-country paper can count for every represented country, so the bars measure footprint in the graph, not exclusive ownership. - Country growth multiple
- The country-growth chart divides each country’s yearly country-attributed work count by its own 2000 value, so 1x means that country’s 2000 output. It shows pace, not absolute size.
- Country share
- The country-share chart divides each country’s yearly country-attributed work count by all OpenAlex works in that publication year. Because country counts are non-exclusive, shares should be read as footprint, not mutually exclusive slices.
- Field time series
- Field lines filter works by
primary_topic.field.id, group by publication year, and show selected large fields from 2000 through 2024. The article stops at 2024 because 2025 and 2026 are still subject to indexing lag. - Field growth multiples
- The field-growth bar divides each selected field’s 2024 output by its 2000 output. This answers what accelerated fastest, not what is largest.
- Open access over time
- The open-access trend divides each year’s
is_oa:truework count by all works in that year, from the full-historyworks?group_by=publication_yearsnapshots. OpenAlex’s open-access flag pools gold, green, hybrid, and bronze routes, which differ in how durable and reusable the access is. - Open access by field
- The field openness chart divides 2024
is_oa:truefield counts by all 2024 field counts and shows large fields with at least 100,000 works. - Open-access route
- The route chart groups 2024 works by
open_access.oa_status: diamond and gold are open journals (diamond charges no author fee), green is self-archived, hybrid and bronze are open articles in paywalled venues, and closed is paywalled. - Source type
- The source-type chart groups 2024 works by
primary_location.source.type(journal, repository, ebook platform, and so on). Repository largely means preprint servers and institutional archives. - Language
- The language line divides yearly works with
language:enby all works in that year. Language is auto-detected and missing for some works, and local-language journals index more slowly, so recent years over-count English. - International collaboration
- The collaboration line divides yearly works with
countries_distinct_count > 1by all yearly works from 2000 to 2024. - Global South participation
- The Global South line divides yearly works with
authorships.institutions.is_global_south:trueby all yearly works. It is institution-based, not author-identity-based. - Citation influence
- The attention chart uses 2020 works marked by OpenAlex as
citation_normalized_percentile.is_in_top_10_percent:true, divided by all 2020 works for countries with at least 75,000 country-attributed works.
- OpenAlex — openalex.org ↗ · CC0 1.0 · vintage 2026-06-15Used for works, country attribution, fields, open access and its routes, source types, language, collaboration, Global South participation, institution types, and citation-normalized top-cited shares.
Cite this page
Reference
Hope & Despair. “Who shapes science now?.” Hope & Despair, 2026. https://hopeanddespair.world/questions/who-shapes-science.
BibTeX
@misc{hopeanddespair:who-shapes-science,
  author       = {{Hope & Despair}},
  title        = {{Who shapes science now?}},
  year         = {2026},
  howpublished = {\url{https://hopeanddespair.world/questions/who-shapes-science}},
  note         = {hopeanddespair.world, updated 2026-06-15}
}
Original prose, code, and chart designs are released under CC BY 4.0 ↗ — reuse freely with attribution. Source datasets keep their own licences, listed above. Add your access date when citing.
- Who-shapes-science: deepen, fact-check, and add four OpenAlex views View diff →
- Fix OpenAlex-field chart overflow; add axis guard View diff →
- Mobile-first chart system + redesign branch snapshot View diff →
Generated from the commit history — every edit to a number, a word, or a chart is tracked in the open. Browse the full history & diffs on GitHub →
in plain words
If you only remember one thing, remember this: science is becoming more open and more global, but power is not the same thing as participation.
The old map of knowledge was simpler: a few rich countries, elite universities, subscription journals, and everyone else at the edge. That map is no longer true.
The new map is harder. More people are inside the graph. More work is open. More countries appear. But citation, funding, infrastructure, language, and agenda-setting still decide which parts of the graph become the story of science.