Question 03 · Climate
Is the climate stabilizing or breaking?
Every measure of the carbon and the heat points one way: up, and faster. The only line bending back is the price of the fix — which is real, and not yet enough to turn the others.
you read
- This is the whole climate system, end to end: the gases we emit, who emits them, the heat they trap, the damage that follows, who pays for it, and the energy turn that could stop it. It is long by design — the defining problem of the century deserves more than one chart. The arc runs the cause · the state · the consequences · the response · and the unfairness underneath it all — because not everyone heats up the same, and the people most exposed are the ones who did least to cause it.
- Three climate dimensions are named here but not charted, because the open data can’t honestly carry a global picture: heat extremes (no clean country-level dataset exists), ocean acidification (the long open-ocean record is a single station), and crop yields (global yields keep rising on fertiliser, so a chart would read as good news and bury the climate signal). Climate vulnerability is cited from ND-GAIN but its licence is unclear, so it is quoted, not re-hosted. The gaps are part of the honest answer.
- Two of the headline charts are global on purpose, not for lack of data. Carbon dioxide mixes through the whole atmosphere within a couple of years, so there is no such thing as a country’s concentration — the single world line is the physically correct one. Global temperature is the same: the planetary average is the measure, even though the warming underneath it is deeply uneven.
- Temperature here is shown against the 1951–1980 average, the standard scientific baseline. That is roughly 0.2°C above pre-industrial, so a reading of about +1.3°C on these charts is close to the +1.5°C above pre-industrial that the Paris Agreement set out to stay well below. Said again where it matters.
- Every section reads at the magnifications the data honestly allows — a world line, and where the measure permits, a regional or per-person cut — all on real ingested data: CO₂ and emissions from the Global Carbon Budget via Our World in Data, temperature from NASA GISTEMP, Copernicus/ECMWF ERA5, and Berkeley Earth, sea level from CSIRO and NOAA, Arctic ice from the NSIDC, forests from the FAO and World Bank, all CC BY or public domain, with source, data package, and lineage downloadable under each figure.
- The verdict at the top, and the hope-and-despair reading on every chart, are an editorial synthesis of the evidence, not a computed index. Every underlying series is real and individually sourced.
evidence
Whatever window you choose, the thermometer says the same word: warmer. A century and a half ago the world sat a fraction below its mid-20th-century average. By 2024 it ran about 1.3°C above it, the hottest year ever measured, with 2025 just behind. There is no slice of this record where the warming pauses for long. The hope on this page is real, but it is not in this chart.
The last ten years set the heat records: 2024 was the warmest ever measured. Over the very same decade the cost of clean power fell off a cliff and wind and solar reached a sixth of the world’s electricity. The damage and the escape route accelerated together. The temperature reading is unambiguous; the hope is real but lives in a different chart.
3 of 4 signals point to deterioration · 1 toward progress
Stand at the thermometer or the carbon gauge and every line is despair. Stand at the cost curve and, for the first time, the cheapest way to make power is also the clean one. Same quarter-century, opposite verdicts.
the lived now
Stand at the thermometer or the carbon gauge and every line is despair. Stand at the cost curve and, for the first time, the cheapest way to make power is also the clean one. Same quarter-century, opposite verdicts.
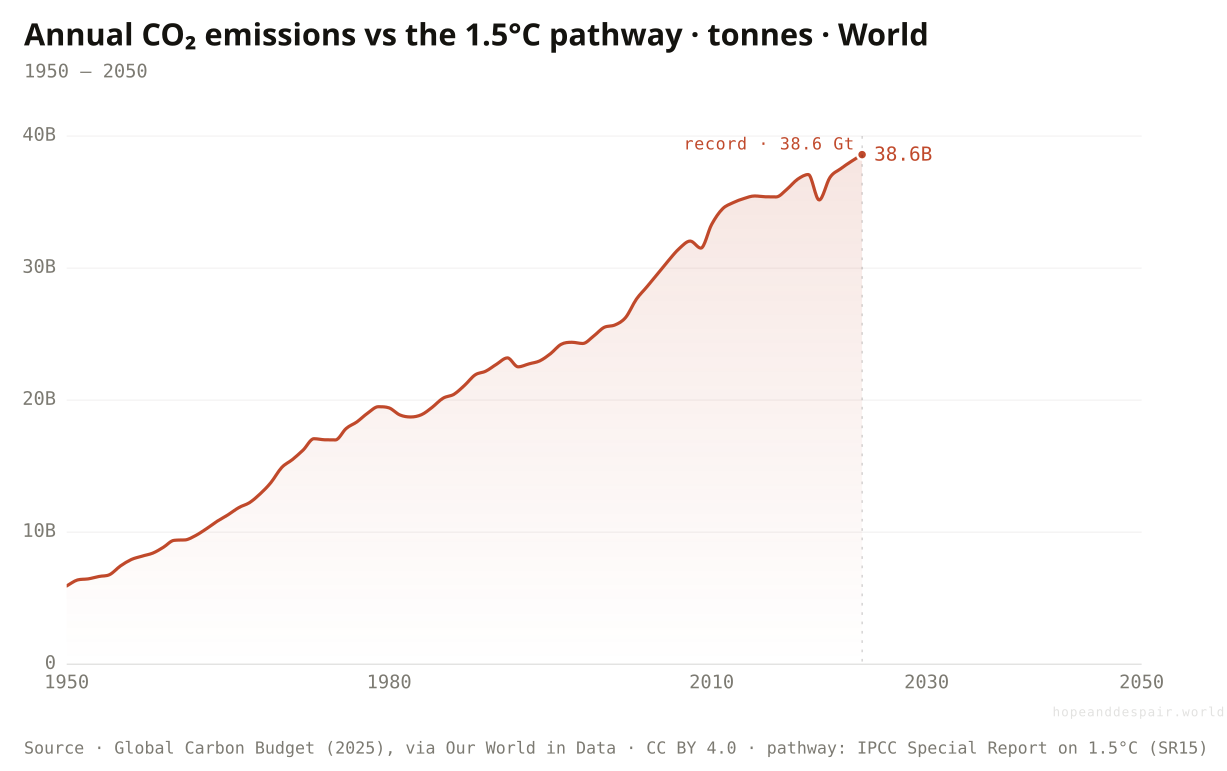
So who is putting the carbon up there — and is the flow still rising?
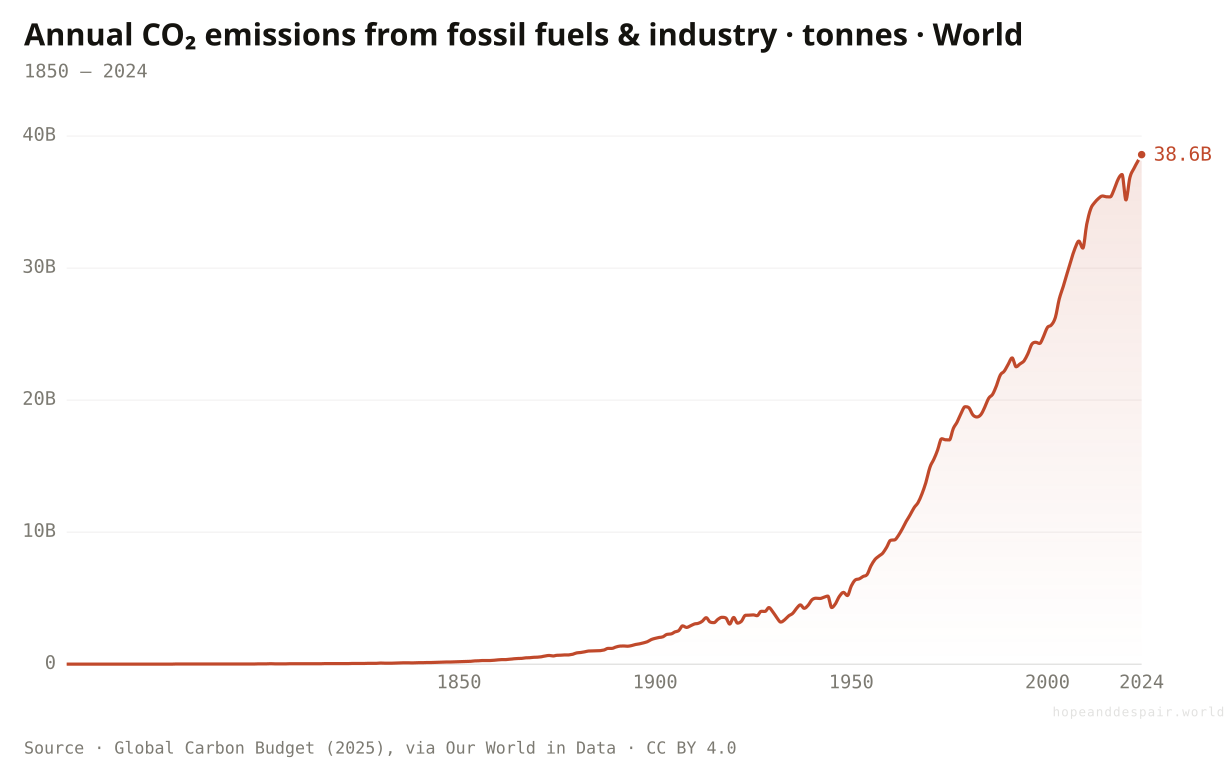
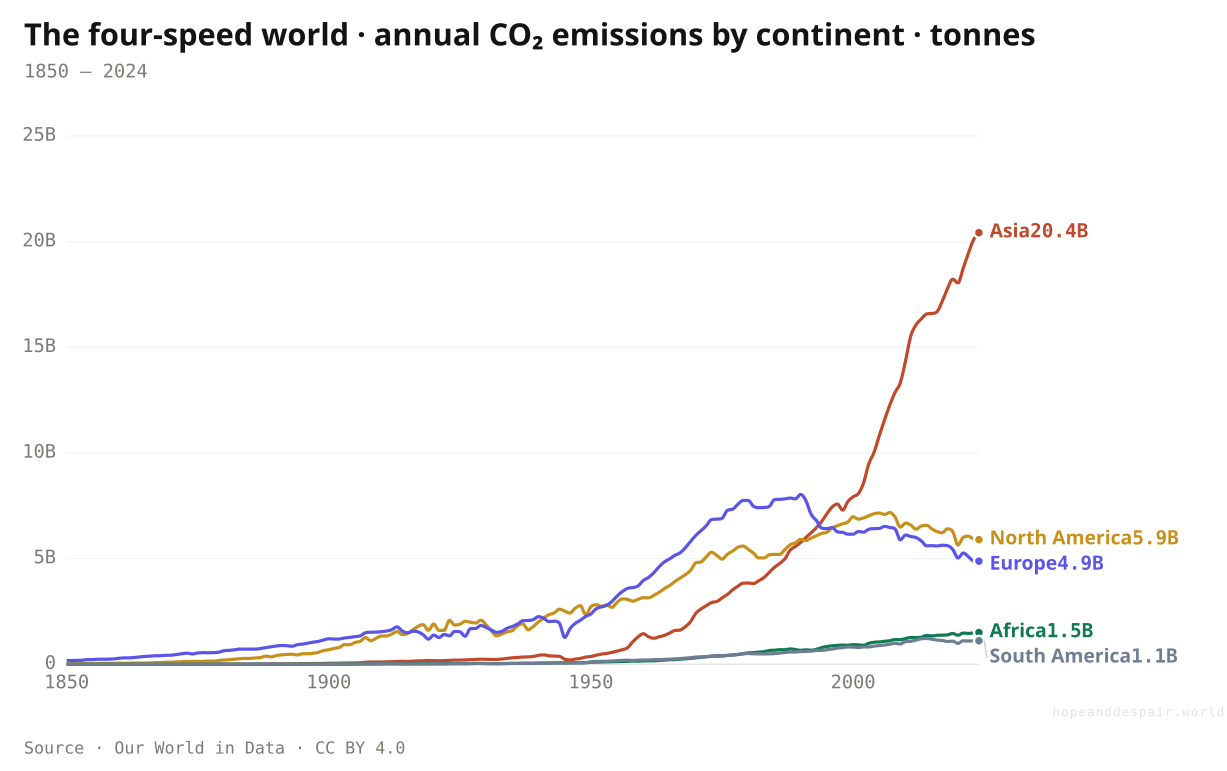
Annual emissions hit a record 38.6 billion tonnes in 2024, and the map behind that total has been redrawn: Asia alone now emits more than the whole rest of the world combined.
Begin with the flow: the carbon we pour into the air each year, the engine behind every other chart on this page. It has never run faster. In 2024 we put about 38.6 billion tonnes of CO₂ into the air from fossil fuels and industry, more than in any year on record and roughly six and a half times the 5.9 billion of 1950. The line has pointed up for two centuries and has not yet bent over. Until this number falls, the concentration keeps climbing. It is the honest floor of the whole story.
But a single world total launders a map that has flipped. In 2000, North America and Europe each out-emitted the rest of their continents; by 2024 Asia alone released about 20 billion tonnes, over half the world’s output, while North America’s fell from 7.0 to 5.9 billion and Europe’s from 6.2 to 4.9. The rich world’s emissions are genuinely declining. Almost all the growth of the last quarter-century is Asia industrializing, with Africa still a rounding error at 1.5 billion tonnes for a fifth of humanity.
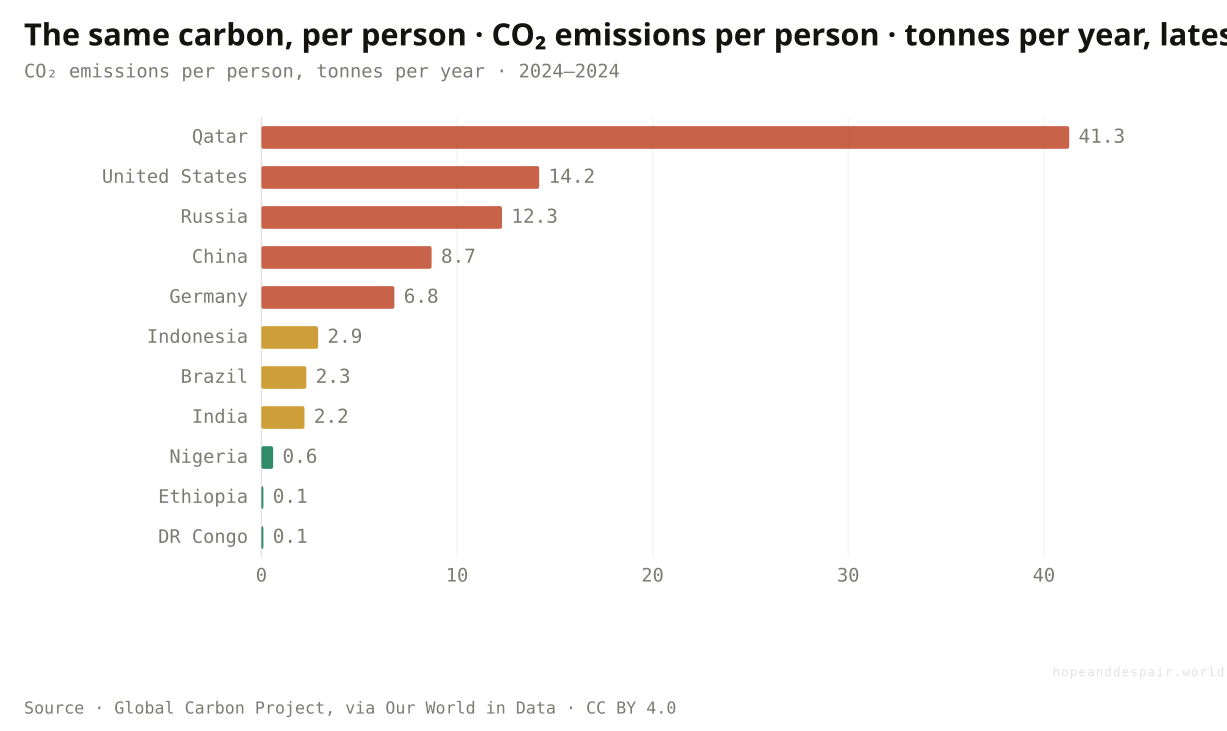
Then zoom to one person and the blame flips again. China emits more than any country in total, but about 8.7 tonnes per person, below the United States at 14.2, a fifth of Qatar’s 41.3. An Indian emits 2.2 tonnes a year, a sixth of an American; a Nigerian, 0.6; someone in DR Congo, a tenth of a tonne. Who emits the most and who emits the most per head are different questions with different villains. Almost every argument about fairness in climate is really a fight over which of those two charts to put on the table.
How this number was made
What it measures. Annual total emissions of carbon dioxide (CO₂), excluding land-use change, measured in tonnes.
Calculation. Selected entity World.
The displayed line is monotone-cubic smoothed for legibility only — it never moves a data point.
Asia’s emissions more than doubled since 2000, to about 20 billion tonnes. North America’s and Europe’s fell. The rise in the world total is almost entirely Asia, while Africa, with a fifth of the planet’s people, barely lifts off the floor at 1.5 billion tonnes.
China leads the world in total emissions but emits about 8.7 tonnes per person, below the United States’ 14.2 and a fifth of Qatar’s 41.3. An Indian emits a sixth of what an American does; much of Africa emits almost nothing. By this measure the heaviest emitters are the richest people, not the most populous countries.
The rich world’s emissions are genuinely falling, growth in the world total has slowed sharply, and several large economies have clearly peaked and turned down.
The one line that ultimately decides the climate has never been higher, and two centuries of effort have not yet bent it back toward the floor.
Whether 2024 is near the peak or just another step up depends on choices being made right now, mostly in Asia.
Whose carbon is actually sitting in the air — and who is paying for it?
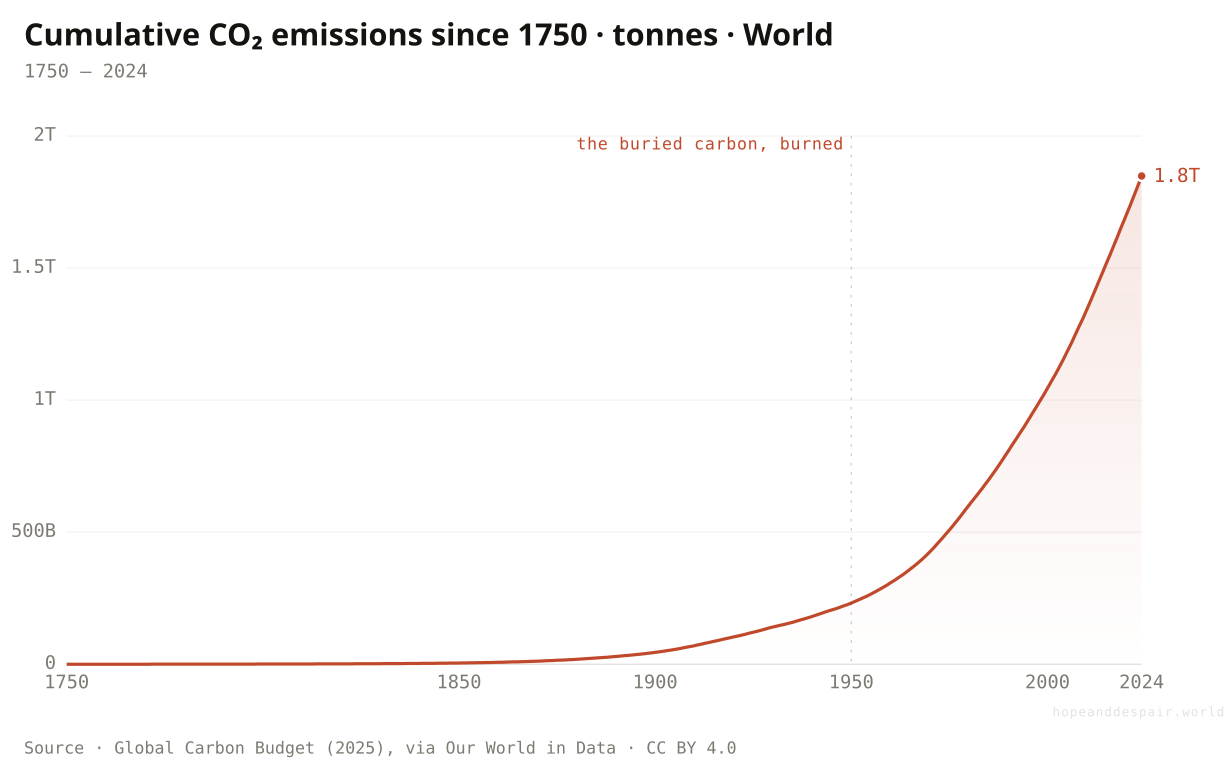
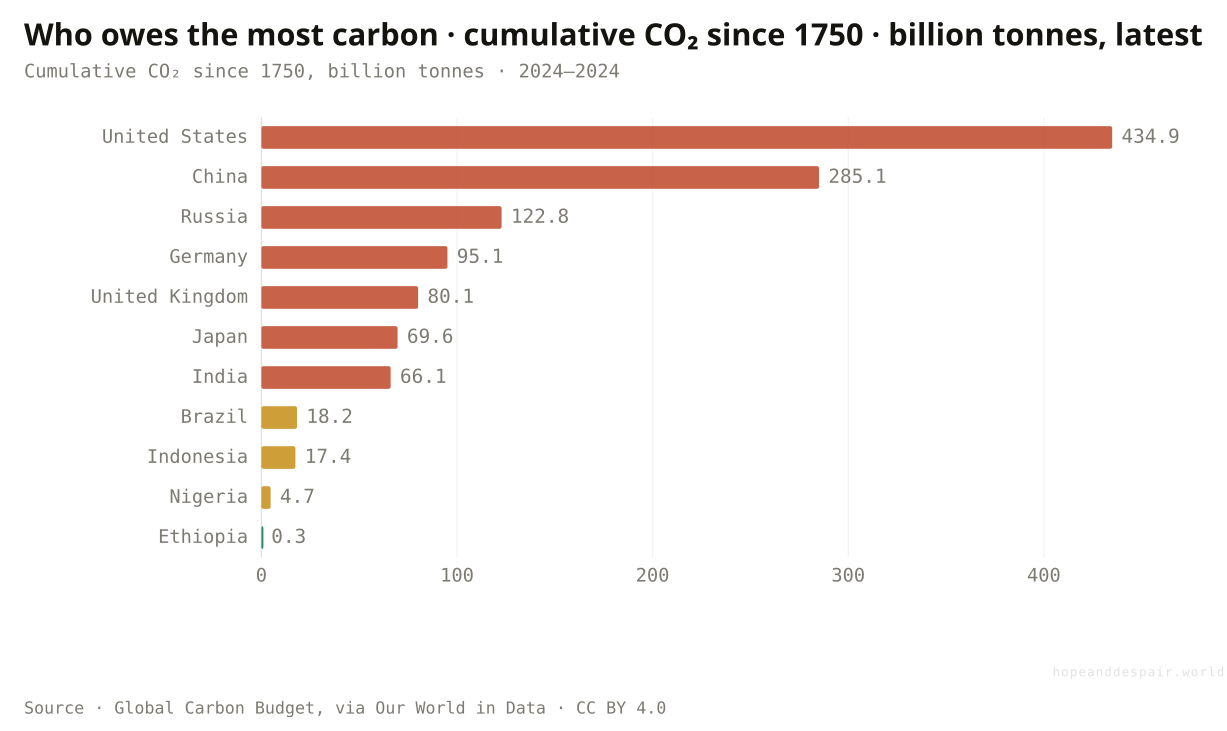
The world has put about 1.85 trillion tonnes of CO₂ into the air since 1750, and a quarter of it came from one country: the United States.
The atmosphere does not keep a yearly ledger; it keeps a running total. CO₂ lingers for centuries, so what warms the planet is the whole stock poured in since the first coal furnaces, not last year’s flow. That stock now stands at about 1.85 trillion tonnes, up from almost nothing in 1750 — roughly nine million tonnes that year, a number the modern world emits in a couple of hours.
Split the stock by country and the bill stops being shared. The United States alone is responsible for about 435 billion tonnes, close to a quarter of everything ever emitted, more than China and Russia put together. China, despite leading the world in emissions today, has banked about 285 billion tonnes over its whole history; Russia 123. India, with four times America’s people, has emitted about 66 — a seventh of the US total. Ethiopia, with a hundred-plus million people, sits at 0.3.
This is the stock the atmosphere actually integrates, and it carries a charge the yearly flow does not. The warming the whole world now lives with was poured into the air, overwhelmingly, by a handful of countries that got rich burning coal and oil over two centuries. It is a debt with a strange shape: the countries that ran it up are, as the last chart on this page shows, the ones best shielded from what it does.
How this number was made
What it measures. Total cumulative emissions of carbon dioxide (CO₂), excluding land-use change, since the first year of available data, measured in tonnes.
Calculation. Selected entity World.
The displayed line is monotone-cubic smoothed for legibility only — it never moves a data point.
The United States alone has emitted about 435 billion tonnes — close to a quarter of all the carbon ever put in the air, and more than China and Russia combined. India, with far more people, has emitted about 66; Ethiopia, 0.3. A handful of early industrializers account for most of the warming the whole world now lives with.
Responsibility this concentrated is also a lever for fixing it: a handful of wealthy economies hold most of the historical bill, and most of the money and technology to help settle it.
The carbon is already in the air for centuries, the countries that emitted it are the best shielded from the heat, and the ones that emitted least are first in line for the damage.
How much a present-day country owes for emissions made by earlier generations, under different borders and knowledge, is a moral question no dataset can settle.
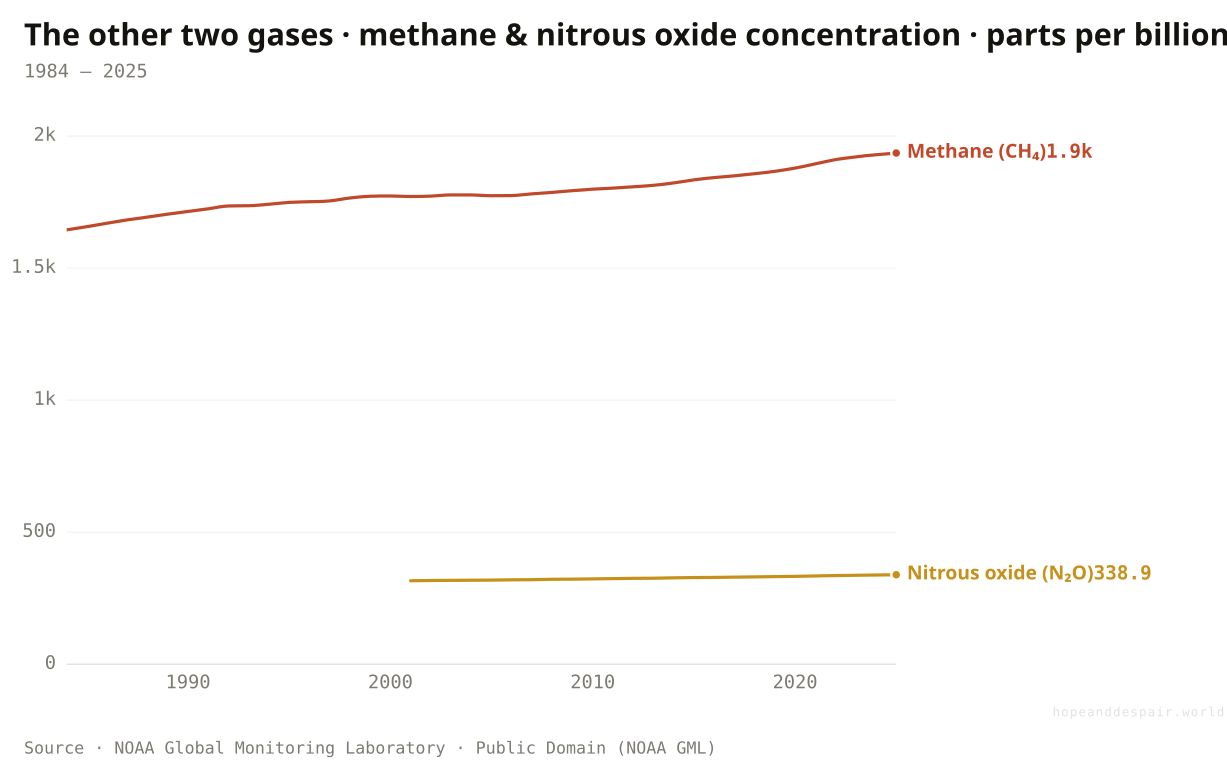
What about the greenhouse gases that aren’t carbon dioxide?
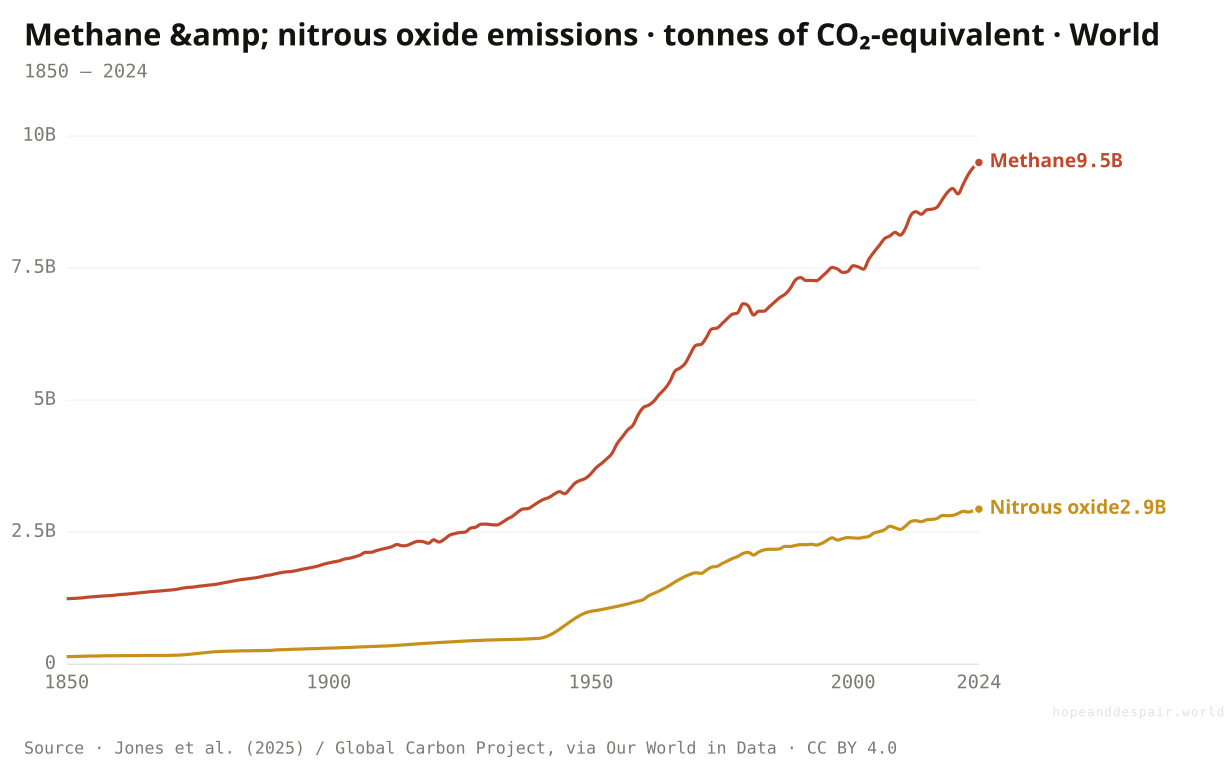
Methane and nitrous oxide add about 12 billion tonnes of CO₂-equivalent a year — roughly a third again on top of the CO₂ that gets all the attention.
Carbon dioxide is the gas everyone names, but it isn’t the only one warming the planet. Two others matter enough to track. Methane, mostly from livestock, leaking fossil fuels, and rotting waste, reached about 9.5 billion tonnes of CO₂-equivalent in 2024 — up from roughly 1.2 billion in 1850. Nitrous oxide, mostly off the nitrogen fertiliser spread on the world’s farms, came to about 2.9 billion. Both are measured in CO₂-equivalent tonnes so they can sit on the same axis as the carbon chart, weighing each gas by the warming it does over a century.
The two behave very differently. Methane is short-lived, broken down in the air within a decade or two, but while it lasts it traps heat far more fiercely than CO₂, molecule for molecule. That cuts both ways. It means a cow today is not still warming the world a century from now the way a tonne of CO₂ is. It also means cutting methane buys fast relief, one of the few levers that works on a human timescale rather than a geological one.
Add the two together and they come to about 12 billion tonnes of CO₂-equivalent. Set against the 38.6 billion tonnes of CO₂ in the previous chart, that is close to a third again on top — a whole extra slab of warming that the carbon headline quietly leaves out. The CO₂ line is the master dial, but it is not the only one turning.
How this number was made
What it measures. Measured in tonnes of carbon dioxide-equivalents over a 100-year timescale.
Calculation. Selected entity World.
The displayed line is monotone-cubic smoothed for legibility only — it never moves a data point.
Methane is short-lived, so cutting it cools the planet fast — fixing leaky pipes and wells is among the cheapest and quickest climate wins available.
These gases add roughly a third again on top of the CO₂ total, both are still rising, and the nitrous oxide comes from the fertiliser feeding eight billion people.
How much methane the warming world will release on its own — from thawing permafrost and wetlands — is one of the harder numbers to pin down.
If we fixed the power plants, would the problem be solved?
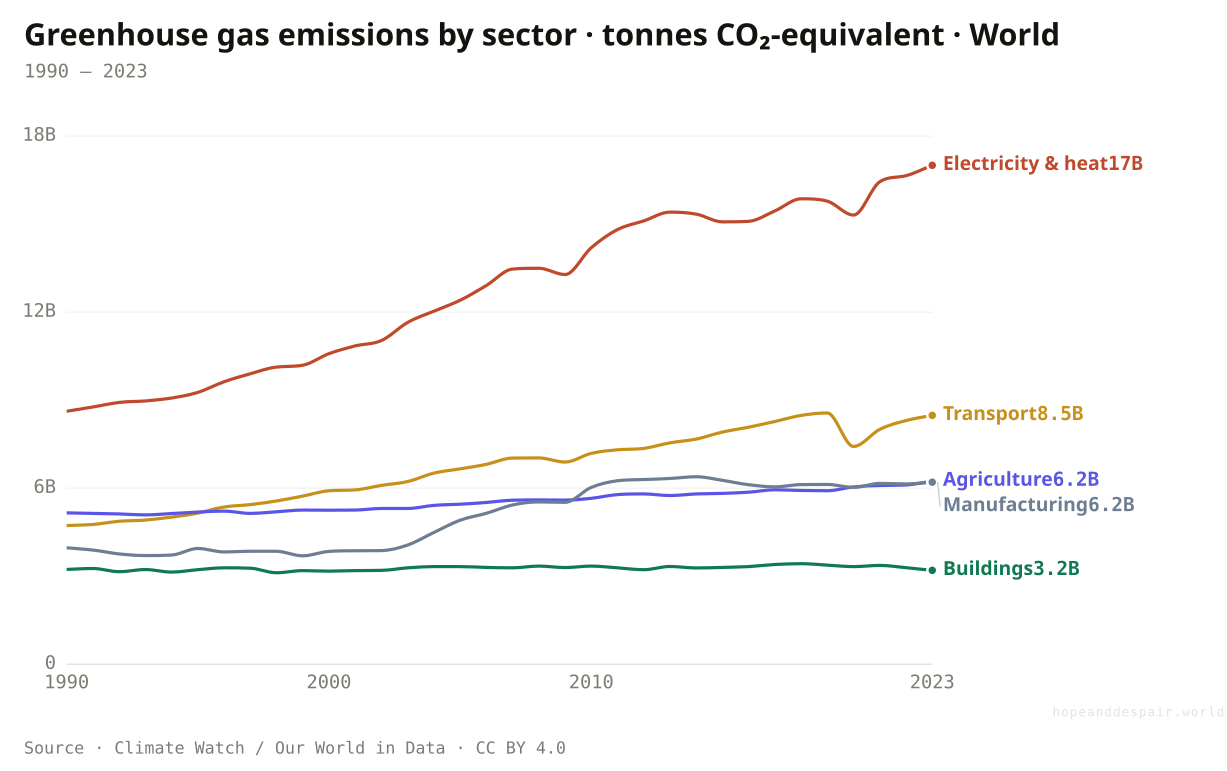
Electricity and heat is the single largest source of greenhouse gas at about 17 billion tonnes a year, but it is well under half of the total — there is no one switch to flip.
Break the world’s emissions apart by what they actually come from and the biggest single piece is generating electricity and heat: about 17 billion tonnes of CO₂-equivalent in 2023, roughly a third of all greenhouse gas, and nearly double its 8.6 billion in 1990. That is the part most people picture when they picture the climate problem, and it is the part the cheap-solar story is built to attack. It is also far from the whole picture.
Line the other sectors up behind it and the trouble spreads out. Transport put out about 8.5 billion tonnes in 2023, agriculture 6.2, manufacturing another 6.2, the heating and cooling of buildings 3.2. None of those is solved by a wind turbine. A cow’s stomach, a cement kiln, a cargo ship, a gas furnace in a cold flat — each is its own stubborn engineering problem, with its own timeline and its own missing technology. Clean the grid completely and you have handled the largest slice and left most of the meal untouched.
Notice which line refuses to move. Every other sector grew over these three decades; buildings barely budged, from 3.23 down to 3.20 billion tonnes, because efficiency gains and a warming planet that needs less winter heat have roughly cancelled the extra floor space. The lesson of the chart is the absence of a lever. There is no master valve. There are five or six medium valves, and most of them are harder to turn than the one we already know how to.
How this number was made
What it measures. Emissions are measured in tonnes of carbon dioxide-equivalents.
Calculation. Selected entity World.
The displayed line is monotone-cubic smoothed for legibility only — it never moves a data point.
The largest single source, the grid, is exactly the one we already know how to clean cheaply, so the biggest valve is also the most turnable.
More than half the emissions come from transport, farming, industry, and heat — problems with no cheap fix yet, and most of them are still growing.
How fast the hard sectors can be cleaned, and with what technology, is genuinely unknown; the grid is the only one with a settled answer.
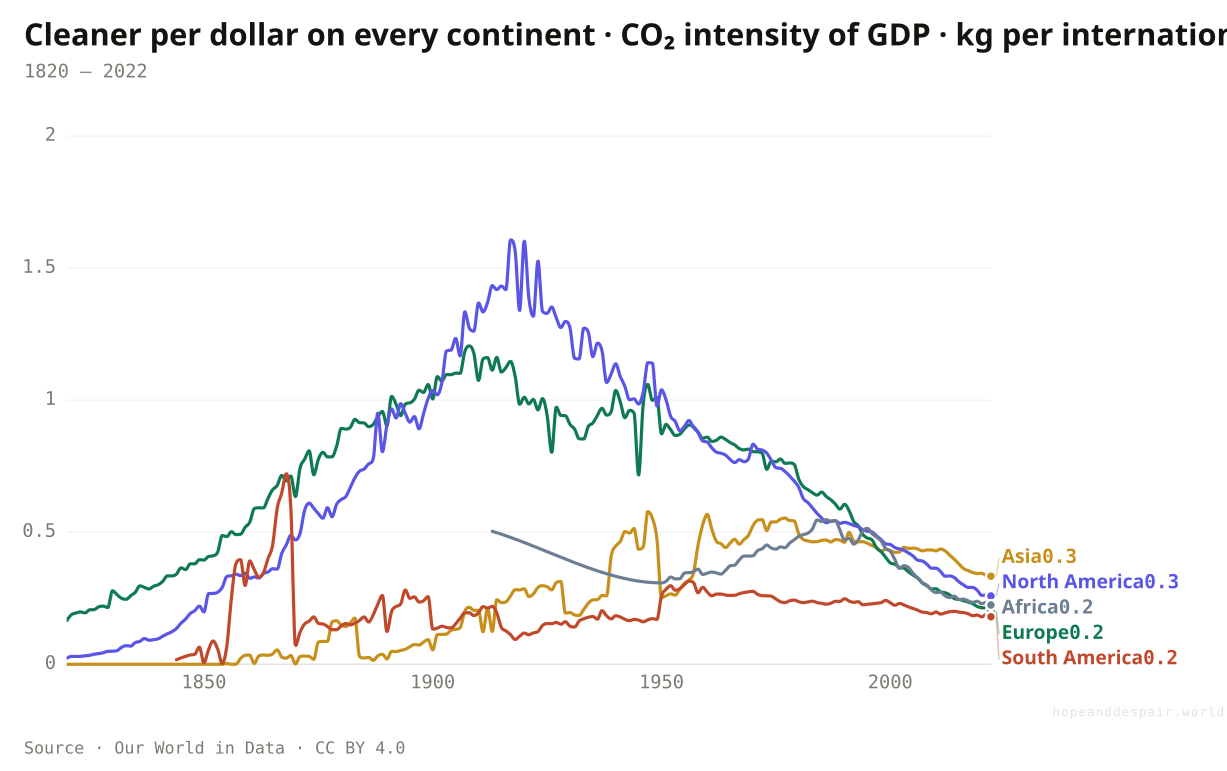
Are we getting more economy out of every tonne of carbon?
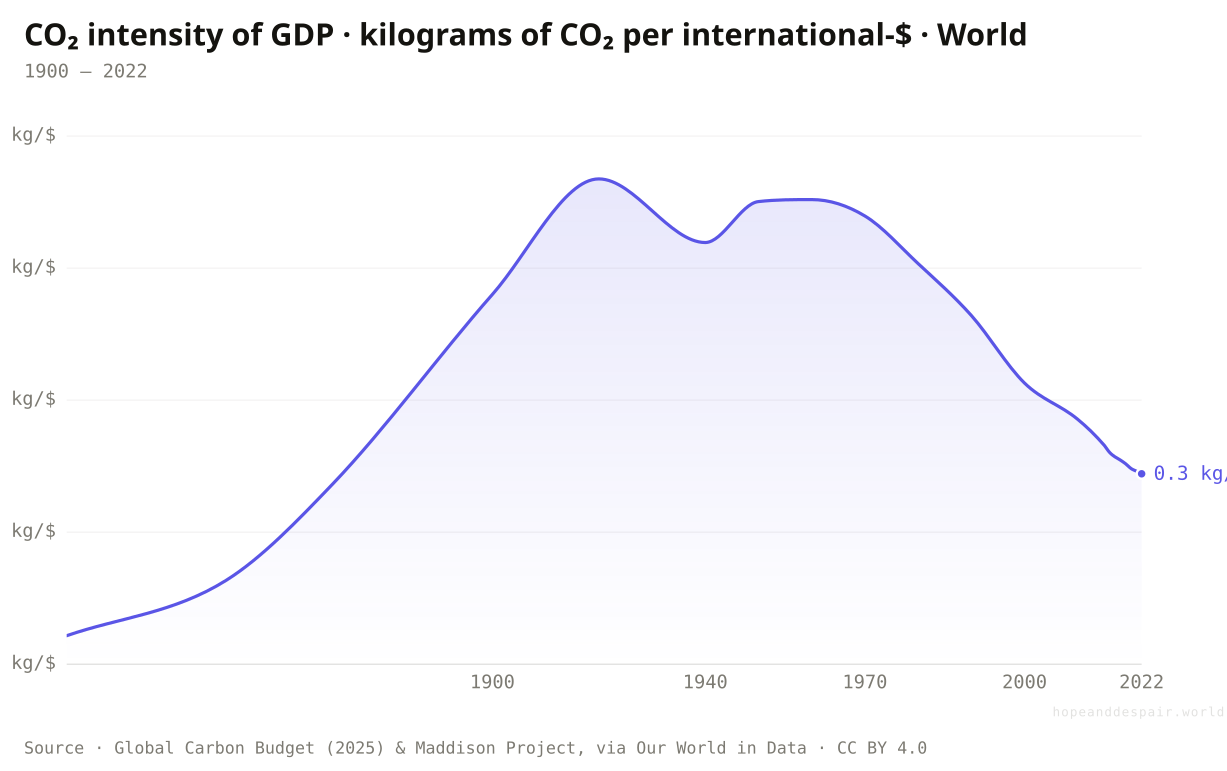
The world emits about half as much carbon per dollar as it did in 1990 — and emissions still hit a record, because the economy grew faster than the intensity fell.
Carbon and money have come unstuck. For every dollar of output, the world released about 0.53 kilograms of CO₂ in 1990; by 2022 it released 0.29. The same dollar of bread, steel, or software now comes with a little over half the carbon it used to, the cleanest the world economy has run in over 150 years.
This is real progress, and it is everywhere. Europe cut its intensity from 0.61 to 0.20 over those years, North America from 0.54 to 0.26, Africa from 0.47 to 0.22. Even Asia, the continent driving the emissions record, squeezed its figure from 0.46 down to 0.33 as it shifted from the dirtiest coal toward gas, renewables, and lighter industry. Not one major region got more carbon-heavy.
Here is why every line in this chart can fall and the one that matters still rises. Intensity is carbon divided by GDP; emissions are intensity times GDP. The world cut the first by roughly half while the economy roughly trebled, so the product, the actual tonnage in the air, kept climbing to a record. Running cleaner per dollar does not pull carbon out of the sky. It only means the total grows slower than the wealth does — useful, and nowhere near enough.
How this number was made
What it measures. Annual total emissions of carbon dioxide (CO₂), excluding land-use change, measured in kilograms per dollar of GDP (2011 international-$).
Calculation. Selected entity World.
The displayed line is monotone-cubic smoothed for legibility only — it never moves a data point.
Every continent runs cleaner per dollar than in 1990 — the lines all fall together. Europe cut its carbon intensity by roughly two-thirds, the steepest drop. Asia, which emits the most in total, still carries the most carbon per dollar, but its line points the same way as the rest: down.
Wealth and carbon are decoupling: every major economy now wrings far more value out of each tonne of CO₂ than it did a generation ago, and the trend is unbroken.
A falling ratio is not a falling total — the world halved its carbon per dollar and emissions still set a record, because growth outran the gains.
Whether intensity can keep dropping fast enough to finally bend the absolute tonnage down, rather than just slow its rise, is the open question under the whole decoupling story.
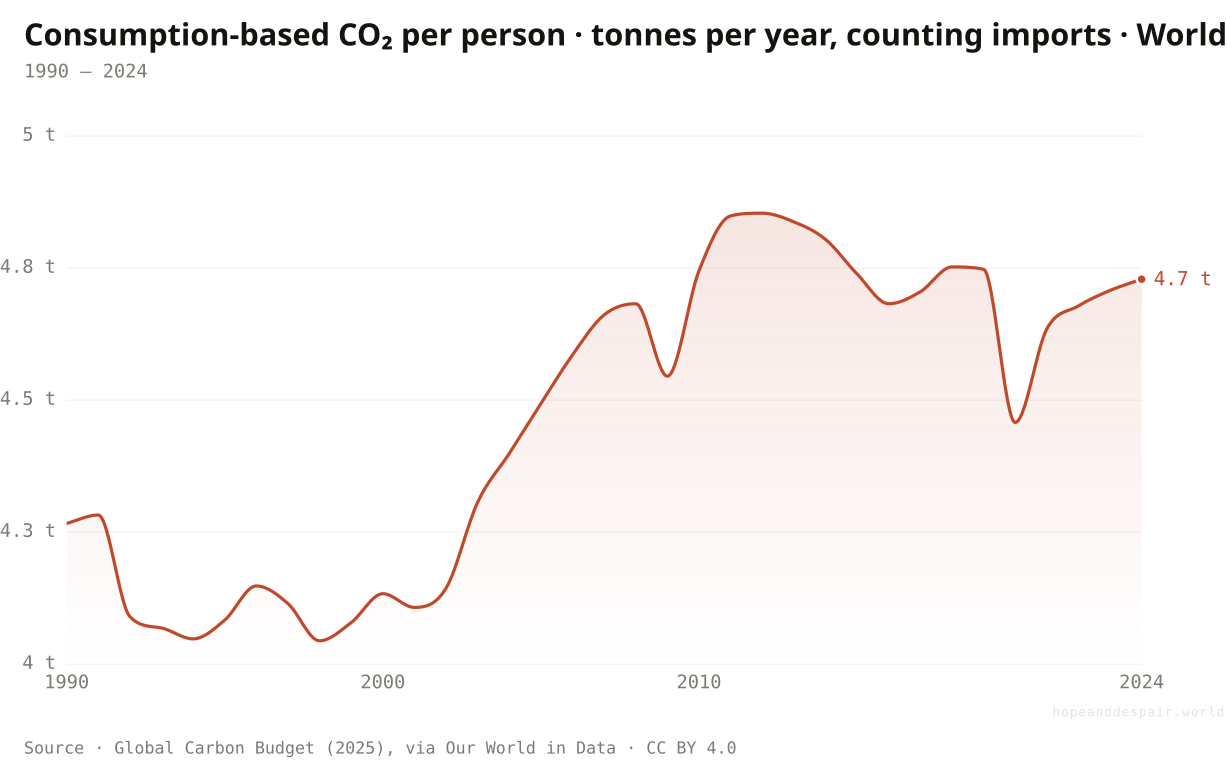
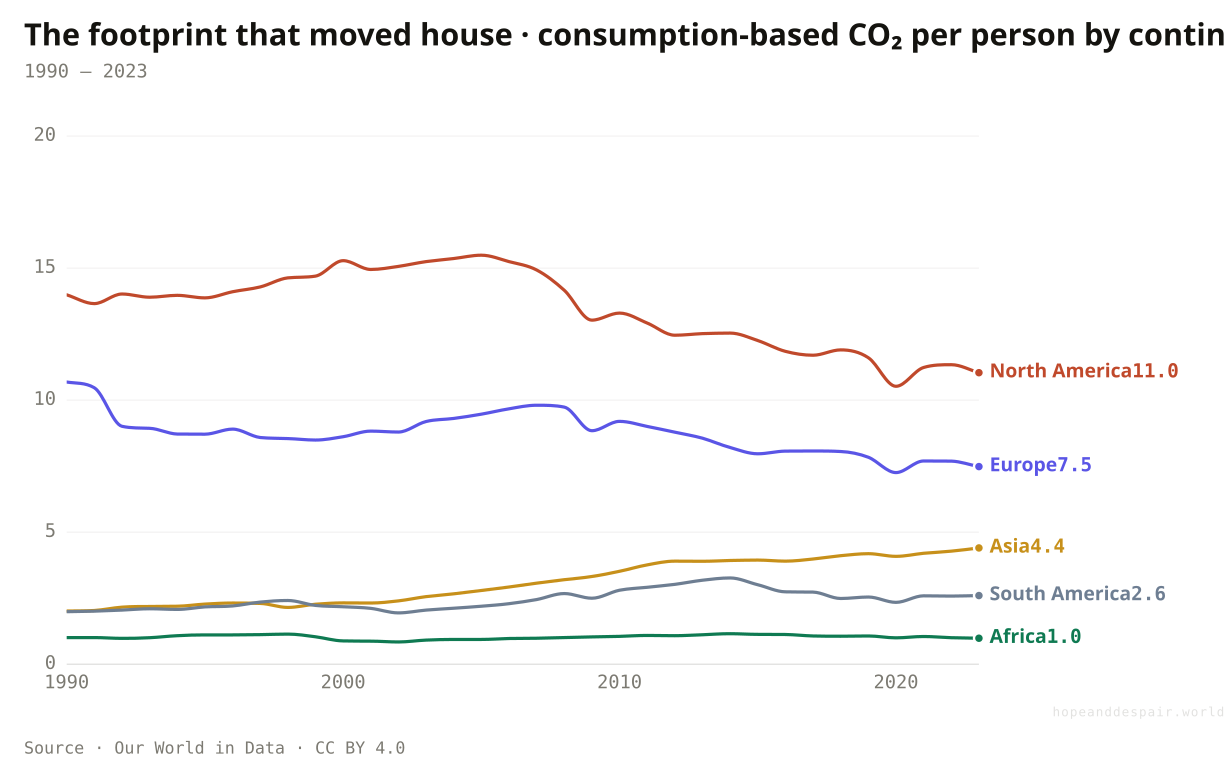
Whose footprint is it really, once we count what gets imported?
Counted by what people actually buy, not by where the factory stands, the average person’s carbon comes to about 4.7 tonnes a year — and the rich world’s true share is bigger than its own smokestacks suggest.
The emissions chart counted carbon where the chimney stands. This one counts it where the thing gets bought. Move a steel mill from Ohio to Hebei and the production map says America cleaned up; the consumption map says the same American still ordered the steel, so the carbon is still hers. By this accounting the average person on Earth was responsible for about 4.7 tonnes of CO₂ in 2024, up from 4.3 in 1990 — a global figure that has barely moved while the map underneath it churned.
The churn is the whole story. North America’s footprint per person fell from about 14.0 tonnes in 1990 to 11.0 by 2023, and Europe’s from 10.7 to 7.5, genuine declines. Asia’s more than doubled, from 2.0 to 4.4, as its factories took on the world’s manufacturing. But notice what the rich-world drop hides: a good slice of those falling Western numbers did not vanish, it relocated, banked instead inside Asia’s rising line as the carbon cost of goods bound straight back to Western shelves.
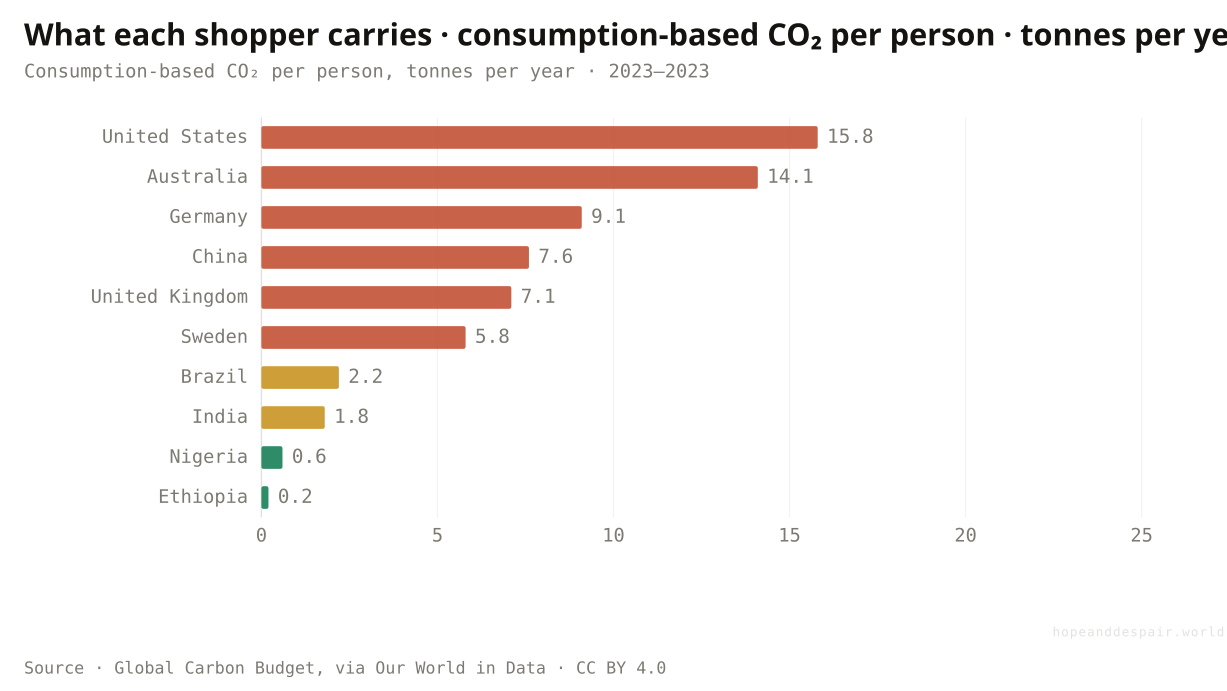
Zoom to the single shopper and the gap is stark. An American carried about 15.8 tonnes in 2023, an Australian 14.1, a German 9.1 — and a Chinese consumer 7.6, already above the world average. An Indian sat at 1.8, an Ethiopian at 0.2, about an eightieth of the American. The poorest people on the planet buy almost nothing with carbon in it. The footprint that warms the world belongs, overwhelmingly, to the people who can afford to shop.
How this number was made
What it measures. Annual consumption-based emissions of carbon dioxide (CO₂), measured in tonnes per person.
Calculation. Selected entity World.
The displayed line is monotone-cubic smoothed for legibility only — it never moves a data point.
North America’s per-person footprint fell from about 14.0 tonnes in 1990 to 11.0 by 2023, Europe’s from 10.7 to 7.5. Asia’s more than doubled, from 2.0 to 4.4, taking on the world’s manufacturing. Africa stayed near 1.0, flat and tiny. Some of the rich world’s decline is real cleanup; some is carbon shipped abroad and bought back as goods.
An American is responsible for about 15.8 tonnes a year once imports are counted, an Australian 14.1, a German 9.1 — and a Chinese consumer 7.6, already past the world average. An Indian carries 1.8, an Ethiopian 0.2, about an eightieth of the American. The carbon footprint tracks the wallet, not the head count.
The rich world’s footprint per person is genuinely falling, and counting carbon by consumption stops wealthy countries from claiming credit for emissions they simply shipped overseas.
Once imports are counted, the wealthy still carry several times the carbon of the poor, the world average is creeping up, and much of the West’s "cleanup" is just offshored smoke.
How much of a falling Western footprint is real efficiency versus carbon relocated into someone else’s chart is genuinely hard to pull apart.
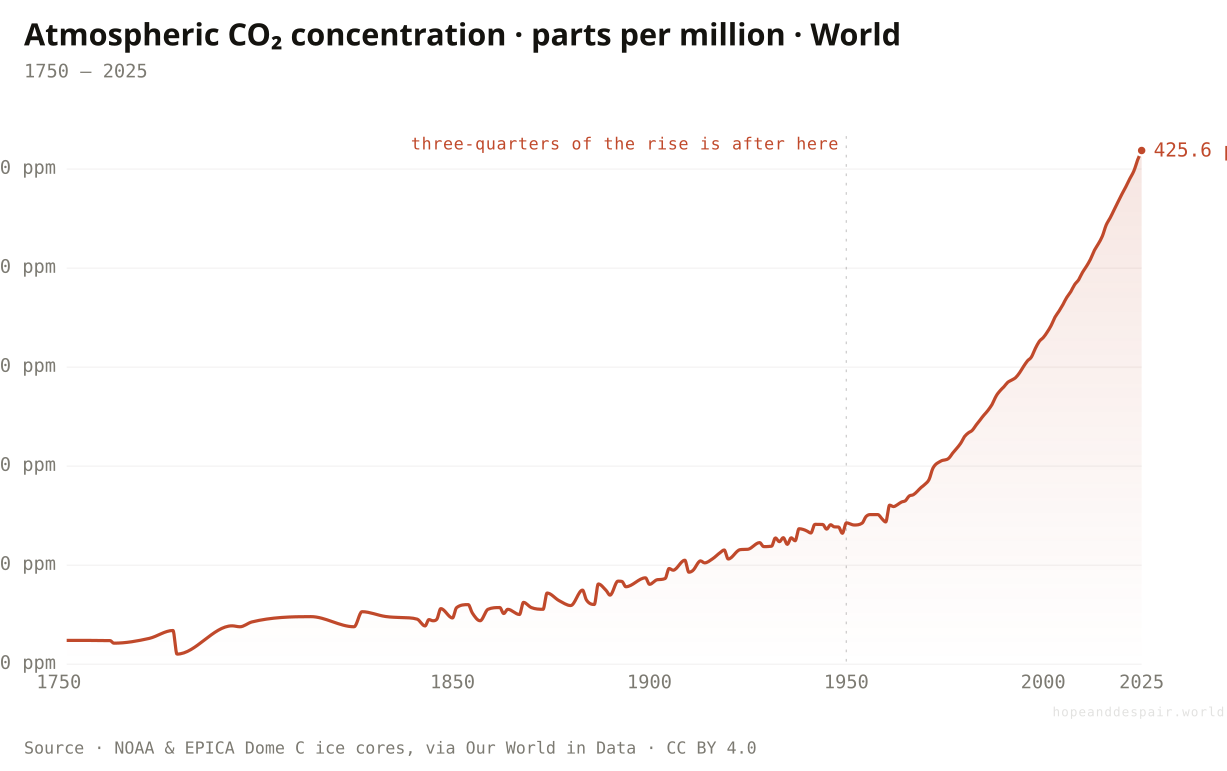
How thick is the heat-trapping blanket now — and is it still getting thicker?
Carbon dioxide in the air has gone from about 278 to 426 parts per million, and more than three-quarters of that rise has come since 1950, inside a single lifetime.
Three gases do most of the trapping, and the main one has run away from its natural band. Before we started burning coal and oil the air held about 278 parts of CO₂ per million; in 2025 it holds 426, the highest reading in at least several million years. For the eight-hundred-thousand-year stretch readable from ice cores the number never climbed above roughly 300, through ice ages and warm spells alike. Then the line left the band and kept going.
The shape of the climb is the part that should land. Of the whole increase above the pre-industrial level, more than three-quarters has happened since 1950. The air sat near 313 that year, so most of this was added not in deep geological time but within the life of someone now old enough to be a grandparent. Each year we pile on more, and the gas does not leave on any human timescale, so the curve keeps steepening.
This chart has no regional version, and the absence is the honest point. A molecule of CO₂ released over Shanghai or Ohio mixes through the entire atmosphere within a year or two, so every place on Earth breathes very nearly the same air. There is no national figure to stand behind. The 426 is the blanket all eight billion of us share, and it is the master dial under the heat, the sea, and the ice that the rest of this page traces.
How this number was made
What it measures. Measured in parts per million.
Calculation. Selected entity World.
The displayed line is monotone-cubic smoothed for legibility only — it never moves a data point.
Methane climbed from about 1645 parts per billion in 1984 to 1936 in 2025; nitrous oxide from about 316 in 2001 to 339. Both are a thousand times scarcer than CO₂, but methane traps far more heat per molecule and nitrous oxide lingers for over a century, so the two thin lines carry weight well beyond their size.
The number is measured to the part per million, the same way worldwide, which is why the science under it is among the most settled in any field.
It is the highest in millions of years, most of the rise is recent, and the other two greenhouse gases are climbing right alongside it.
Exactly how much warming a given concentration finally locks in, and how fast, is the one genuinely loose link in the chain.
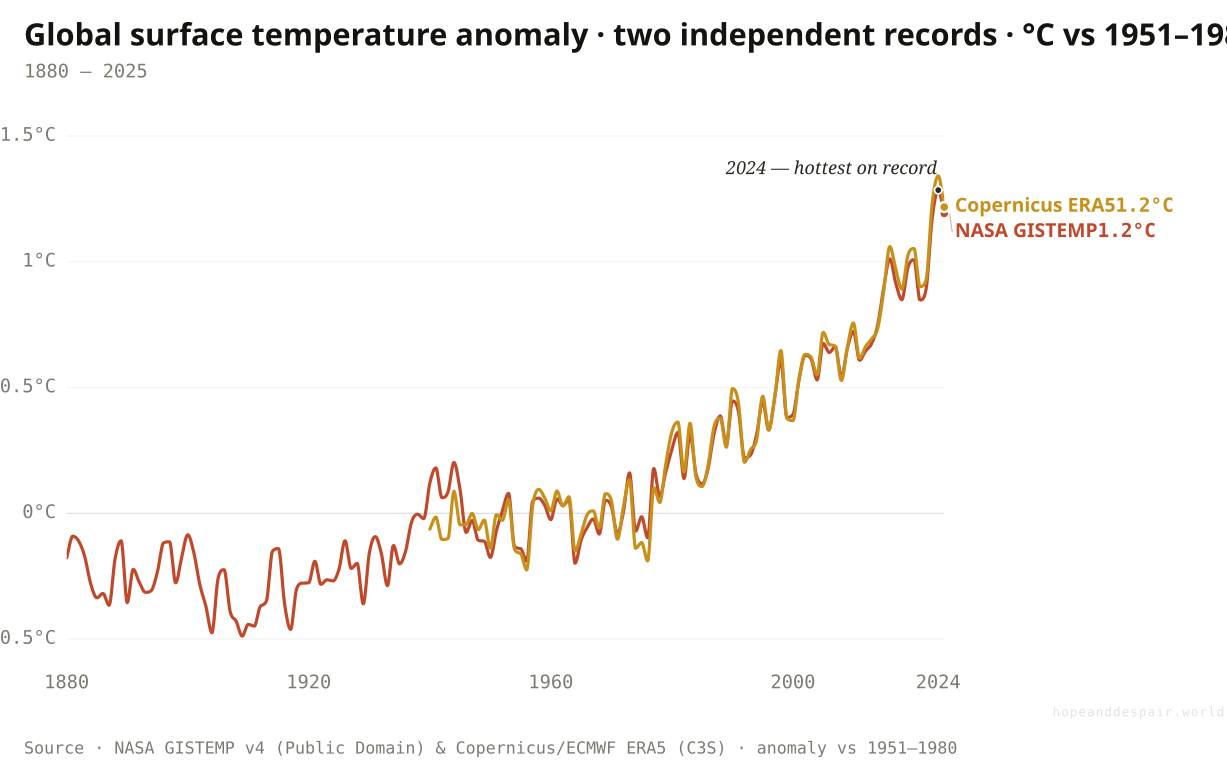
Has the planet actually warmed — and do independent thermometers agree?
The world is about 1.3°C warmer than the mid-20th-century average, and two separate records agree to within a tenth of a degree.
The extra carbon traps heat, and the heat is now measured past serious dispute. Two records built in completely different ways say the same thing. NASA’s GISTEMP reads surface thermometers; the Copernicus ERA5 reanalysis blends satellites into a weather model. Lay one over the other and they track to within about a tenth of a degree. Averaged over the whole surface, 2024 ran about 1.3°C above the 1951–1980 average on GISTEMP and a shade higher on ERA5, the warmest year in the instrumental record, with 2025 just behind. On the scale that drives policy, 1.3°C here is roughly 1.5°C above the pre-industrial world. That is the line the Paris Agreement was written to stay well below, now brushed in single years.
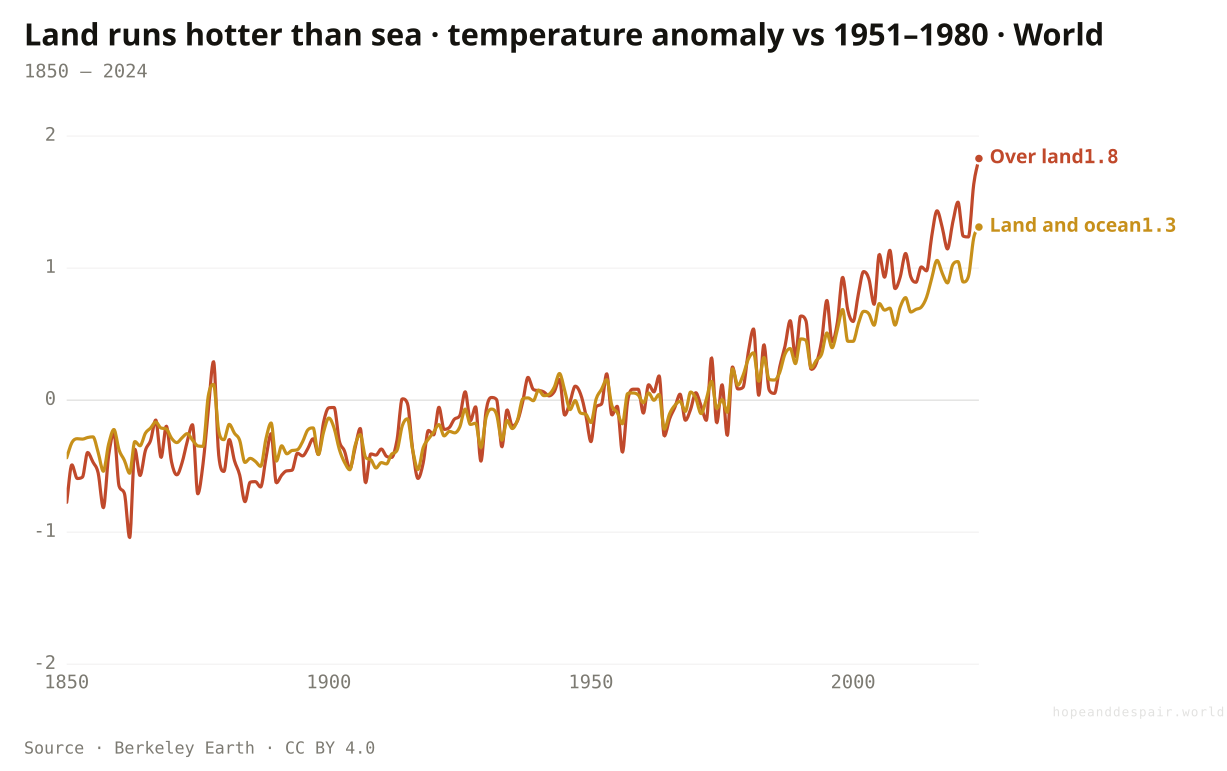
The single global figure hides a split that everyone who lives on land actually feels. Break the warming into land and sea and the lines pull apart. By 2024 the land had warmed about 1.8°C against the mid-century baseline while the combined land-and-ocean planet sat near 1.3. That gap is the ocean doing us a brutal favour. Water covers seven-tenths of the surface and has soaked up more than ninety percent of the extra heat, warming slowly because it is so vast and so deep.
So the air over your city has warmed more than the headline number admits, and an enormous amount of heat is now banked in the sea, waiting. The wiggles in the line are El Niño and La Niña sloshing heat between water and air. Smooth them out and one trend is left, bending upward, steepest in the years nearest now.
How this number was made
What it measures. Global surface temperature anomaly (vs 1951–1980), World
By 2024 the land had warmed about 1.8°C against the mid-century average; the whole land-and-ocean planet, about 1.3. The slowly-warming ocean drags the global figure down, which is why the warming people actually live through, on land, is larger than the number that makes the headlines.
The measurement is rock-solid and two independent teams agree to a tenth of a degree, which is exactly what lets us argue the response on the merits rather than the facts.
The world is brushing the 1.5°C line decades early, the land is hotter still, and the ocean has banked enough heat to keep the rise going even if emissions stopped tomorrow.
How much of any single hot year is the long trend versus a passing El Niño only becomes clear in hindsight, a few years later.
Does the global average match what any one country actually feels?
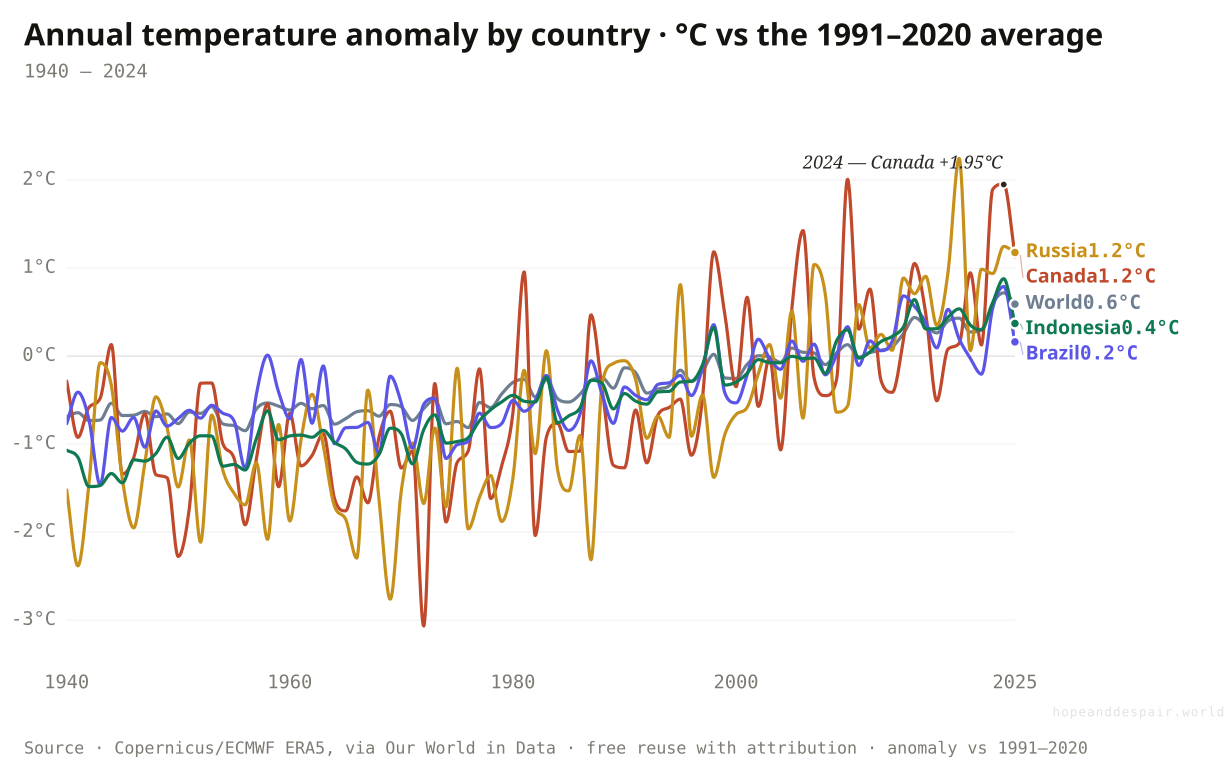
Against the 1991–2020 baseline, the world warmed about 0.7°C by 2024, but Canada warmed 1.95°C and Russia 1.25 — the far north heats at roughly twice the global pace.
The planetary average is an accountant’s number that almost no one lives inside. Measured against the recent 1991–2020 baseline — a different, closer reference than the 1951–1980 one used earlier on this page, so every figure here looks smaller — the whole world sat about 0.72°C above that mark in 2024. Canada that same year ran 1.95°C above it, Russia 1.25. The high-latitude land is warming at something close to double the global rate.
This is Arctic amplification, the white-ice feedback working overtime. As snow and sea ice retreat, dark land and water take the place of a mirror, soaking up heat that used to bounce back to space. The warming feeds on itself fastest where the ice is, which is the top of the world. So the people who live nearest the poles are handed the steepest curve, whether or not they did much to cause it.
Now read the tropics on the same axis. Brazil came in at 0.79°C above the 1991–2020 average in 2024, Indonesia at 0.88 — near the global figure, far below the northern lands. A warm, wet equator does not amplify the same way. The uneven heat is the quiet injustice under the whole subject: a single global line that hides a Canadian winter loosening twice as fast as a number meant to describe everyone at once.
How this number was made
What it measures. The difference of a specific year's average surface temperature from the 1991-2020 mean, in degrees Celsius.
Calculation. Selected entity World.
The displayed line is monotone-cubic smoothed for legibility only — it never moves a data point.
The same dense, agreeing thermometer record exists for every country, so no nation can claim it cannot see its own warming — the local number is as solid as the global one.
The places warming fastest, the far north above all, are crossing thresholds — thawing permafrost, vanishing winter ice — years ahead of the schedule the global average implies.
Single-year country figures swing hard with weather; 2024 was a peak and 2025 fell back, so one year tells you the spread between places far better than the trend within any one of them.
If the air has warmed a degree or so, where did the rest of the trapped heat end up?
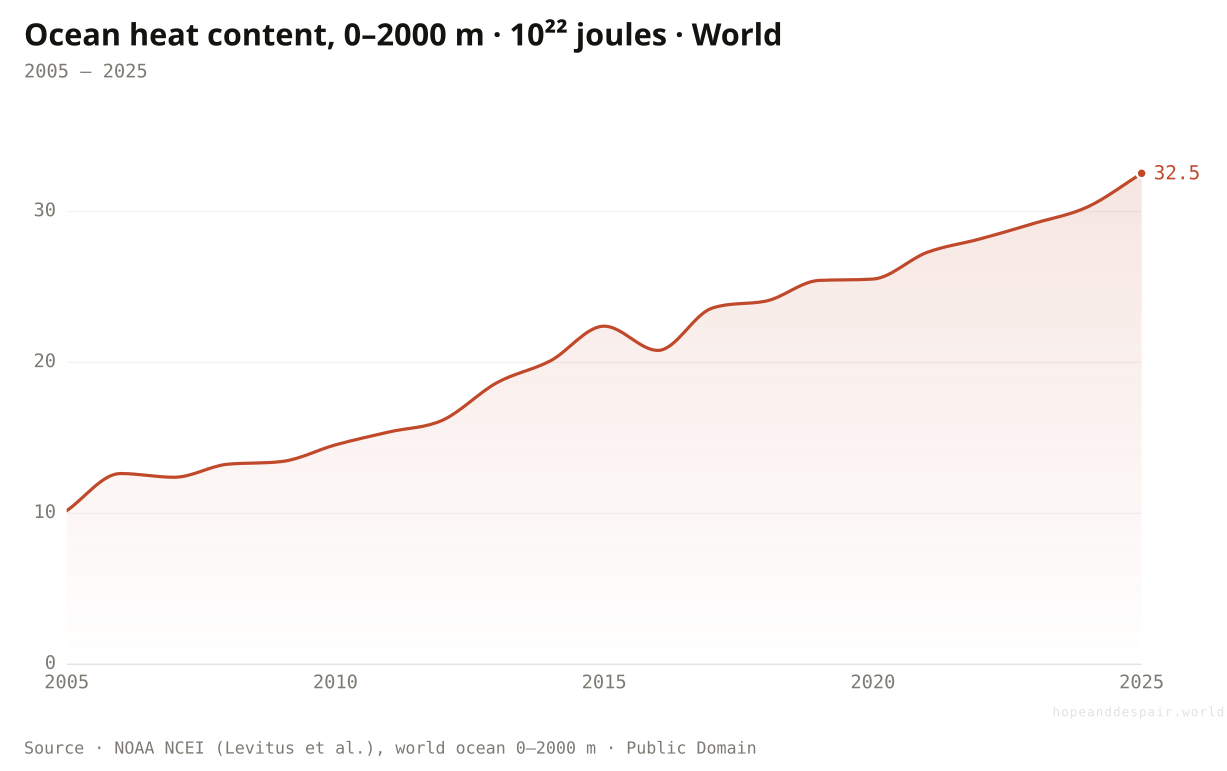
More than nine-tenths of the planet’s extra heat is in the ocean, and the heat stored in the top two kilometres has roughly tripled in twenty years.
The thermometer in the sky only measures a thin skin of the problem. The air holds almost none of the heat the carbon traps; the water holds nearly all of it. More than ninety percent of the planet’s accumulated extra energy has gone into the ocean, and the cleanest way to see it is to count the joules directly. Measured down to two thousand metres, the world ocean’s stored heat climbed from about 10 units of 10²² joules in 2005 to roughly 32.5 in 2025 — a little more than a tripling in two decades.
That number is hard to picture, so anchor it. A unit here is ten thousand billion billion joules; the rise of about 22 of them is the energy equivalent of detonating several Hiroshima-scale bombs in the sea every second, year after year, without pause. Unlike the air temperature, which jumps and dips with each El Niño, this line barely wavers. It climbs almost in a straight diagonal, which is why oceanographers treat it as the single most reliable gauge of how fast the planet is heating.
The record is short, and it is honest to say so: reliable global coverage only begins around 2005, when a fleet of drifting floats finally spanned the deep ocean. Twenty years is a sliver. But the deep point does not need a long record. The heat is not gone; it is banked. Water gives its warmth back slowly, over centuries, which means the sea will keep nudging the sea level higher and the storms wetter long after the air above it stops warming.
How this number was made
What it measures. Global ocean heat content (0–2000 m), World
It is the steadiest measurement in all of climate science, almost free of the year-to-year noise that lets people argue about the air — which makes the trend impossible to wave away.
Nearly all the warming we have caused is sitting in the sea, and water releases its heat over centuries, so much of the sea-level rise and ocean disruption ahead is already loaded and waiting.
The reliable global record is barely twenty years long, so exactly how fast the deep ocean is taking up heat, and how soon it gives it back, is still being pinned down.
Is the warming actually rearranging the physical map yet?
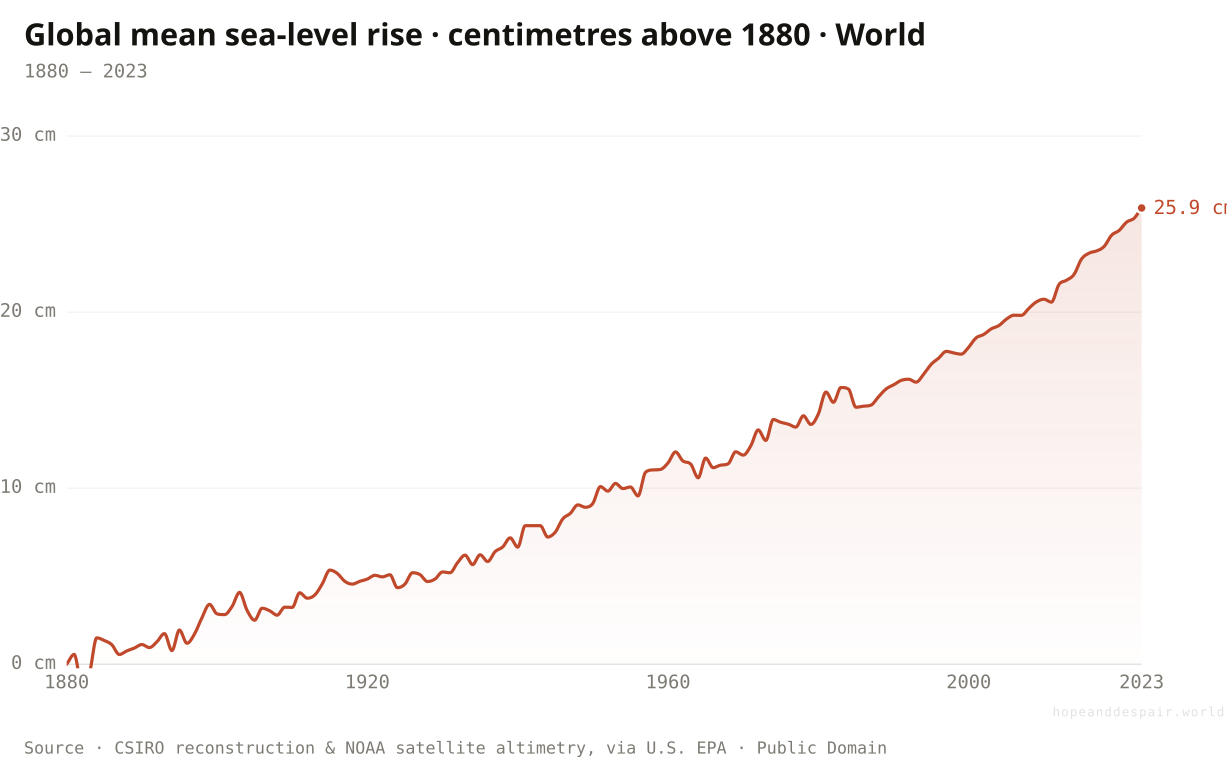
The sea sits about 26 centimetres higher than in 1880, and the Arctic’s summer ice has shrunk by roughly a third.
The heat has stopped being a number on a chart and started moving water. Global sea level has risen about 26 centimetres since 1880, a touch over a quarter of a metre, and the climb is speeding up: a slow tide-gauge creep through most of the 20th century has become a satellite-measured surge. The rise has two sources working at once. Ice runs off Greenland, Antarctica, and the world’s glaciers, and the ocean itself physically swells as it warms. A quarter-metre sounds like nothing until it shows up on a storm surge, at high tide, against a city whose walls were built for the old shoreline.
The clearest single fingerprint is at the top of the world. Each September the Arctic Ocean’s ice shrinks to its yearly minimum, and that minimum has fallen from about 7.0 million square kilometres in 1979 to 4.7 million in 2025. That is a loss of roughly a third, an expanse of vanished summer ice larger than Greenland. And it does not just record the warming, it adds to it. White ice bounces sunlight back to space; the dark open water that takes its place soaks that heat up instead, which melts more ice, a feedback the whole planet helps pay for.
Like the temperature and the carbon, these are global by nature: one sea, one polar cap, with no honest regional version to add, only the planetary lines themselves. They are the slow, heavy proof that everything in the charts above has crossed from forecast into measurement.
How this number was made
What it measures. Global mean sea-level rise (vs 1880), World
The Arctic’s end-of-summer ice has dropped by about a third since satellites began watching in 1979, from 7.0 to 4.7 million square kilometres. The dark water left behind absorbs the sunlight the ice once reflected, warming the region faster than anywhere else on Earth.
These are slow variables; there is still time to limit how far they go, and every tenth of a degree avoided is centimetres of sea and years of ice kept.
The rise is accelerating and effectively permanent on any human timescale — the sea and the lost ice will not come back for centuries, whatever we do next.
How fast Greenland and Antarctica come apart is the wildcard that could turn this slow rise into a fast one.
Where is the water in the rising sea coming from?
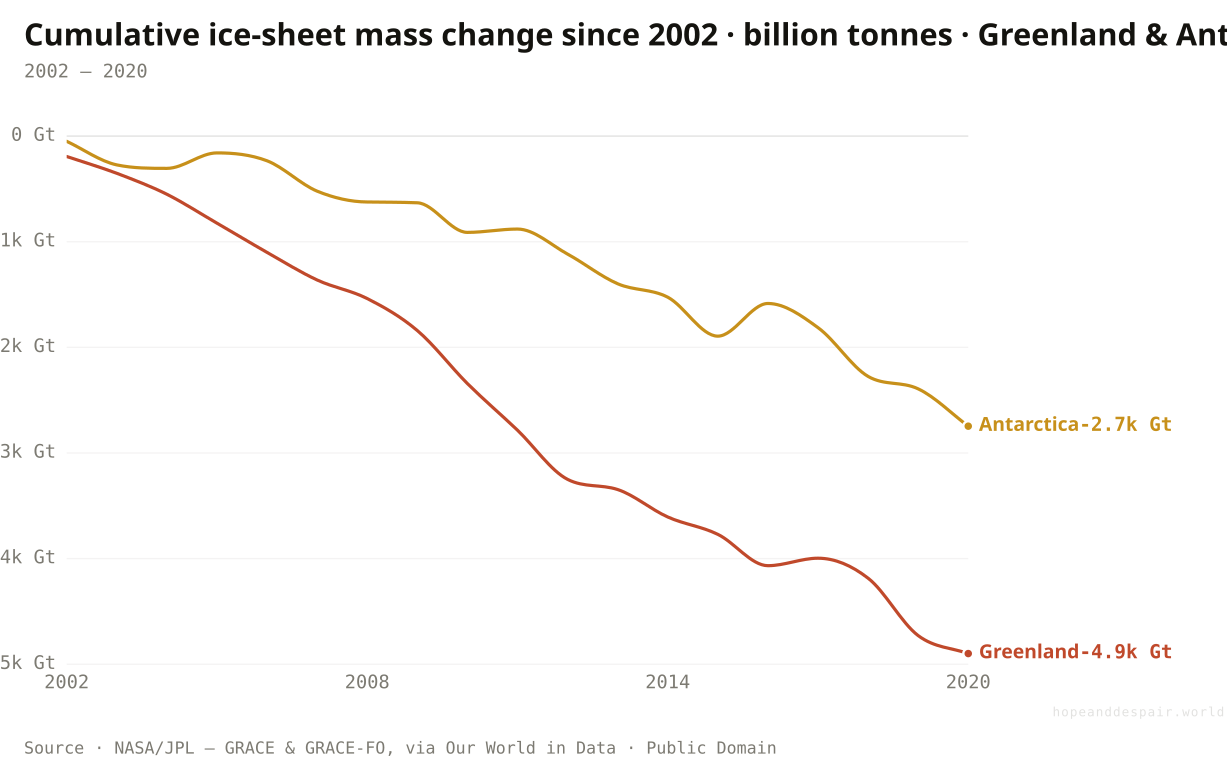
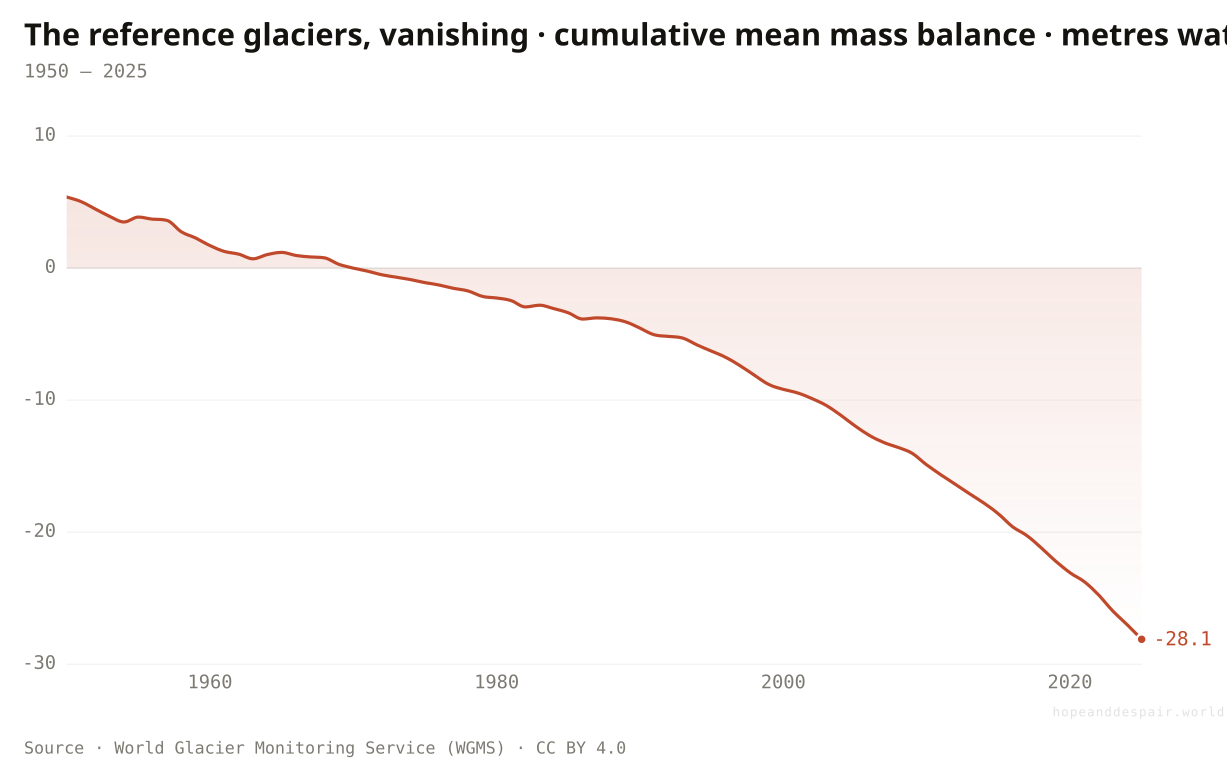
Greenland has shed about 4,900 billion tonnes of ice since 2002 and Antarctica about 2,700 — and the world’s reference glaciers are losing mass faster every decade.
Two satellites flew in formation for two decades and weighed the ice from orbit, and the answer is bleak. Since 2002, Greenland has lost roughly 4,900 billion tonnes of land ice and Antarctica about 2,700, on lines that barely pause. Antarctica’s record is the jumpier of the two, because its snowfall and melt fight each other year to year, but the trend underneath both points the same way: down, and not slowing.
The number is hard to feel, so try this. A billion tonnes is a cube of ice a kilometre on each side. Greenland has dropped close to five thousand of those into the ocean in twenty years, Antarctica nearly three thousand more. That water did not vanish; it is the sea in the chart before this one, a quarter-metre higher and climbing, arriving on coasts built for the old shoreline.
The ice sheets are the giants, but the smaller glaciers tell the cleanest story, because they have been watched the longest. The world’s reference glaciers held a small surplus in 1950, about five metres of water-equivalent above their later baseline. By 2025 they sat 28 metres below it, and the curve steepens decade by decade. These are the glaciers that feed rivers a billion people drink from. When they go, the meltwater spikes, then dwindles for good.
How this number was made
What it measures. Greenland ice-sheet mass change, World
The world’s monitored reference glaciers carried a small surplus through the 1950s and have fallen to about 28 metres of water-equivalent below their 1970 baseline, with the decline steepening every decade. These are the glaciers that feed the rivers of a billion people; their loss is first a flood, then a drought.
These changes are slow on a human clock, so the worst of them is still avoidable — every tenth of a degree held back is ice and rivers kept for the people downstream.
Both ice sheets are losing mass with no sign of slowing, the glaciers are melting faster each decade, and on any human timescale none of it comes back.
How fast Antarctica’s vast western sheet could come apart is the single largest unknown in the whole sea-level forecast — the difference between a slow rise and a sudden one.
Is all this warming actually killing more people?
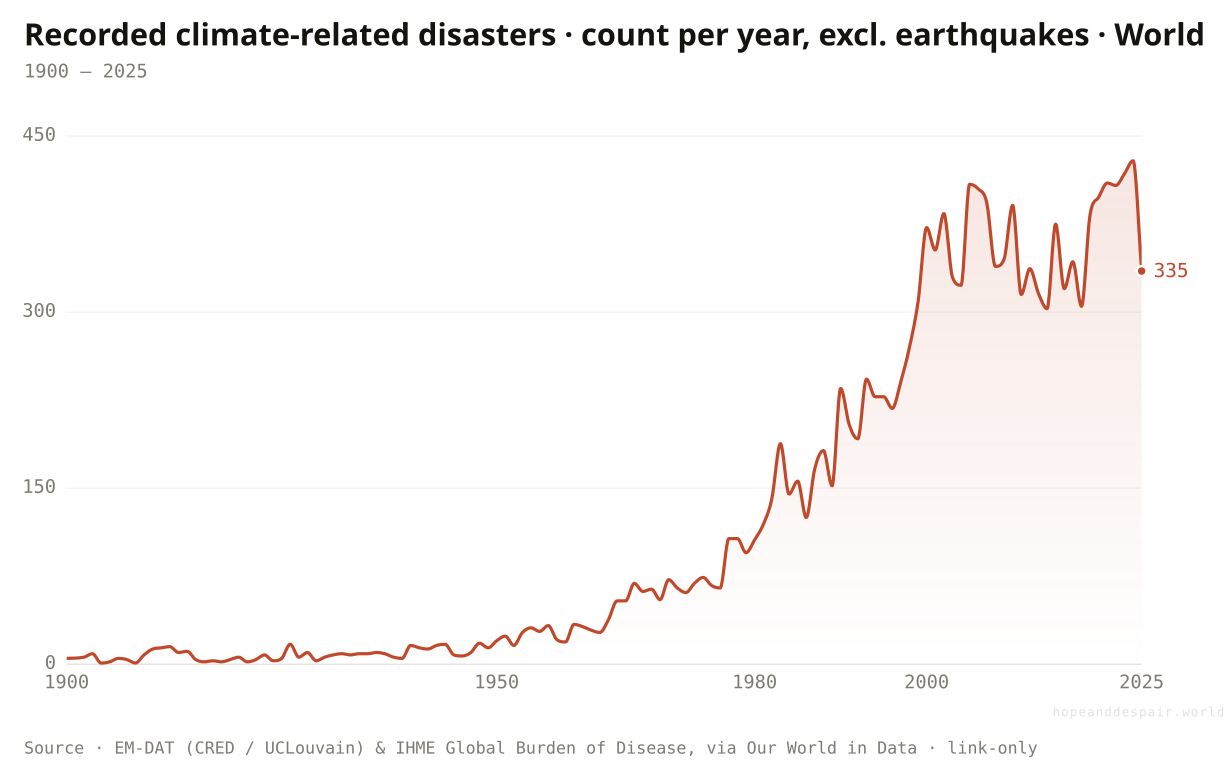
Recorded disasters have multiplied since 1900, but most of that is sharper record-keeping, and the death toll has not climbed with the count.
Logged climate-related disasters have gone from about five a year around 1900 to several hundred now, even after earthquakes are taken out. The obvious reading is a planet turning violent. The honest reading is quieter. For most of the 20th century there was no satellite watch and no global disaster database at all, so a flood that drowned a valley in 1920 often went uncounted while one today is logged within hours. The count even flattens after about 2000, once the recording caught up. Some of the recent rise in floods and heat is real and physically expected as the air warms. Much of the long climb is the world simply learning to see.
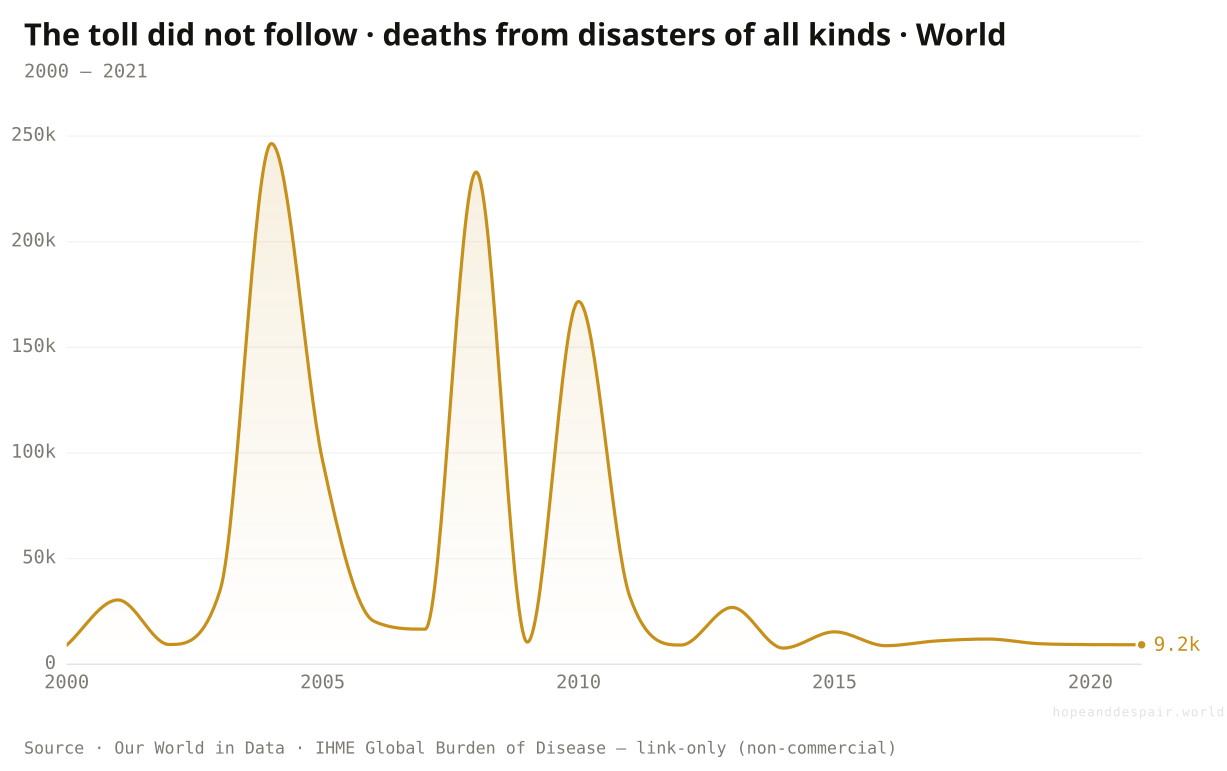
The number that should rise if the planet were turning lethal is the one that has not. Over the stretch measured well, 2000 to 2021, deaths from disasters of every kind start and end near nine thousand a year with no upward trend. The huge outliers that survive in the record are mostly geophysical, not weather: the tallest, roughly 246,000 in 2004, was the Indian Ocean earthquake and tsunami, and the next two, 2008 and 2010, were a cyclone-and-quake year and Haiti’s earthquake. As forecasting and evacuation have spread, a smaller share of those caught in a disaster die, and that gain has come fastest in poor places that once had no warning at all.
There is a hard edge under the relief. Fewer people die, yet more are exposed and more is destroyed each year, because we keep building on every coast and floodplain. And the bill, in lives and in money, falls heaviest on the countries near the bottom of the emissions chart. The people who burned the least carbon live where the heat arrives first. A falling death rate is a genuine win of preparation. It is not the same as being safe.
How this number was made
What it measures. Number of reported natural disasters in any given year. Note that the historical increase largely reflects improvements in data reporting, and should not be used to assess the total number of events.
Calculation. Selected entity All disasters excluding earthquakes.
The displayed line is monotone-cubic smoothed for legibility only — it never moves a data point.
Across 2000–2021, annual disaster deaths show no upward trend, starting and ending near nine thousand a year. The tallest spikes are geophysical, not weather: 2004’s Indian Ocean tsunami at roughly 246,000, then the cyclone-and-quake year of 2008 and Haiti’s 2010 earthquake. As warning and response have spread, far fewer of the people caught in a disaster die than a century ago, even as more are now exposed to begin with.
Far fewer people die in disasters than a century ago, because forecasting and evacuation have cut nature’s lethality, and fastest where it was deadliest.
More people and more wealth sit in harm’s way every year, and the losses land hardest on those who did least to warm the planet.
How much of the century’s rise in recorded disasters is real signal versus better counting is genuinely hard to pull apart.
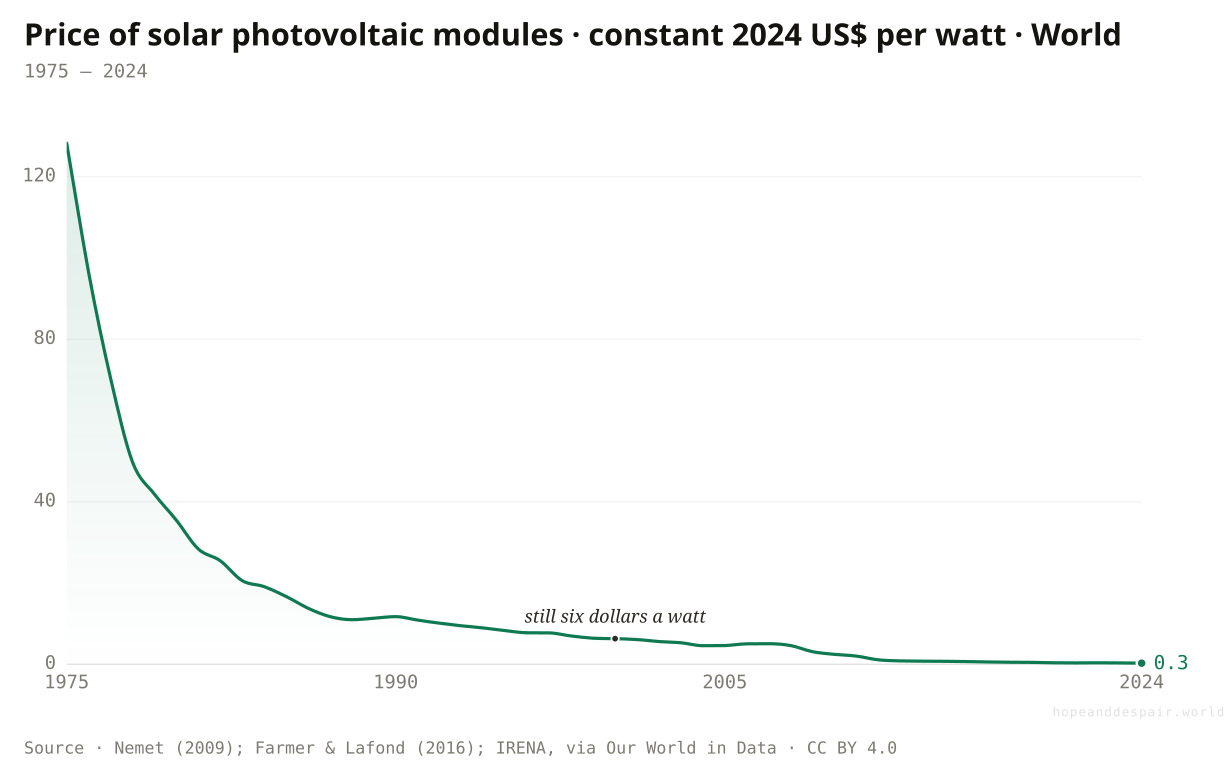
Has the cost of clean power actually fallen — and by how much?
A solar module cost about 128 dollars per watt in 1975 and about 26 cents in 2024, a fall of roughly five hundred times — one of the steepest sustained cost declines in the history of energy.
Almost everything else in this article climbs. This one drops, and it has dropped for half a century without turning back up. A watt of solar module ran about 128 dollars in 1975, when panels powered satellites and little else. By 2000 it was down to about six dollars, and by 2024 to roughly 26 cents — close to a five-hundred-fold collapse inside a single working life.
The reason is almost boring, which is why it is so reliable. A solar panel is a manufactured product, churned out on a line, not poured on-site like a dam or a reactor. Manufactured things ride a learning curve: each time the world’s cumulative output doubles, the price drops by a roughly fixed fraction, because factories get better at making the same thing again. Panels have doubled and redoubled so many times that the curve has run for fifty years without bending up. The clean choice quietly stopped being the expensive one.
A price chart is not a finished transition, and the rest of the hope act is about that gap. But this is the hinge everything else swings on. When the cheapest way to make a unit of power also happens to be the clean way, decarbonization stops depending on conscience and starts running on the same dull arithmetic that builds anything else. That arithmetic, finally, points the right direction.
How this number was made
What it measures. This data is expressed in US dollars per watt, adjusted for inflation.
Calculation. Selected entity World.
The displayed line is monotone-cubic smoothed for legibility only — it never moves a data point.
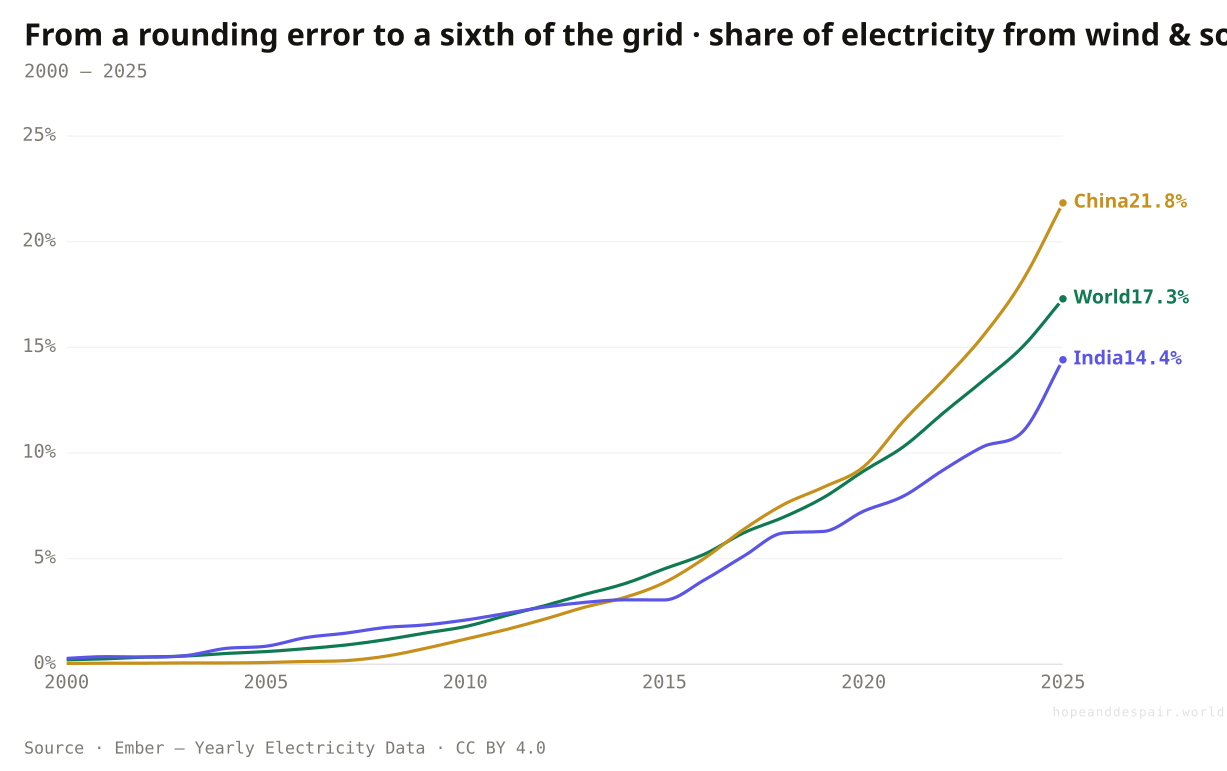
Wind and solar made about two parts in a thousand of the world’s electricity in 2000 and 17.3% in 2025, a sixth of the whole. The climb is steepest where power demand is growing hardest: China near 22%, India near 14%, both from almost nothing in 2000. The cheap machine and the fast deployment are the same story.
The cheapest new power on most of the planet is now the clean kind, and the fall is structural, not a subsidy or a fad — it runs on manufacturing, so it keeps going.
A falling price is not displaced coal; cheap panels added to the grid still let emissions hit a record, and electricity is only a fifth of the energy we burn.
How far the learning curve still has to run, and how fast cheap panels translate into retired fossil plants, are different questions with different answers.
Is the electricity we make getting cleaner — and is everyone moving at the same speed?
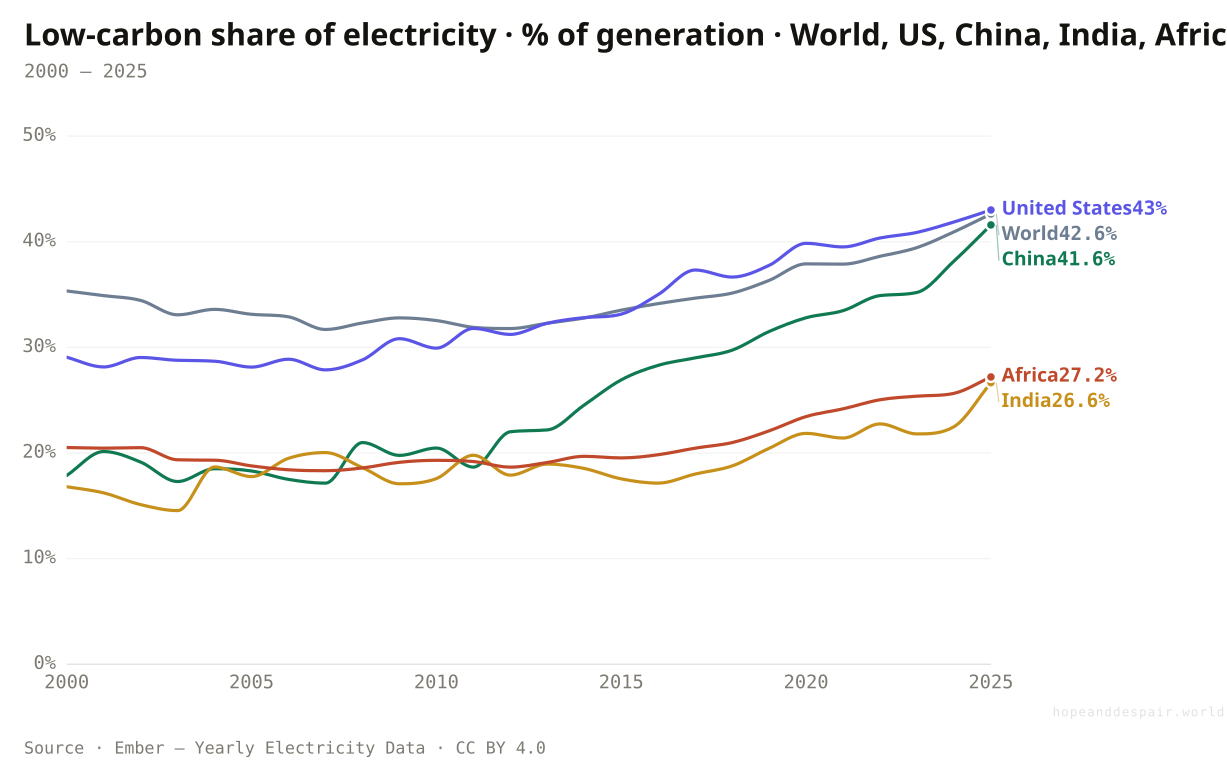
Low-carbon sources made about 35% of the world’s electricity in 2000 and roughly 43% in 2025. A real shift, but a slow one, and split four ways underneath.
The share of electricity that comes from sources other than burning fossil fuel — wind, solar, hydro, nuclear — has climbed, and it has climbed for the right reason: clean power got cheap. Across the world it went from about 35% in 2000 to roughly 43% in 2025. That is genuine motion in the direction everyone wants.
Now look at how little ground twenty-five years bought. The world line moved only about seven points across a quarter of a century, while electricity demand itself grew, so most of the new clean power went to feed growth rather than retire coal. The world average also hides four very different countries. The United States drifted from 29 to 43%, a steady creep. China is the leap: from about 18% in 2000 to nearly 42% in 2025, more than doubling its clean share while building more power than anyone. India sits lower and rises slower, from about 17 to 27%, the curve of a country still adding coal as fast as it adds solar.
Then there is Africa, and the trap of reading it on this chart at all. Its clean share went from about 21 to 27%, but the live question across much of the continent is not how clean the grid is. It is whether there is a grid. Where hundreds of millions still have no reliable electricity, a high clean percentage of a tiny amount is not the same victory it is elsewhere.
The catch sits over the whole figure. A clean grid is not a clean economy. Electricity is roughly a fifth of all the energy we burn; the trucks, the furnaces, the cement, the ships are barely on this chart. This is the most hopeful gauge in the climate system, and it has moved the world line seven points in a generation.
How this number was made
What it measures. Share of electricity from low-carbon sources, World
Calculation. Selected entity World.
The displayed line is monotone-cubic smoothed for legibility only — it never moves a data point.
Every line here points up, China has nearly doubled its clean share while becoming the world’s largest power producer, and the engine under all of it — cheap clean electricity — is permanent.
Twenty-five years moved the world line only about seven points, most new clean power fed rising demand instead of replacing coal, and electricity is just a fifth of the energy we burn.
A high clean share can mean a fast transition or an old dam and a missing grid, so the same number says opposite things in China and in much of Africa.
If clean power’s share is rising, why is fossil generation rising too?
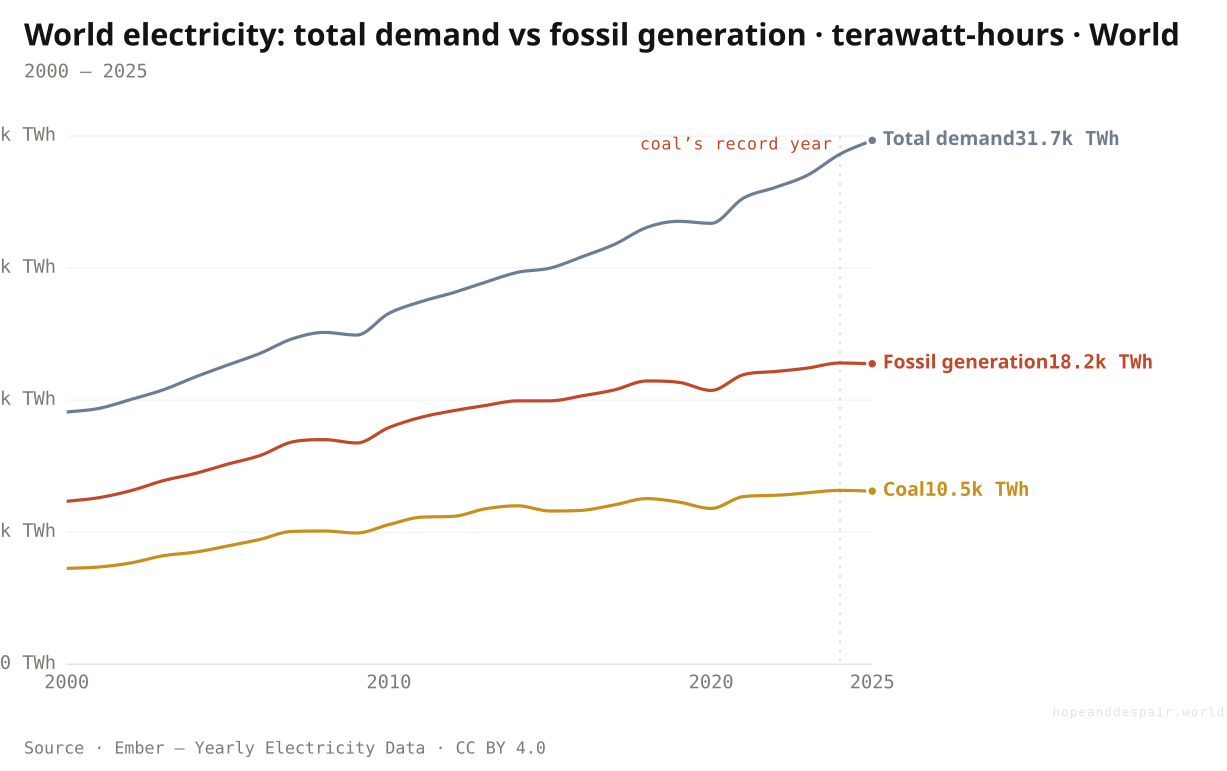
World electricity demand more than doubled since 2000, so fossil generation rose with it and coal hit a record in 2024 — even as the clean share climbed.
Clean power kept winning a bigger slice of a pie that kept getting bigger, and the bigger pie is the catch. World electricity demand went from about 15,300 terawatt-hours in 2000 to roughly 31,700 in 2025, more than double in a quarter-century, as billions of people plugged in air conditioners, factories, phones, and now data centres. Renewables took a rising share of that growth. They did not take all of it.
So the fossil line rose anyway. Generation from coal, gas, and oil climbed from about 9,900 terawatt-hours in 2000 to a peak near 18,300 in 2024, and coal alone set an outright record of roughly 10,500 terawatt-hours that same year — the dirtiest fuel at its highest output ever, in the very decade solar got cheap. The clean machine was mostly bolted on top of demand, not subtracted from the coal underneath it.
This is the keystone of the whole transition argument, and it is why the share chart and the tonnage chart can both be true and feel like opposites. By share, clean energy is unmistakably winning. By absolute output, fossil generation is near its all-time high. 2025 is the first hint of a turn — fossil and coal both ticked very slightly down — but one soft year is not a peak. Until the fossil line bends clearly and stays bent, the carbon keeps coming, whatever the share says.
How this number was made
What it measures. Electricity demand, World
Calculation. Selected entity World.
The displayed line is monotone-cubic smoothed for legibility only — it never moves a data point.
The fossil and coal lines both edged down in 2025 for the first time in years, a sign that clean supply may finally be catching demand growth.
Fossil generation sits near an all-time high and coal set an outright record in 2024 — the rising clean share has so far been added on top, not subtracted from the burn.
Whether 2025’s small dip is a genuine peak or a one-year wobble will only be clear once demand growth and clean build-out are weighed against each other over several more years.
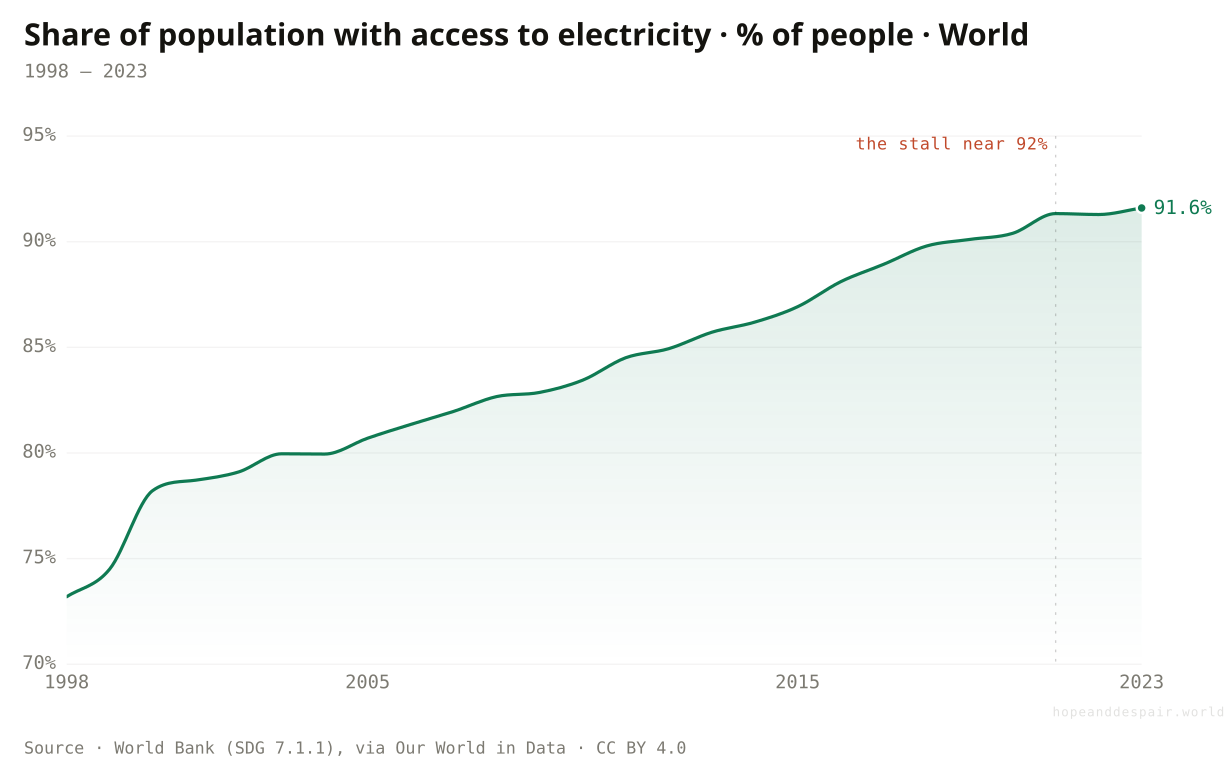
Has everyone been reached by the grid yet — and is the gap still closing?
The share of the world with electricity climbed from 73 to 92 percent in a generation, then stalled there, leaving roughly one person in twelve still without any power at all.
Most of the planet got plugged in fast. In 1998 about 73 percent of people had electricity — enough for a light, a charged phone, a radio for a few hours; by 2023 that reached 91.6 percent. Hundreds of millions of homes went from dark to lit inside twenty-five years, a quieter victory than cheaper solar but a real one, and the precondition for almost everything else: refrigeration, schoolwork after dusk, a clinic that can store a vaccine.
Then the line flattened against a ceiling. Access sat at 91.3 percent in 2021, 91.3 again in 2022, 91.6 in 2023 — barely moving. The early gains were the easy ones, towns and dense villages a wire could reach. What is left is the hard remainder: about 8 percent of humanity, roughly one in twelve people, in places a grid struggles to follow. Remote, scattered, often poor, often at war.
Who they are matters more than the number. The unconnected are concentrated in the poorest parts of Sub-Saharan Africa and in conflict zones, the same regions barely visible on the emissions and clean-power charts. For most of this article the question has been clean power versus dirty. For these households it is power versus none — a lamp at all, before anyone argues about how it is made. The transition that the rest of the page debates has not yet reached the people who would gain the most from any of it.
How this number was made
What it measures. Access to electricity means having an electricity source that can provide very basic lighting, and charge a phone or power a radio for 4 hours per day.
Calculation. Selected entity World.
The displayed line is monotone-cubic smoothed for legibility only — it never moves a data point.
Nearly the whole world reached electricity inside a single generation, from less than three-quarters to more than nine in ten — the floor under modern life laid almost everywhere.
The climb has stalled near 92 percent, and the people still in the dark are the hardest to reach: the poorest of Sub-Saharan Africa and those caught in conflict, for whom clean power is not yet even the question.
Whether off-grid solar finally closes the last gap faster than grids ever could, or whether that remainder stays stuck for decades, is genuinely unsettled.
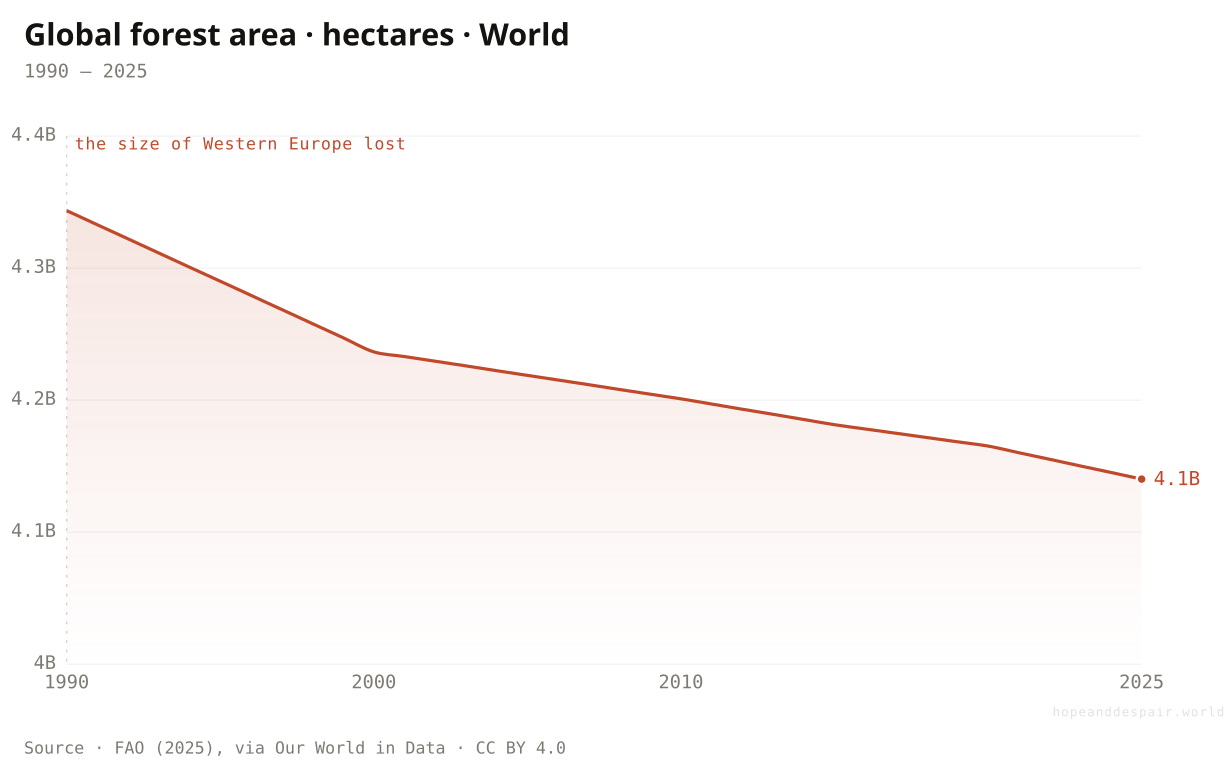
Carbon goes up. Can the land pull any of it back down?
The world has lost about 200 million hectares of forest since 1990, but the map splits in two: the tropics are falling while China, India, and Europe are greening.
There are two ways to cut the carbon in the air. Stop adding it, which is every chart before this one. Or pull some back out, and the cheapest machine for that is a growing tree. A forest breathes CO₂ in; a cleared or burned one breathes it straight back. On the world ledger the lever is sliding the wrong way, though slowly. The planet held about 4.34 billion hectares of forest in 1990 and about 4.14 billion in 2025, a net loss near 200 million hectares. That is roughly the whole land area of Western Europe, gone in one human generation.
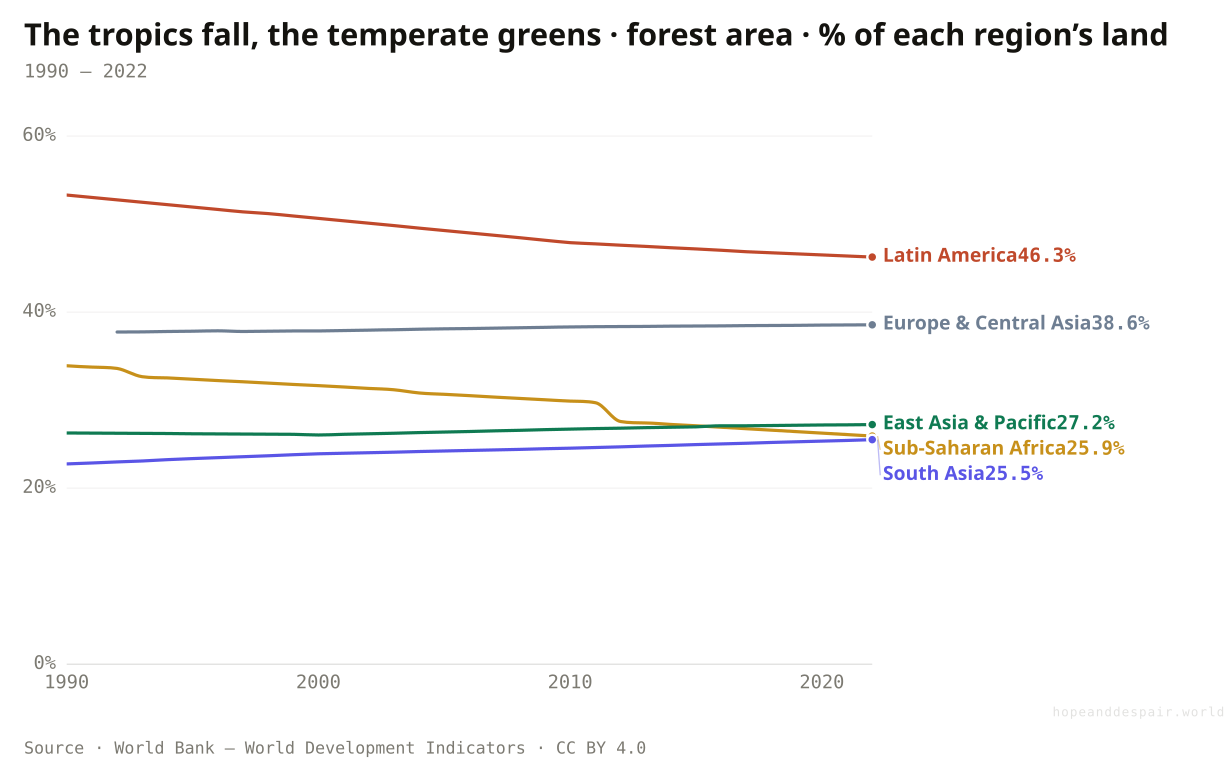
The near-flat global line is not a calm middle. It is two opposite worlds cancelling out on the page. In the tropics the forest is falling hard: across Latin America the forested share of land slid from about 53 percent in 1990 to 46 by 2022, and across Sub-Saharan Africa from 34 to 26, the Amazon and the Congo basin cleared for cattle, soy, and farmland. At the same time the temperate and Asian world is quietly regrowing. South Asia rose from about 23 to 26 percent on the back of India’s planting drives, East Asia and the Pacific edged from 26 to 27 with China’s reforestation, Europe and Central Asia held near 38 as abandoned farmland filled back in with trees.
Here is the catch under the hopeful lines. A hectare regained is not a hectare lost undone. The forest disappearing near the equator is old and dense, full of species found nowhere else; much of what replaces it elsewhere is young, often a planted single-species stand. They do not store the same carbon or shelter the same life. The greening is real and worth having. It is no fair trade for what is being cleared.
How this number was made
What it measures. Forest area is land under natural or planted stands of trees of at least 5 meters in situ, whether productive or not, and excludes tree stands in agricultural production systems.
Calculation. Selected entity World.
The displayed line is monotone-cubic smoothed for legibility only — it never moves a data point.
Latin America and Sub-Saharan Africa have lost forest steadily since 1990, the Amazon and the Congo. South Asia, East Asia, and Europe have gained it through planting and farmland regrowing. The flat world line is the sum of these opposite trends, not a quiet stability.
Forest loss is slowing, several large countries have turned net-greener, and a standing forest is one of the cheapest carbon stores we have.
The forest still vanishing is the carbon-dense tropical kind, and a young plantation elsewhere is no fair trade for cleared old growth.
How much carbon the world’s forests will hold versus release as they dry out and burn is one of the larger unknowns in the whole system.
How far is the carbon line from the one that would hold 1.5°C?
To stay near 1.5°C the world needed to cut emissions about 45 percent below 2010 by 2030; instead they rose to a record 38.6 billion tonnes.
There is a line emissions were supposed to be following, and it runs the opposite way from the one they took. The IPCC’s 1.5°C report set out the arithmetic plainly: to keep warming near 1.5°C, global CO₂ had to fall roughly 45 percent below its 2010 level by 2030, then reach net zero around mid-century. Start from the 33.3 billion tonnes the world emitted in 2010 and that path drops to about 18 billion by 2030 and to nothing by 2050.
Now lay the real line beside it. Far from falling, emissions kept climbing, to a record 38.6 billion tonnes in 2024. The needed line bends steeply down; the actual line still points up. The space between them, widening every year, is the whole argument of this article rendered as a single picture. One curve is what physics asked for. The other is what we did.
The dashed pathway is not a forecast, and it is not the only route; it is one illustrative line from the IPCC’s own scenarios, drawn here to give the record number something honest to be measured against. Read it that way. The gap is not destiny, because the cheap clean machine that could close it now exists. But on the only number that finally decides the climate, the distance left to fall is the entire job, and as of 2024 it has not started.
How this number was made
What it measures. Annual total emissions of carbon dioxide (CO₂), excluding land-use change, measured in tonnes.
Calculation. Selected entity World.
The displayed line is monotone-cubic smoothed for legibility only — it never moves a data point.
The pathway is achievable arithmetic, not fantasy — the clean technology to follow it is now the cheapest power on Earth, so the gap is one of will and speed, not of tools.
The window the IPCC drew runs through 2030 and the line was supposed to be already falling steeply; instead it hit a record in 2024, leaving the entire descent still ahead with almost no time.
There is no single 1.5°C line — the IPCC modelled many, trading earlier cuts against later carbon removal — so exactly how far behind we are depends on which honest version you pick.
And who actually pays for all of it?
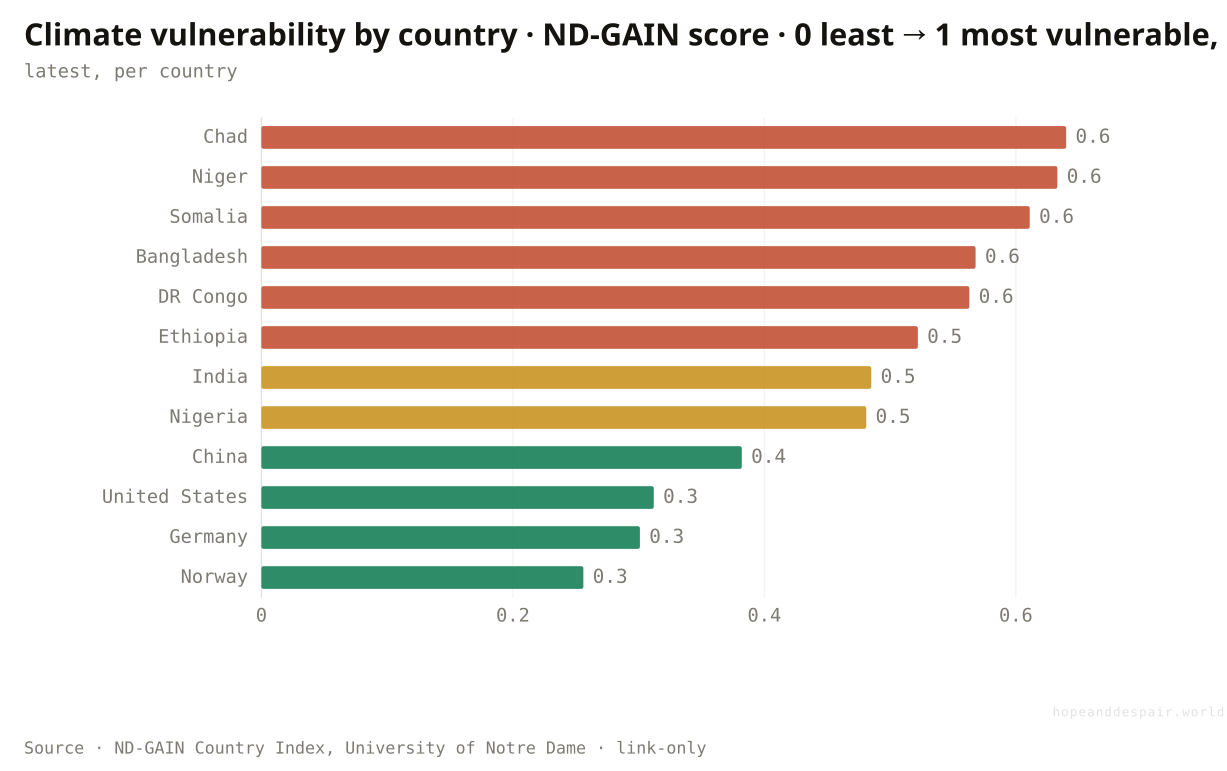
The countries most exposed to a warming world are almost exactly the ones that did least to warm it.
Lay the two maps side by side and they are near-mirror images. The ND-GAIN index scores how exposed each country is to climate change and how poorly equipped it is to cope, across food, water, health, ecosystems, homes, and infrastructure. At the top of the danger list sit Chad, Niger, Somalia, Bangladesh, and the Democratic Republic of Congo. At the safe end sit Norway, Germany, and the United States, scoring less than half as vulnerable.
Now read the carbon those same people emit. Someone in DR Congo or Ethiopia puts out about a tenth of a tonne of CO₂ a year, a Nigerian six tenths, an Indian a little over two, against an American’s 14 and a German’s nearly 7. The places first in line for the floods, the failed harvests, and the unlivable heat are the places that burned almost nothing to bring it on. The warming was made in the rich, temperate world and is collected, with interest, in the poor and tropical one.
This is the inequality sitting underneath every other chart on the page. The atmosphere mixes one shared blanket of carbon for all eight billion of us, but the harm does not land evenly, the heat itself does not even rise evenly (the land and the high latitudes run hottest, Fig. 14), and the means to defend against it track the very wealth that came from burning the carbon in the first place. Of everything here, this is the part already decided.
How this number was made
What it measures. ND-GAIN vulnerability score (exposure + sensitivity + adaptive capacity across food, water, health, ecosystems, habitat, infrastructure), 2023, a curated spread sorted descending. Link-only: charted and cited, not re-hosted.
Calculation. 2023 vulnerability score, 12 curated countries sorted descending.
Read the two bars together. The countries at the top of the vulnerability chart — DR Congo, Ethiopia, Nigeria — sit at the very bottom of this one, emitting a fraction of a tonne each, while the least-vulnerable countries emit seven to fourteen tonnes a head. Exposure and responsibility run almost exactly opposite.
Because the gap is about money and preparation, not fate, it is also fixable: adaptation finance and early warning can blunt the harm faster and cheaper than almost anything else.
The people who did least to cause the warming will suffer it first and worst, and much of that is already locked in whatever the world does next.
Vulnerability indices fold dozens of judgements into one number, so the exact ranking is arguable even where the overall pattern is not.
The carbon, the heat, the sea, the ice — every measure of the problem is still pointing the wrong way and most of them are accelerating. The only thing accelerating in our favour is the price of the cure.— The whole argument, in one line
One question, read by the fields that actually study it. Each voice is given both its most hopeful and its darkest honest reading — with a note on how settled the evidence underneath is.
the hopeful readThe physics is settled and the warming is measured to a tenth of a degree, which means the problem is fully understood and, in principle, fully solvable by us.
the darker readWhat the atmosphere integrates is the total carbon, and that is still rising; the ocean and ice have banked enough heat to keep things moving for decades whatever we do.
the hopeful readThe cost of clean power has collapsed past the point of return — the cheapest new electricity on Earth is now the clean kind, and that is permanent.
the darker readCheap panels are not a finished transition: clean has been added on top of fossil fuel, not yet subtracted from it, and most of energy isn’t electricity at all.
the darker readA global average of 26 centimetres means nothing to me when it arrives on a king tide through my front door. The sea is already taking the land my family farmed.
the hopeful readFalling costs have done what thirty years of treaties could not: made the clean choice the self-interested one, which is the only kind that scales.
the darker readEvery country can point at another’s chart — total versus per person, historical versus current — and the carbon keeps rising in the gap between those arguments.
the hopeful readWe are the first generation with both the proof and the cheap tools to act, and the carbon we don’t emit is a gift to people not yet born.
the darker readThe people who emitted least will suffer most, and the people who will suffer most are not yet alive to be asked.
Strongest case for hope
The long arc is grim, but the thing that bends the arc is finally moving. Clean power has gone from a moral luxury to the cheapest electricity on the planet, scaling faster than any energy source in history, and the rich world’s emissions are genuinely falling. The global rise in emissions has slowed from exponential toward flat, several large economies have peaked and turned down, and even forests are being lost more slowly while whole regions regrow. The science is settled enough to act on, and the tools to act are now cheap enough to use out of self-interest. None of the damage is locked at its worst; every tenth of a degree avoided is sea and ice and habitat kept. The escape route exists, it is open, and for the first time it is the affordable one.
Strongest case for despair
Almost every gauge of the problem is still climbing, and most are accelerating. CO₂ is at 426 parts per million, the highest in millions of years, with methane and nitrous oxide rising on top; the world is about 1.3°C hotter and brushing the 1.5°C line decades early; emissions hit a record 38.6 billion tonnes. The damage is no longer a forecast: the sea is up a quarter-metre and rising faster, the Arctic has lost a third of its summer ice, Greenland and Antarctica have shed thousands of billions of tonnes of ice, the reference glaciers are vanishing, and the ocean has soaked up enough heat to keep the warming coming whatever we do next. The bill falls hardest on the people who emitted least. And the one bright act, the energy turn, reaches only the fifth of energy that is electricity, where clean power has mostly been added on top of fossil fuel rather than replacing it — which is exactly why coal hit a record and the carbon line still rose. A cheaper cure does no good until it is used faster than the disease spreads, and on the only number that ultimately counts, it is not yet.
The verdict turns genuinely hopeful the year global CO₂ emissions clearly peak and begin to fall, and keep falling: not the share of clean electricity, but the absolute tonnage in Fig. 6.
Watch Asia, and China above all, since its choices alone can bend or hold the global line. Watch whether the clean-power surge starts replacing coal rather than merely adding to it, and whether it spreads from electricity into transport, heat, and heavy industry.
It turns darker if the great ice sheets destabilize faster than expected, if forest loss reaccelerates, or if warming feedbacks such as thawing permafrost and dying forests start adding carbon we did not emit. The single number to watch is the emissions line, and the single date that matters is the year it turns down for good.
Everything done to the numbers between the source and the chart, disclosed in full. Where a choice is editorial rather than measured, we say so.
- Temperature anomaly & baseline
- The deviation of global surface temperature from the 1951–1980 average, the standard scientific reference. The world line is shown from two independent records: NASA GISTEMP v4 (public domain), built from surface thermometers, and the Copernicus/ECMWF ERA5 reanalysis (C3S, via the Climate Pulse service), which blends observations with a weather model. ERA5 is published daily; here it is averaged to complete calendar years and re-expressed against the 1951–1980 baseline (computed from its own data) so it overlays GISTEMP — they agree to within about a tenth of a degree. The land and land-and-ocean split is Berkeley Earth (CC BY), on the same baseline; its annual record currently runs one year behind the others. Pre-industrial (1850–1900) is about 0.2°C below this baseline, so add roughly that to compare with the Paris +1.5°C and +2°C targets.
- Why concentration and temperature are global-only
- CO₂ is a well-mixed gas — it spreads through the whole atmosphere within a year or two, so concentration is genuinely a single global number with no regional version to show. Global mean temperature is the standard climate metric for the same reason; its uneven distribution is shown instead through the land-versus-ocean cut.
- CO₂ emissions (annual, cumulative, per-person, consumption-based)
- All from the Global Carbon Budget (2025) via Our World in Data, in tonnes (CC BY). Annual = production-based emissions, counted where emitted. Cumulative = the running total since 1750, the stock of historical responsibility. Per-person = annual divided by population. Consumption-based = production plus the carbon embodied in imports, minus exports — the offshoring-adjusted footprint. World plus the six continental aggregates and a country bar for each.
- The other greenhouse gases
- Methane (CH₄) and nitrous oxide (N₂O) emissions in CO₂-equivalent tonnes, from Jones et al. (2025) / Global Carbon Project via Our World in Data (CC BY). Their atmospheric concentrations (parts per billion) are NOAA Global Monitoring Laboratory annual global means (public domain) — well-mixed gases, so global-only like CO₂.
- Emissions by sector
- Greenhouse gas emissions split across ten sectors (electricity & heat, transport, agriculture, manufacturing, buildings, industry, land use, waste, fugitive, aviation & shipping), Climate Watch (2026) via Our World in Data (CC BY), in CO₂-equivalent tonnes. Land-use can be negative where regrowth absorbs more carbon than clearing releases.
- Carbon intensity
- CO₂ emissions per dollar of GDP (kilograms per international-$), Global Carbon Budget and the Maddison Project via Our World in Data (CC BY). A ratio, not a total: it can fall every year while emissions still rise, if the economy grows faster than intensity falls.
- Ocean heat content
- Heat stored in the upper 2,000 m of the world ocean, in 10²² joules, NOAA NCEI (public domain), 2005 onward. The ocean has absorbed more than 90% of the planet’s extra heat, so this is the most complete single measure of warming, even on a short record.
- Ice sheets and glaciers
- Greenland and Antarctica cumulative mass change since 2002 (billion tonnes) from NASA/JPL’s GRACE & GRACE-FO satellites via Our World in Data (public domain); the daily series is taken to its year-end value. Reference-glacier mass balance (metres water equivalent, relative to 1970) is the World Glacier Monitoring Service (CC BY).
- Uneven warming
- Country and continental temperature anomaly versus the 1991–2020 baseline (a more recent reference than the 1951–1980 used elsewhere, so the numbers read smaller), from Copernicus/ECMWF ERA5 via Our World in Data. Shows the Arctic amplification: high-latitude land warms far faster than the tropics.
- The energy transition
- Electricity by source (Ember, CC BY): wind-and-solar and low-carbon shares, demand, fossil and coal generation, World and by country. Solar module price is Lafond et al. / IRENA via OWID; electricity access is the World Bank. The 1.5°C pace path is drawn from the IPCC Special Report on 1.5°C (a 45% cut from 2010 by 2030, net-zero around 2050), cited, not re-hosted. A companion article, “Is the green transition actually happening?”, treats the energy transition in greater depth.
- The gaps we don’t chart
- Three climate dimensions are named in prose but not charted, because the open data can’t honestly support a global picture: heat extremes (no clean country-level dataset exists), ocean acidification (the long open-ocean record is a single Hawaii station), and crop yields (global yields keep rising on fertiliser and breeding, so a yield chart would read as good news and bury the climate signal). Climate vulnerability (ND-GAIN) is cited for the responsibility movement but its licence is unclear, so it is link-only — quoted, not re-hosted.
- Arctic sea ice
- Sea-ice extent at the September minimum — the end of the northern melt season — from the U.S. National Snow and Ice Data Center’s Sea Ice Index (public domain), 1979 onward, when reliable satellite monitoring began.
- Disasters & their toll (link-only)
- Recorded climate-related disasters (excluding earthquakes) are from EM-DAT (CRED / UCLouvain); deaths from disasters of all kinds are from the IHME Global Burden of Disease. Both licences permit charting and citation but not re-hosting, so these two carry no download. Disaster counts are strongly shaped by how completely events were recorded — coverage was sparse before the late 20th century — so the long rise blends a real signal with a large reporting effect; read the trend, not the precise count. The death series runs 2000–2021 and is dominated in spike years by geophysical events (the 2004 tsunami).
- Forests
- The world line is total forest area in hectares (FAO via Our World in Data, to 2025); the regional lines are forest as a share of each region’s land (World Bank, to 2022). The two differ in unit and vintage, flagged at the figure. Neither distinguishes carbon-dense old growth from young or planted forest, which matters for both carbon and biodiversity.
- The composite verdict
- The headline verdict and the hope / despair / confusion reading on each chart are an editorial synthesis of the evidence, not a calculated score. Every underlying series is real, ingested, validated, and individually sourced and downloadable.
- Global Carbon Budget (2025) — globalcarbonproject.org/carbonbudget ↗ · CC BY 4.0 · vintage 2025Annual, cumulative, per-person, and consumption-based CO₂, and CO₂ intensity of GDP; world, continents, and countries; via Our World in Data.
- Jones et al. (2025) — National Contributions to Climate Change / Global Carbon Project — ourworldindata.org/grapher/methane-emissions ↗ · CC BY 4.0 · vintage 2025Methane (CH₄) and nitrous oxide (N₂O) emissions in CO₂-equivalent tonnes, world and by country; via Our World in Data.
- Climate Watch (2026) — greenhouse gas emissions by sector — ourworldindata.org/grapher/ghg-emissions-by-sector ↗ · CC BY · vintage 2026GHG emissions split across ten sectors, world and by country; via Our World in Data.
- NOAA Global Monitoring Laboratory — CH₄ & N₂O concentration — gml.noaa.gov/ccgg/trends ↗ · Public Domain (US Government) · vintage 2026Globally-averaged annual mean methane and nitrous oxide concentration, parts per billion.
- NOAA NCEI — Global Ocean Heat Content (0–2000 m) — www.ncei.noaa.gov/access/global-ocean-heat-content ↗ · Public Domain (US Government) · vintage 2026World-ocean heat content anomaly, 0–2000 m, 10²² joules, 2005 onward (Levitus et al.).
- NASA/JPL — GRACE & GRACE-FO ice-sheet mass — climate.nasa.gov/vital-signs/ice-sheets ↗ · Public Domain (US Government) · vintage 2026Cumulative Greenland and Antarctica ice-sheet mass change since 2002, billion tonnes; via Our World in Data.
- World Glacier Monitoring Service — reference-glacier mass balance — wgms.ch ↗ · CC BY 4.0 · vintage 2026Cumulative mass balance of the global reference glaciers, metres water equivalent, relative to 1970.
- Our World in Data — Atmospheric CO₂ concentration — ourworldindata.org/grapher/co2-long-term-concentration ↗ · CC BY 4.0 · vintage 2026Modern instrumental record (NOAA) spliced with EPICA Dome C ice cores for the deep baseline.
- NASA GISS — GISTEMP v4 — data.giss.nasa.gov/gistemp ↗ · Public Domain (US Government) · vintage 2026Global surface temperature anomaly vs 1951–1980; the world hero line.
- Copernicus Climate Change Service (C3S) / ECMWF — ERA5 — pulse.climate.copernicus.eu ↗ · Copernicus licence (free reuse with attribution) · vintage 2026Global 2 m temperature reanalysis, via the ECMWF Climate Pulse service; daily, averaged to annual and re-baselined to 1951–1980 to overlay GISTEMP. The most current of the records shown.
- Berkeley Earth — Land/Ocean Temperature Record — berkeleyearth.org/data ↗ · CC BY 4.0 · vintage 2026Rohde & Hausfather (2020). Land-only and land-and-ocean anomalies on the same 1951–1980 baseline; the land-versus-sea cut.
- CSIRO & NOAA — Global mean sea level, via U.S. EPA — www.epa.gov/climate-indicators/climate-change-indicators-sea-level ↗ · Public Domain · vintage 2024CSIRO tide-gauge reconstruction (1880–) joined to NOAA satellite altimetry (1993–) on a shared 1880 datum.
- National Snow and Ice Data Center — Sea Ice Index v3 — nsidc.org/data/seaice_index ↗ · Public Domain · vintage 2026Arctic sea-ice extent at the September minimum, 1979 onward; reached via the Our World in Data grapher.
- FAO — Forest area, via Our World in Data — ourworldindata.org/grapher/forest-area-km ↗ · CC BY 4.0 · vintage 2025Global forest area in hectares, FAO Forest Resources Assessment.
- World Bank — Forest area (% of land area, AG.LND.FRST.ZS) — data.worldbank.org/indicator/AG.LND.FRST.ZS ↗ · CC BY 4.0 · vintage 2025Forest as a share of land area, by World Bank region; the regional cut, FAO data via the World Bank.
- Our World in Data — Solar PV module prices (Lafond et al. / IRENA) — ourworldindata.org/grapher/solar-pv-prices ↗ · CC BY 4.0 · vintage 2026Learning-curve price series; the engine under the renewables surge.
- Ember — Yearly Electricity Data — ember-energy.org/data/yearly-electricity-data ↗ · CC BY 4.0 · vintage 2026Electricity by source — wind & solar and low-carbon shares, demand, fossil and coal generation; world and by country. The energy act.
- World Bank — Access to electricity (EG.ELC.ACCS.ZS) — data.worldbank.org/indicator/EG.ELC.ACCS.ZS ↗ · CC BY 4.0 · vintage 2026Share of population with electricity access, world; via Our World in Data.
- IPCC — Special Report on Global Warming of 1.5°C (link-only) — www.ipcc.ch/sr15 ↗ · © IPCC — cited with attribution, not re-hosted · vintage 2018The 1.5°C pace path: ~45% emissions cut from 2010 by 2030 and net-zero CO₂ around 2050. Drawn as a cited benchmark, not a re-hosted dataset.
- ND-GAIN — Notre Dame Global Adaptation Initiative Country Index (link-only) — gain.nd.edu/our-work/country-index ↗ · licence unclear — link-only · vintage 2024Country climate-vulnerability and readiness scores. Charts the closing figure; Chad, Somalia, and Bangladesh rank most exposed, Norway and Switzerland least. Quoted, not re-hosted.
- EM-DAT — International Disaster Database, CRED / UCLouvain (link-only) — www.emdat.be ↗ · restricted — link-only · vintage 2025Recorded climate-related disasters (excl. earthquakes), via Our World in Data. Terms forbid re-hosting, so the chart is shown and cited but carries no download.
- IHME — Global Burden of Disease 2021 (link-only) — vizhub.healthdata.org/gbd-results ↗ · IHME Free-of-Charge Non-Commercial — link-only · vintage 2021Deaths from natural disasters, World, 2000–2021, via Our World in Data. Non-commercial licence, so charted and cited but not re-hosted.
- IEA — CO₂ Emissions / World Energy Outlook (link-only) — www.iea.org/topics/global-energy-transitions ↗ · restricted — link-only · vintage 2025Sectoral emissions and energy projections; restricted terms, cited not re-hosted.
Cite this page
Reference
Hope & Despair. “Is the climate stabilizing or breaking?.” Hope & Despair, 2026. https://hopeanddespair.world/questions/is-the-climate-stabilizing-or-breaking.
BibTeX
@misc{hopeanddespair:is-the-climate-stabilizing-or-breaking,
  author       = {{Hope & Despair}},
  title        = {{Is the climate stabilizing or breaking?}},
  year         = {2026},
  howpublished = {\url{https://hopeanddespair.world/questions/is-the-climate-stabilizing-or-breaking}},
  note         = {hopeanddespair.world, updated 2026-06-14}
}
Original prose, code, and chart designs are released under CC BY 4.0 ↗ — reuse freely with attribution. Source datasets keep their own licences, listed above. Add your access date when citing.
- Mobile-first chart system + redesign branch snapshot View diff →
- Scaffold the static-first Astro site (foundation milestone) View diff →
Generated from the commit history — every edit to a number, a word, or a chart is tracked in the open. Browse the full history & diffs on GitHub →
in plain words
Still lost? Read this.
Here is the whole thing in plain words. We dug up the buried carbon of ancient forests and burned it, and the carbon dioxide in the air went from 278 parts per million before the industrial age to 426 today — the most in millions of years, and most of that rise happened just since 1950. That extra gas traps heat, and the planet is now about 1.3°C warmer than it was in the mid-20th century, which is close to the 1.5°C line the whole world agreed to try to stay under. The land is hotter still, because the slow oceans soak up most of the heat.
The heat is no longer a forecast. The sea is a quarter of a metre higher than in 1880 and rising faster; the Arctic has lost about a third of its summer ice, an area bigger than Greenland. And the thing that drives all of it — the carbon we put out each year — just hit an all-time record of 38.6 billion tonnes. That number is the one that really matters, and it has not yet started to fall.
But there is one piece of genuinely good news, and it is big. The price of solar power fell about five hundred times over since the 1970s, so clean electricity went from a moral luxury to the cheapest power you can build almost anywhere. Wind and solar went from nothing to a sixth of the world’s electricity in a single generation. For the first time, the clean choice is also the cheap choice — which is the only kind of choice that ever really scales.
And it lands unfairly. The warming is not the same everywhere — high-latitude places like Canada and Russia are heating about twice as fast as the world average — and the countries first in line for the floods, droughts, and killing heat are the poorest, who burned almost none of the carbon. A person in the Democratic Republic of Congo emits about a tenth of a tonne a year; an American, fourteen. The bill is being sent to the people who did least to run it up.
So is the climate stabilizing or breaking? Breaking, on every physical measure, and in places faster than expected. But the tool that could stop it has finally become cheap and is spreading fast. The honest one-liner for dinner: the damage is real, still growing, and falling hardest on those least responsible; the cure has finally arrived and is winning on price; and the only question left that matters is whether we use it fast enough to make that one record-breaking line — the carbon we emit — finally turn down.