Question 00 · The Whole Question
Is the world getting better or worse?
The biggest question, asked whole — across every front at once. Humanity is winning the fights it has waged longest and losing the ones its own success started. Optimist and pessimist read the same table; they only count different columns.
Ask whether the world is getting better or worse and you will get a confident answer either way — and both answerers are looking at real numbers. The disagreement is almost never about the data. It is about where you stand: how far back you look, whose life you count, which decade you treat as normal. Stand ten thousand years back and nearly everything has improved beyond recognition; stand at the last bad headline and the floor seems to be giving way.
So this page takes no side. It lays the question across every front the open data can reach — two dozen of them — and on each shows the long line, the recent turn, and the regions the world average hides. A flat global average is the most misleading number in this whole field: it can fall and rise in the same breath, hiding a continent sliding backwards behind a planet inching forward. Where a regional cut changes the story, you will find one.
Each dimension opens with a one-word verdict, then the charts that earn it, then three ways to read them: the case for hope, the case for despair, and the confusion that is so often the most honest answer of the three. Read it top to bottom and a shape emerges — we are winning the fights we have waged the longest, and losing the ones our own success started. The rest of this page is that sentence, shown.
Health
Death is in retreat — children survive, old plagues recede, even smoking is fading.
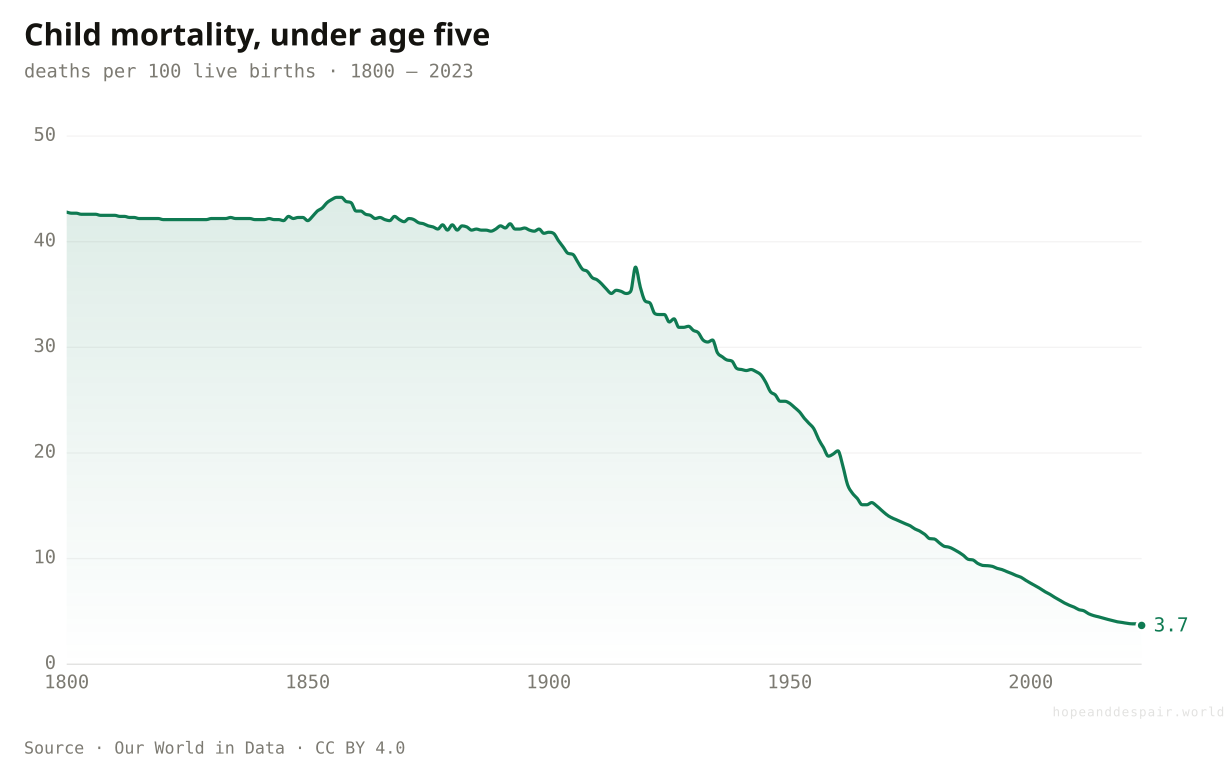
In 1800 more than four in ten children died before their fifth birthday; today it is under four in a hundred. Vaccines reach most of the world’s infants, malaria and tuberculosis are slowly losing ground, and the deadliest habit of the rich world is in steady decline.
This may be the most important line in human history. For almost all of it, roughly four newborns in ten never reached their fifth birthday — a grief so routine it shaped how people named and counted their children. Today it is under four in a hundred, and still falling. Nothing else on this page has travelled so far.
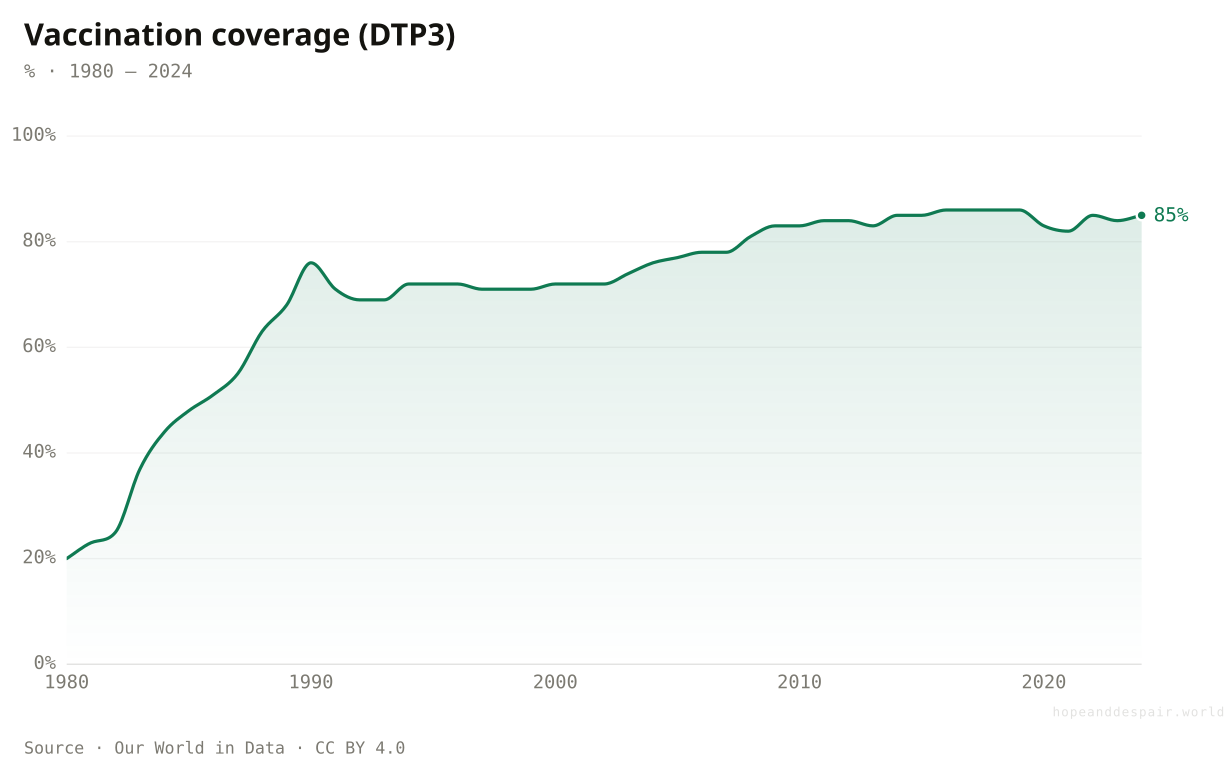
Much of that survival was bought cheaply. Routine childhood vaccination went from reaching one infant in five in 1980 to more than four in five — a few dollars a dose standing between a child and diseases that once emptied nurseries.
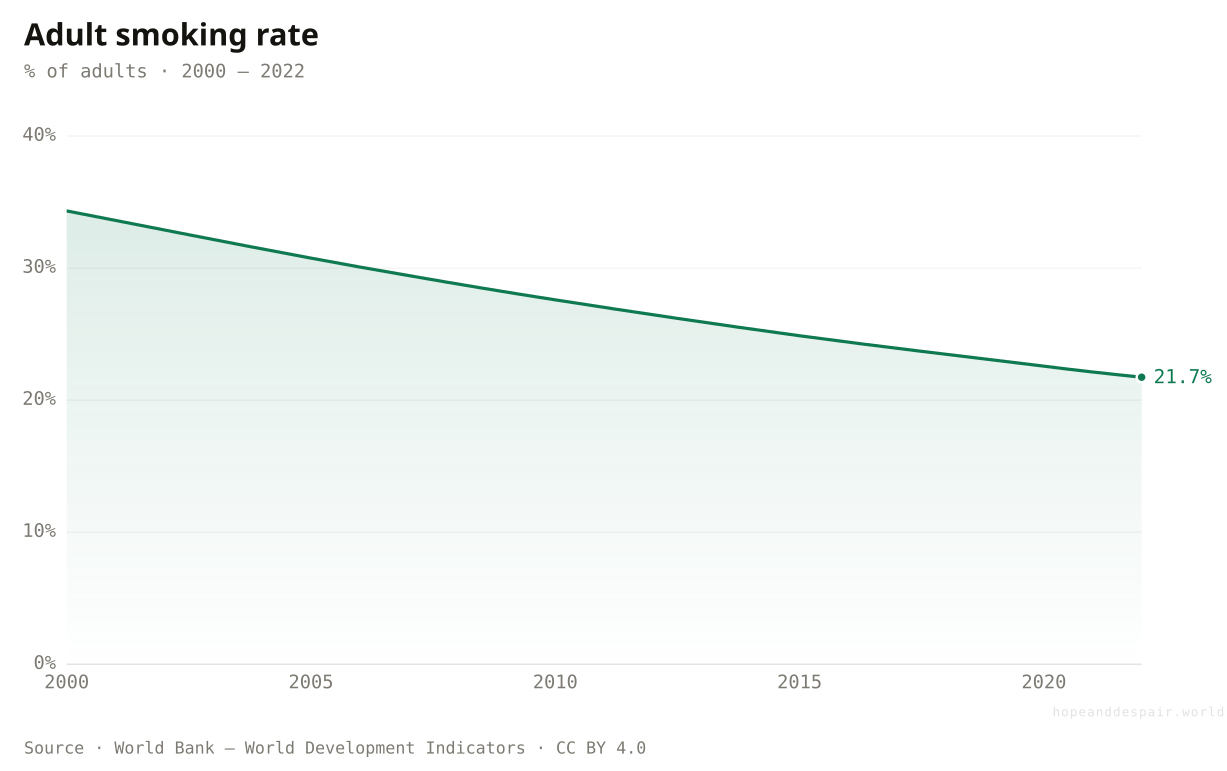
The rich world’s deadliest habit is finally receding: adult smoking has fallen by roughly a third since 2000, the slow payoff of taxes, advertising bans, and plain packaging. The cigarette took a century to conquer the world and is taking decades to lose it.
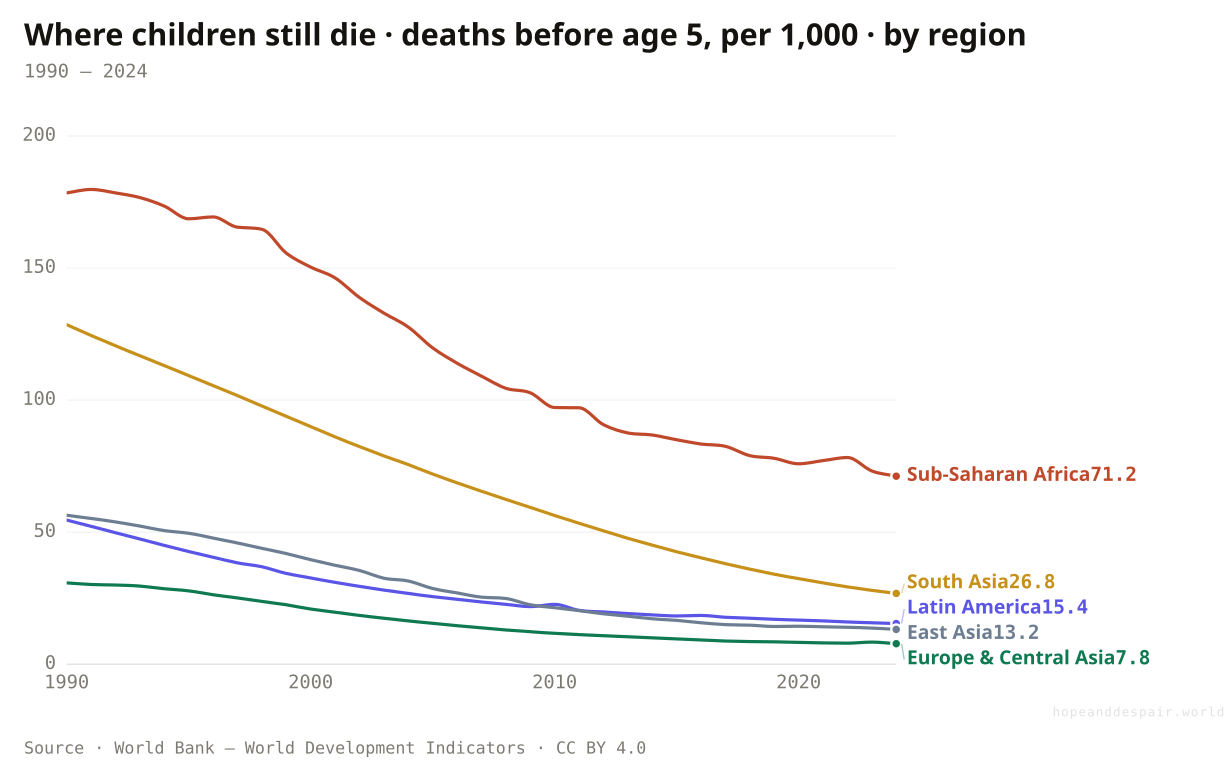
Survival is still an accident of geography. A child in Sub-Saharan Africa is more than five times likelier to die before turning five than one in East Asia — and though every line is falling, the gap measured in actual lives remains enormous.
The global average hides a gap measured in children’s lives. A baby born in Nigeria is roughly forty-eight times more likely to die before turning five than one born in Finland — about 116 deaths per 1,000 against barely two. The hopeful half: India and Bangladesh, once near the top of this grim list, have driven their rates down into the twenties and thirties, closer now to Brazil than to Chad or Somalia. Where a child is born still decides whether they live — only less ruthlessly than it did a generation ago.
The oldest enemy is losing: a child born today has the best survival odds in the history of the species.
The averages hide brutal gaps — a child in the poorest countries is still many times more likely to die than one in the richest.
As infections retreat, the slow diseases of long life — obesity, diabetes — rise to take their place.
Prosperity
The average person is richer than any generation before — by an order of magnitude.
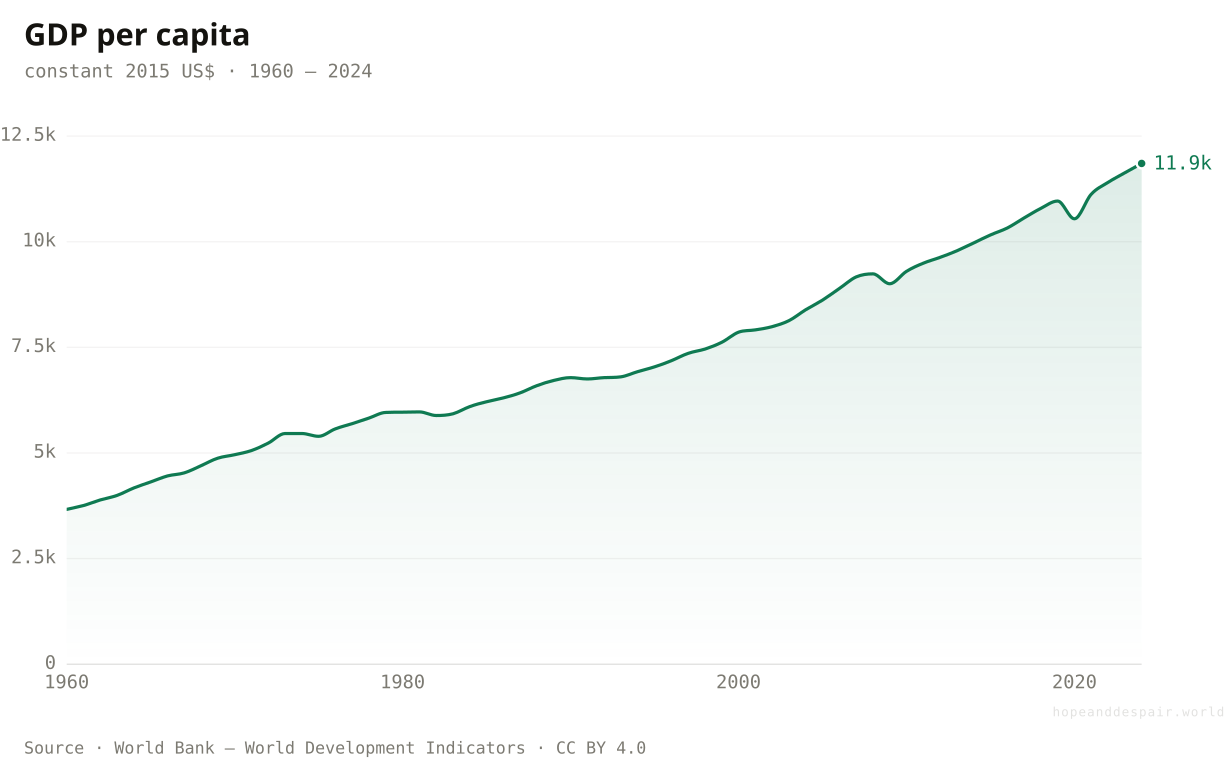
For most of history almost everyone was poor. Since around 1820 average income has multiplied roughly fifteenfold, and the steepest gains have come in the last fifty years as Asia industrialised.
Average output per person has roughly tripled since 1960 alone. An 'average tripling’ is the gentlest possible description of what that meant on the ground: hundreds of millions of people moving from bare subsistence to something like security inside a single working life.
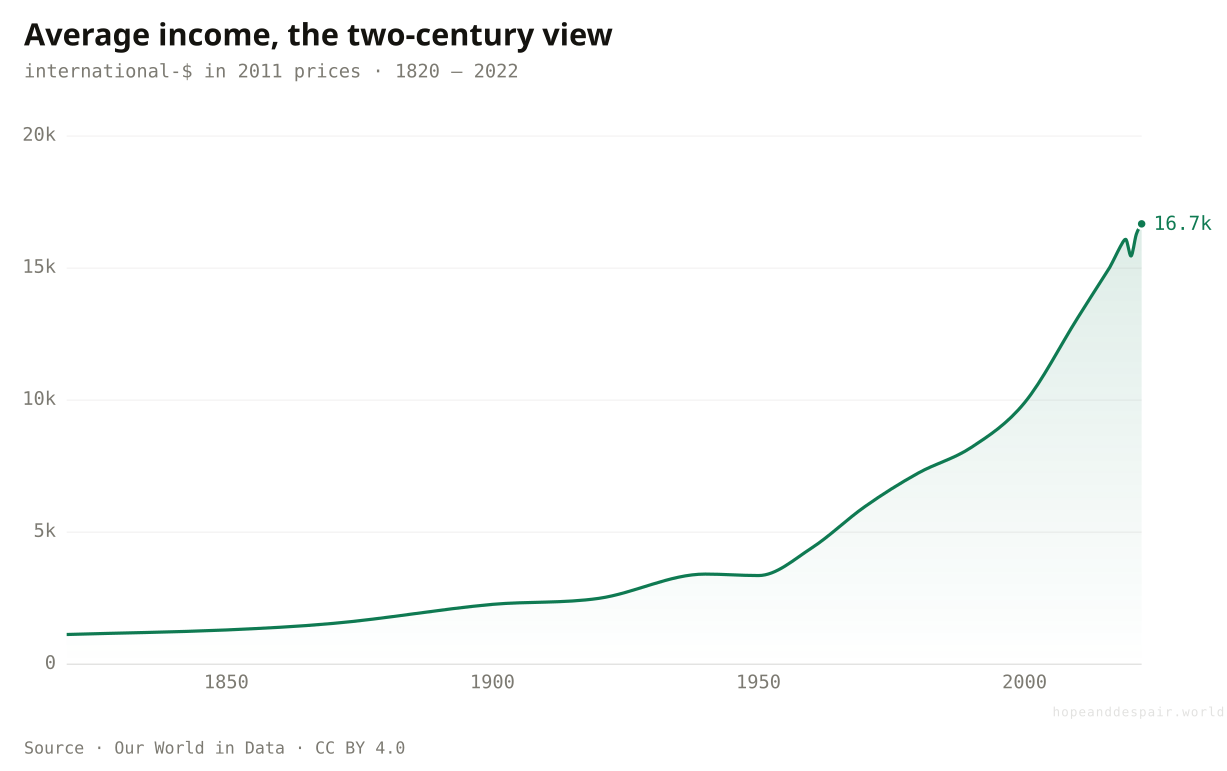
Pull the camera back two hundred years and the hockey stick appears. For all of history before about 1800, almost everyone everywhere was poor; the roughly fifteen-fold rise since is the single most consequential economic event there has ever been — and it is barely two centuries old, a blink in human time.
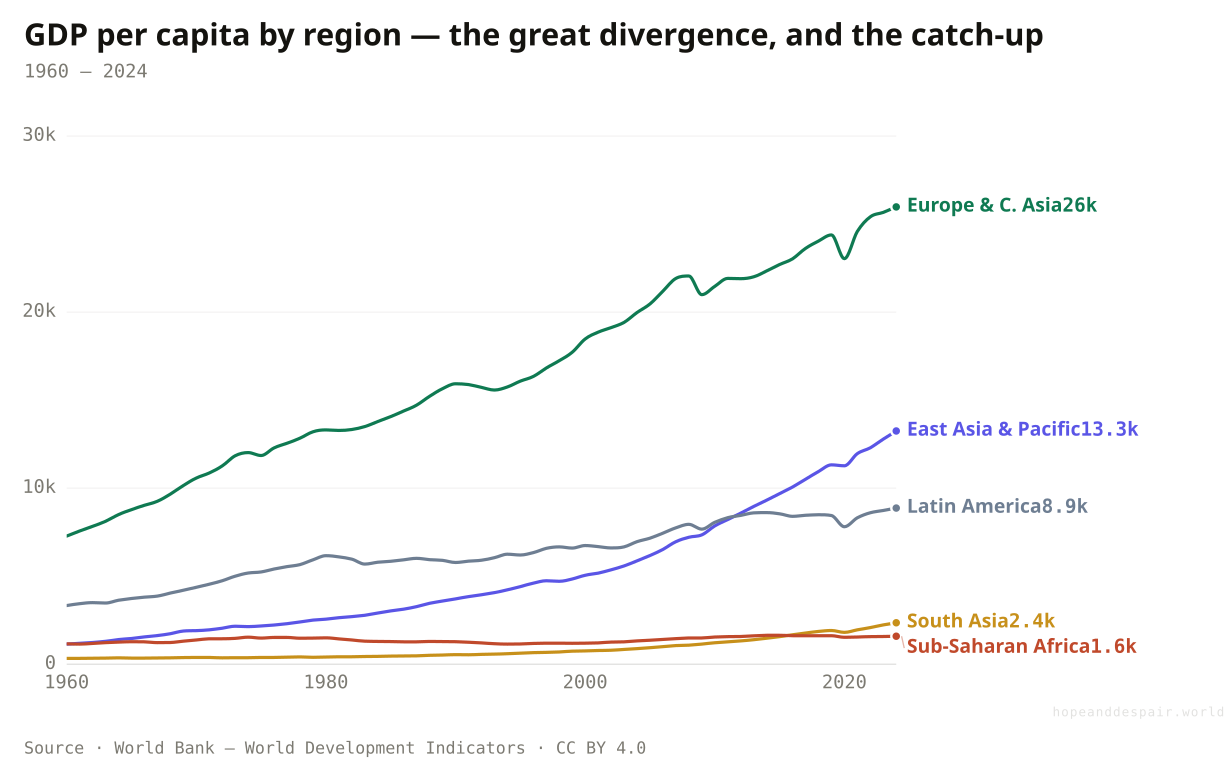
The catch-up is the defining economic story of our era: East Asia has closed much of the gap with the West inside one generation, and South Asia is now climbing the same curve a few decades behind. Sub-Saharan Africa is the exception — growing, but falling further behind in absolute dollars even as it does.
Average world income tells you almost nothing; the spread is the reality people live in. A typical Swiss earns around $90,000 a year and an American $66,000, while in DR Congo or Burundi the figure is a few hundred dollars — a gap of more than two hundred to one. The movement is in the middle: China has climbed to about $13,000 a head, several times India’s $2,400, which is itself more than double Ethiopia’s. The ladder is real, and millions have climbed it within a lifetime — but the rungs stay brutally far apart.
Mass prosperity is real and recent — most of it happened within living memory.
Growth has slowed in the rich world, and a rising average says nothing about who holds the gains.
Richer stops meaning better past a point: income and life satisfaction part ways once basic needs are met.
Poverty
Extreme poverty is collapsing — though 'not extreme’ still means desperately poor for billions.
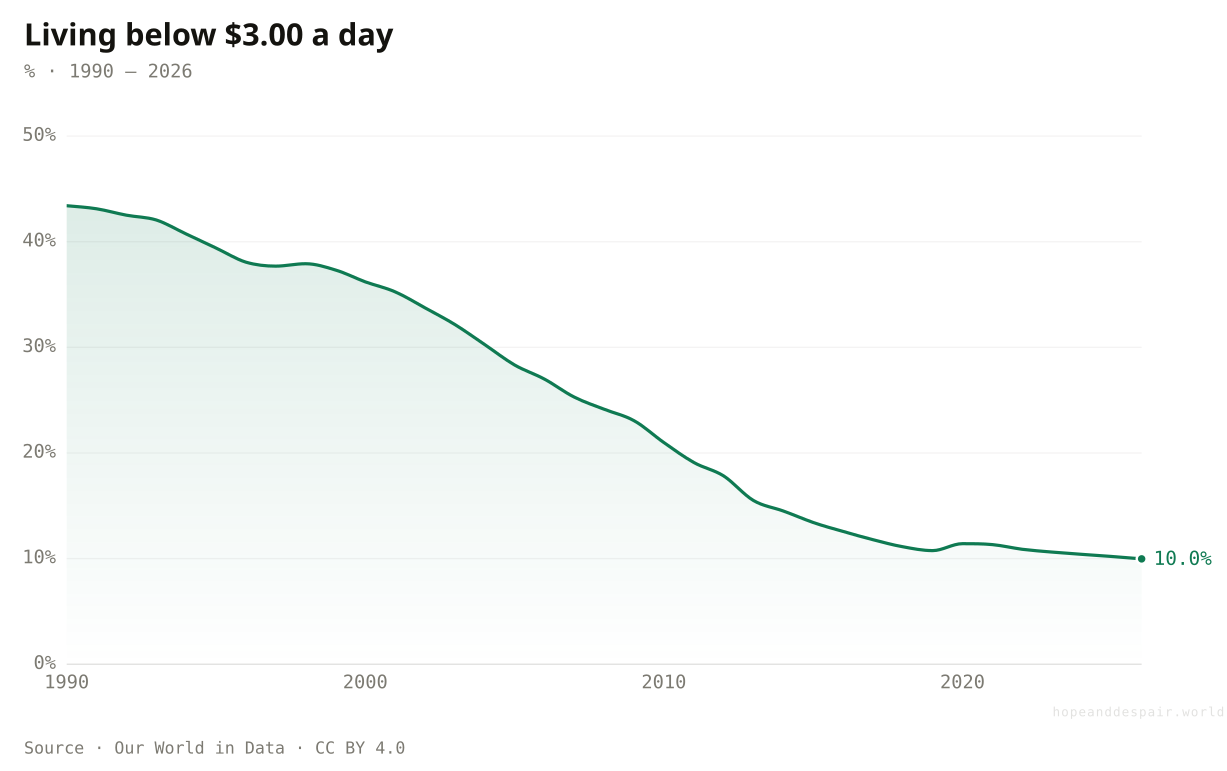
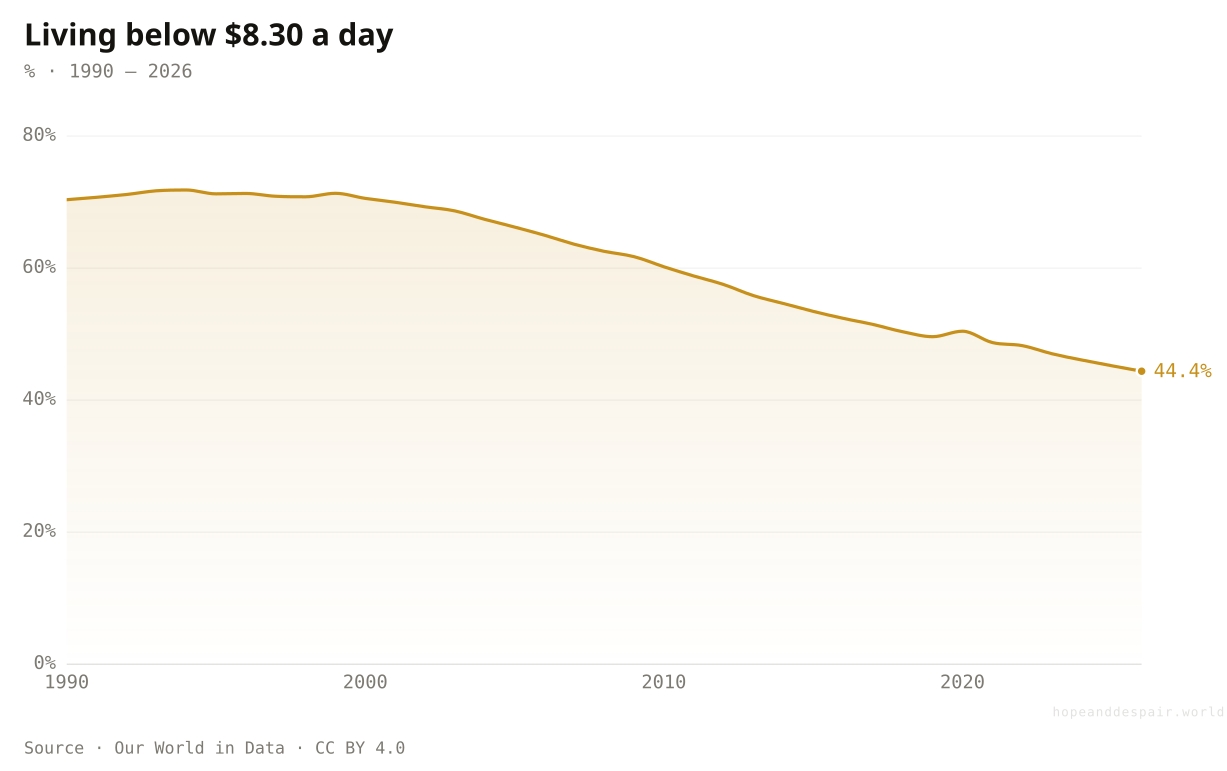
The share of humanity in extreme poverty fell from nearly half in 1990 to under a tenth today — a billion people lifted in a single generation. Yet almost half the world still lives on less than $8.30 a day.
In 1990 more than two-fifths of humanity lived in extreme poverty; today barely one person in ten does. That is well over a billion people crossing the line in three decades — the fastest mass escape from material misery ever recorded, most of it in China and India.
Raise the bar to a still-meagre $8.30 a day — the World Bank’s poverty line for an upper-middle-income country — and the triumph deflates: nearly half the world remains beneath it. 'No longer extremely poor’ is a long way from comfortable, secure, or reliably fed.
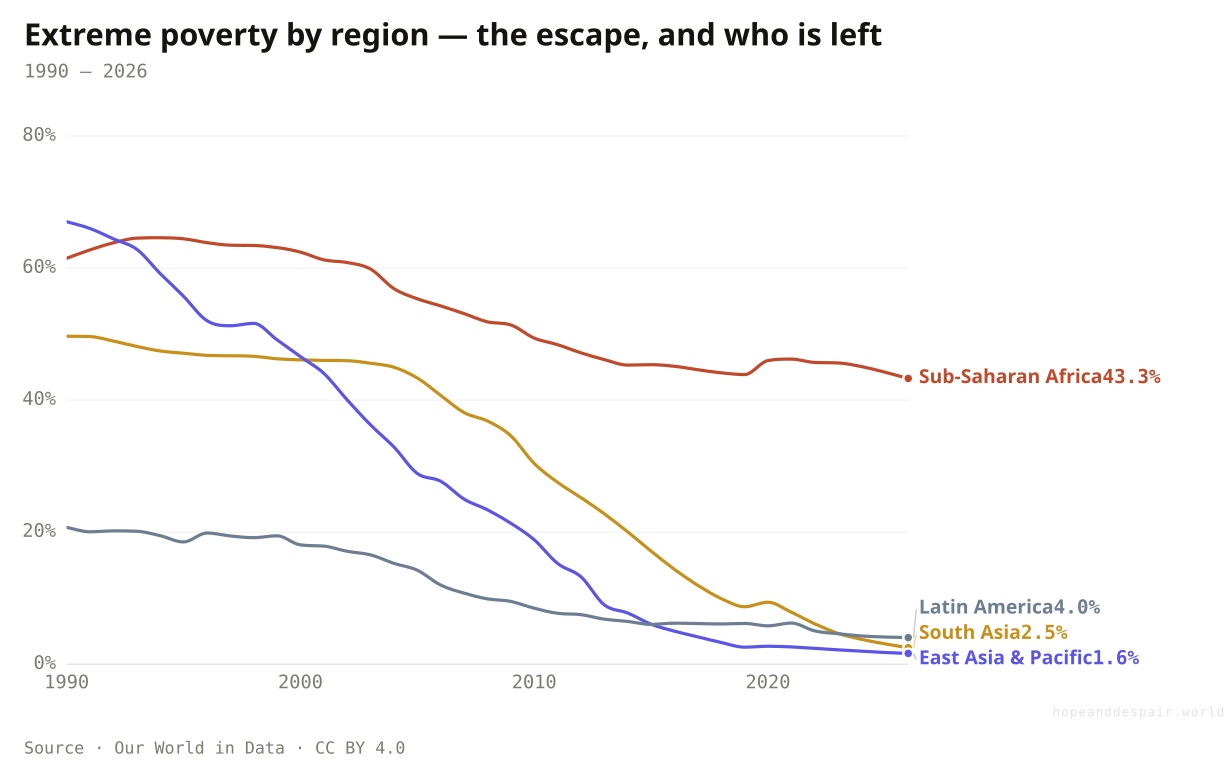
The remaining extreme poverty is collapsing across Asia and concentrating in Sub-Saharan Africa, where it has fallen far more slowly. The next billion lifted out will be far harder won than the last — poorer, more rural, and increasingly in places fractured by conflict.
Pull the regional average apart and the spread turns brutal: in DR Congo and Mozambique four people in five still live below $3.00 a day, while China has all but erased that kind of poverty and Vietnam is nearly there. India — for decades the largest single reservoir of the world’s poor — is now down to about one person in twenty. What remains is not spread evenly across the poor world; it has pooled in a band of African countries where it falls slowest, and in some years not at all.
Two countries make a point a regional average buries. In the late 1970s nearly six in ten Indians lived below $3.00 a day — a deeper hole than Nigeria’s, where about half did. Then they split: India’s rate fell to roughly one in twenty by its latest survey, while Nigeria’s gave only a little, still above four in ten. Same starting misery, opposite endings. Both lines stop at 2022 because poverty is counted by household survey, not every year — India went a full decade between counts — so only the modeled world and regional lines above run on toward today.
The fastest mass escape from poverty in history happened in the last forty years.
Progress has stalled and concentrated — the poverty that remains is harder, poorer, and increasingly African.
Where you draw the line decides the story: triumph at $3.00, a far darker picture at $8.30.
Water & sanitation
Clean water and a safe toilet reach more people every year — just slowly.
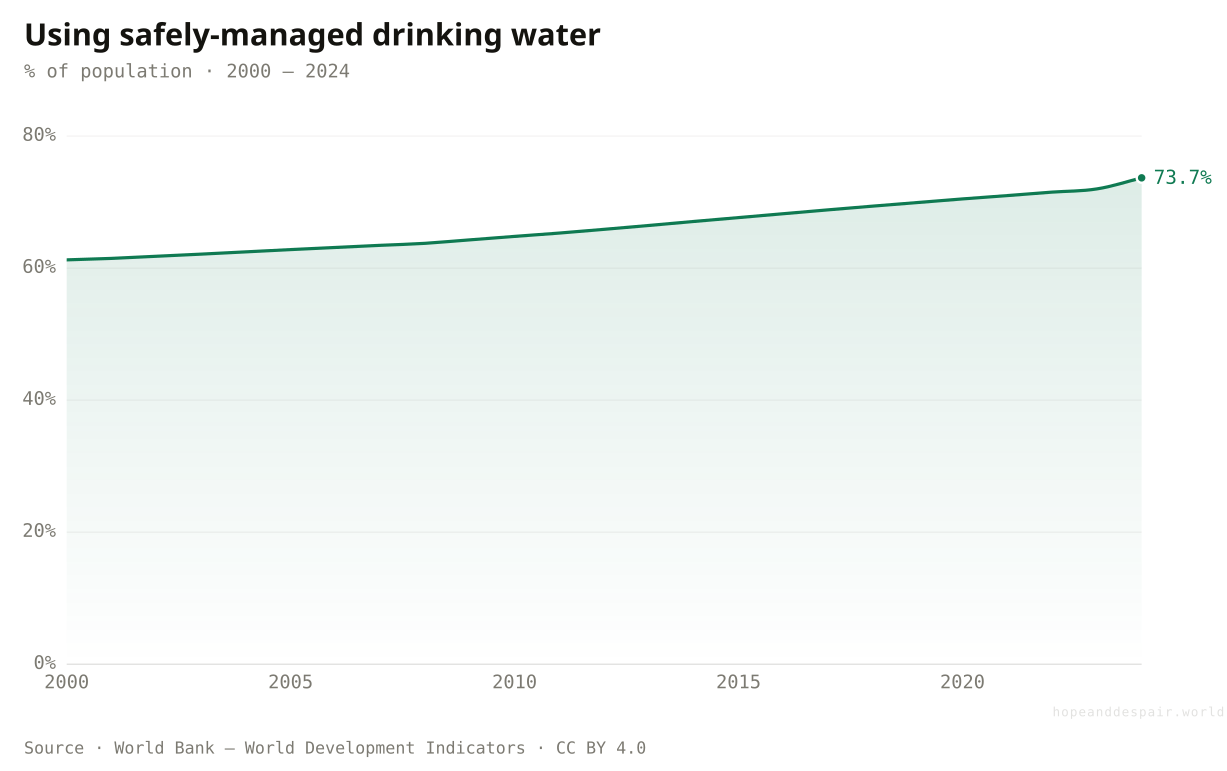
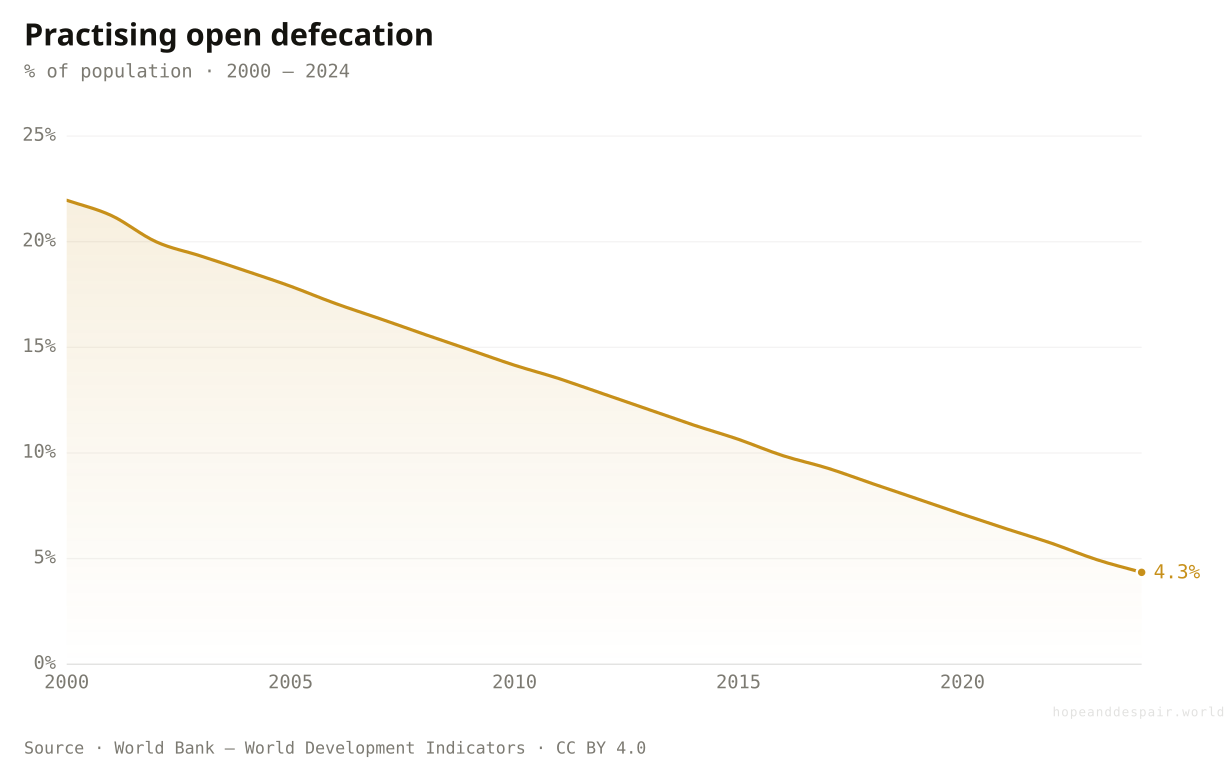
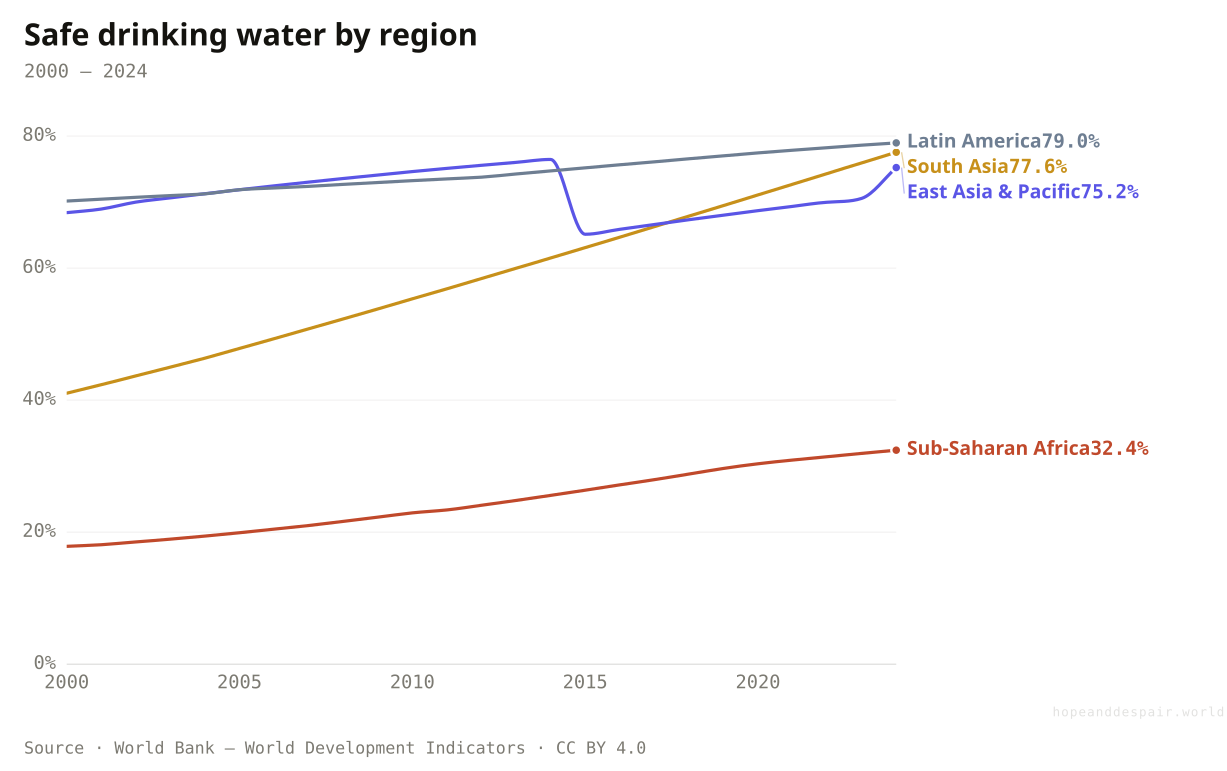
Three in four people now have safely-managed drinking water, up from three in five in 2000, and open defecation has fallen from a fifth of humanity to under one in twenty. But two billion still lack safe water at home.
The line climbs about half a percentage point a year — real progress, but slow enough that at this pace the last billion people are not reached until well into the second half of the century.
The fastest-moving water statistic on Earth: open defecation fell from one person in five to fewer than one in twenty in a single generation, driven by vast toilet-building drives across India and Asia.
The divergence the world average hides — most regions now sit near three-quarters covered, while barely a third of Sub-Saharan Africans have safely-managed water at home.
Safely managed drinking water is the quiet dividing line of development. In Germany and Japan it reaches essentially everyone; in Chad just 6 in 100 have it, in DR Congo about 12. The middle holds the demographic weight: India has pushed safe water to roughly three-quarters of its people, Bangladesh to under 60. A tap that runs clean is so ordinary in rich countries that it goes unseen — and so absent across the Sahel that fetching water still shapes the day.
Two billion people gained basic water and sanitation in a generation — quiet, vast, and unsung.
At the current pace universal safe water is still decades off, and the worst-served are the poorest.
'Improved’ on paper is not always safe in practice — the gap between a tap and clean water flatters the numbers.
Education
More of humanity can read than ever — the quiet foundation under every other gain.
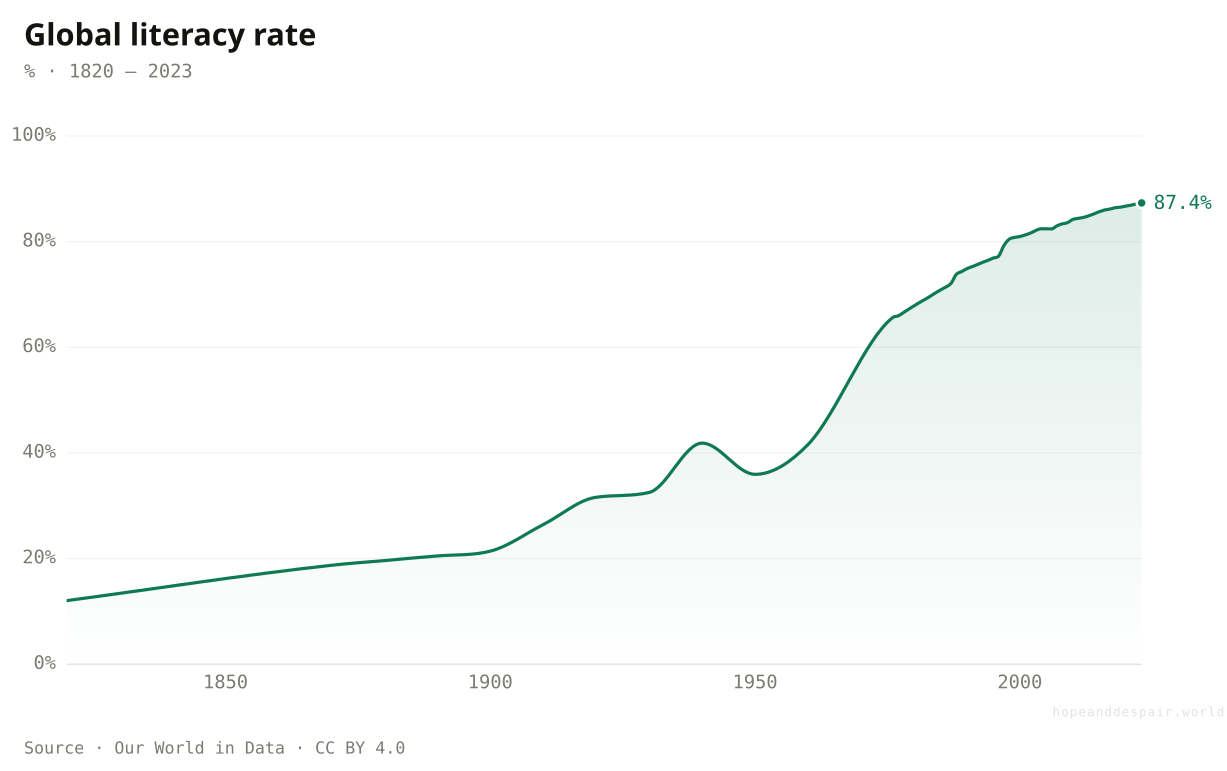
Two centuries ago barely one person in ten could read. Today it is more than four in five, the gap between girls and boys has all but closed, and the steepest gains are now where literacy was lowest.
Two centuries ago reading was a rare skill — perhaps one person in ten, mostly men, mostly wealthy. That it is now the near-universal inheritance of humanity is among the quietest revolutions on this page, and the foundation beneath almost every other gain here: a population that can read is one that can be taught everything else.
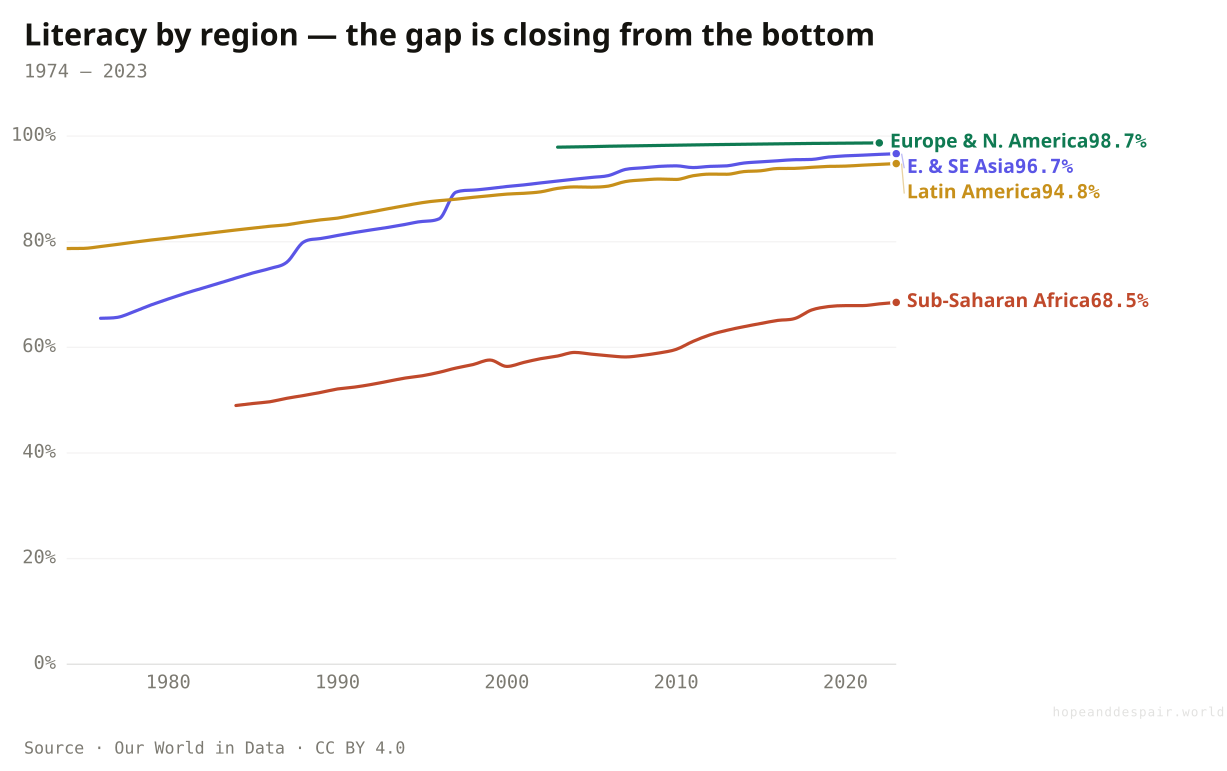
The frontier is Sub-Saharan Africa, where adult literacy has climbed from under half to roughly two-thirds in a single generation — rapid by any historical standard, yet still the world’s widest remaining gap.
Reading is now so close to universal across most of the world that the exceptions stand out sharply. China and Brazil sit above 90%, and India has reached 82 — a staggering climb for a country that was majority-illiterate within living memory. The hold-outs cluster in the Sahel: in Niger and Chad only about a third of adults can read, the legacy of schooling that never arrived and that fell hardest on girls and the rural poor.
From one in ten to more than four in five — among the most complete transformations in the human record.
Reading is not understanding: in many countries children finish school still unable to read a simple passage.
Access has nearly been won; quality is the unfinished fight, and it barely shows up in the headline number.
Hunger
Fewer people go hungry than a generation ago — though the decline has stalled and even reversed.
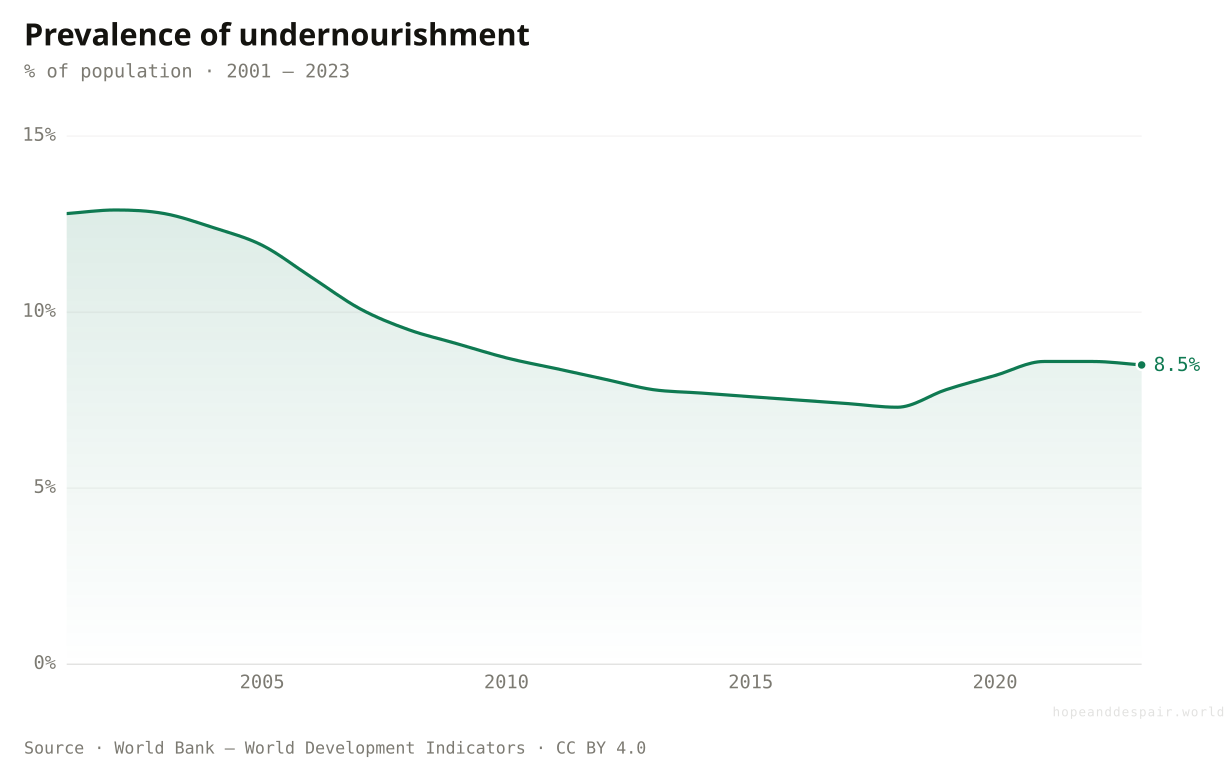
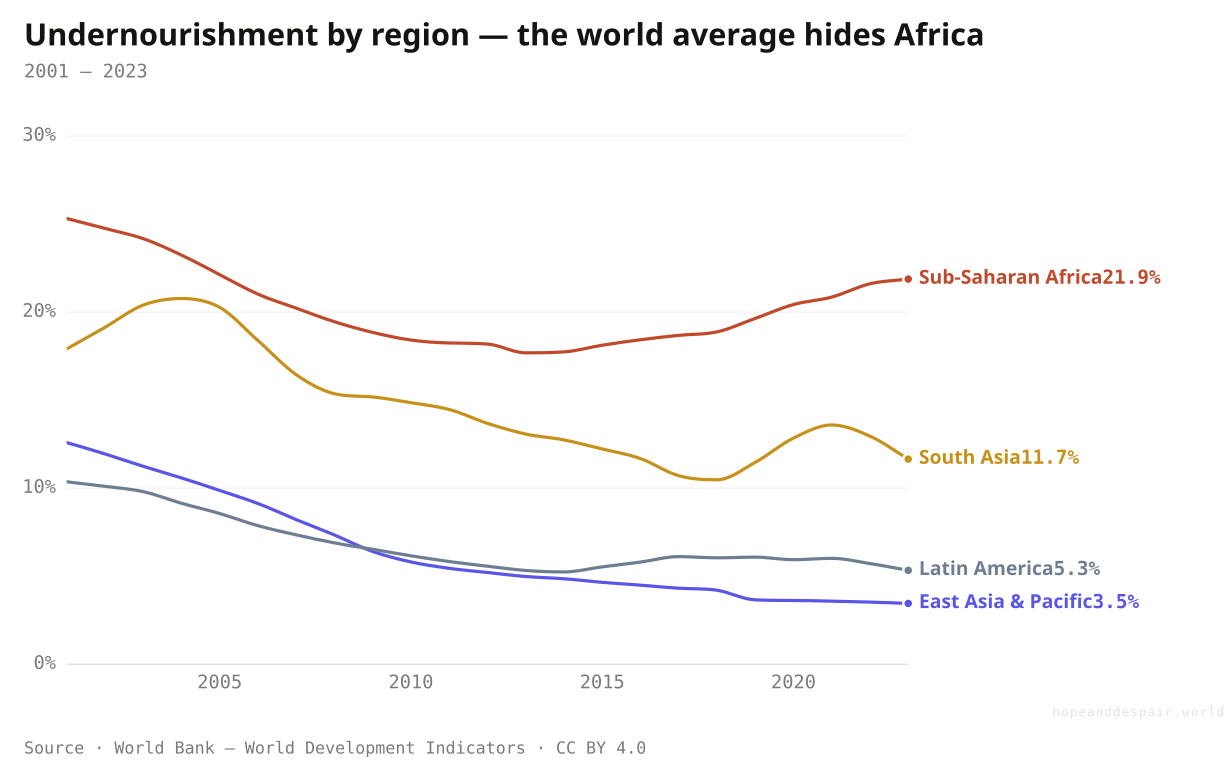
The share of the world that is undernourished fell through the 2000s, then crept back up after 2015 as conflict, climate shocks, and the pandemic struck. The long trend points down; the recent one points the wrong way.
The line tells two stories at once: a steady decline through the 2000s, then a reversal after 2015 as war, climate shocks, and the pandemic pushed the share of the hungry back upward. Progress against hunger is not a ratchet — it can be undone, and recently has been.
The clearest case on this whole page of an average that lies. The world figure has been flat-to-falling while undernourishment across Sub-Saharan Africa has climbed back above one person in five — two decades of progress quietly erased behind a reassuring global line.
Hunger has retreated to particular places rather than vanishing. In Madagascar and DR Congo around four in ten people do not get enough to eat; across China and the rich world the figure sits at the measurement floor, near zero. The unfinished middle is the telling part: India, despite its growth and its grain surpluses, still leaves about one in eight undernourished, and Nigeria closer to one in five. Enough food exists — reaching everyone with it is the part that stalls.
Famine, once a routine feature of human life, has all but vanished as a cause of mass death.
In sub-Saharan Africa more than one in five is undernourished, and the rate is climbing back toward where it stood twenty years ago — the falling world average hides it completely.
The same series is a triumph over thirty years and a setback over ten — and a different story again in every region.
Tolerance & rights
The law treats women, minorities, and the marginalised more equally than ever — even where attitudes lag behind.
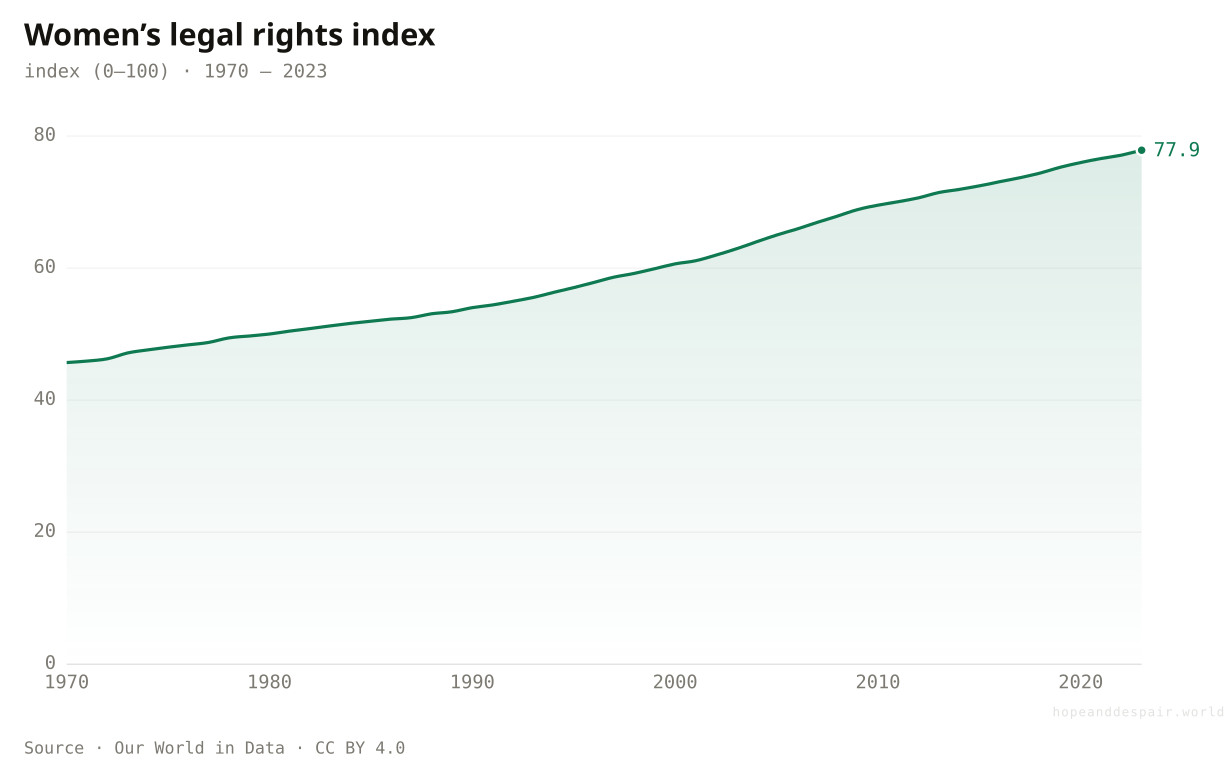
Women’s legal rights have risen steadily for fifty years. But the gap between what the law grants and what people accept is itself the story, and the open data captures the statute far better than the feeling.
Measured by law alone, the direction is unmistakable: across 190 countries the average woman now holds about three-quarters of the legal rights of the average man, up from under half in 1970. What a statute grants and what a society concedes are different things — but the statute, at least, moves only one way.
On paper, more people hold equal rights than at any point in history, and the trend has not reversed.
Law is not life: rights on the books coexist with persecution and backlash the data barely sees.
Attitudes move slower than statutes, and the open numbers measure the statute, not the heart.
Gender equality
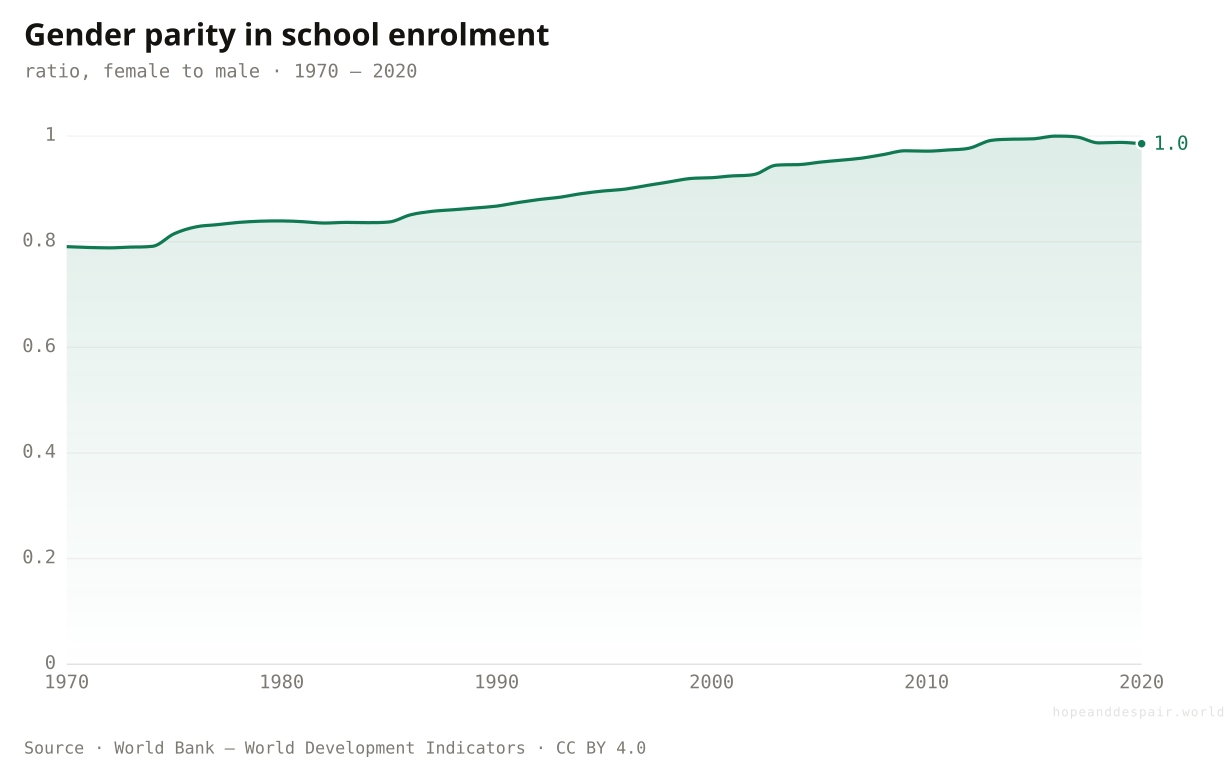
Girls now go to school nearly as much as boys, and far fewer women die giving birth — though the gap at work and in power holds.
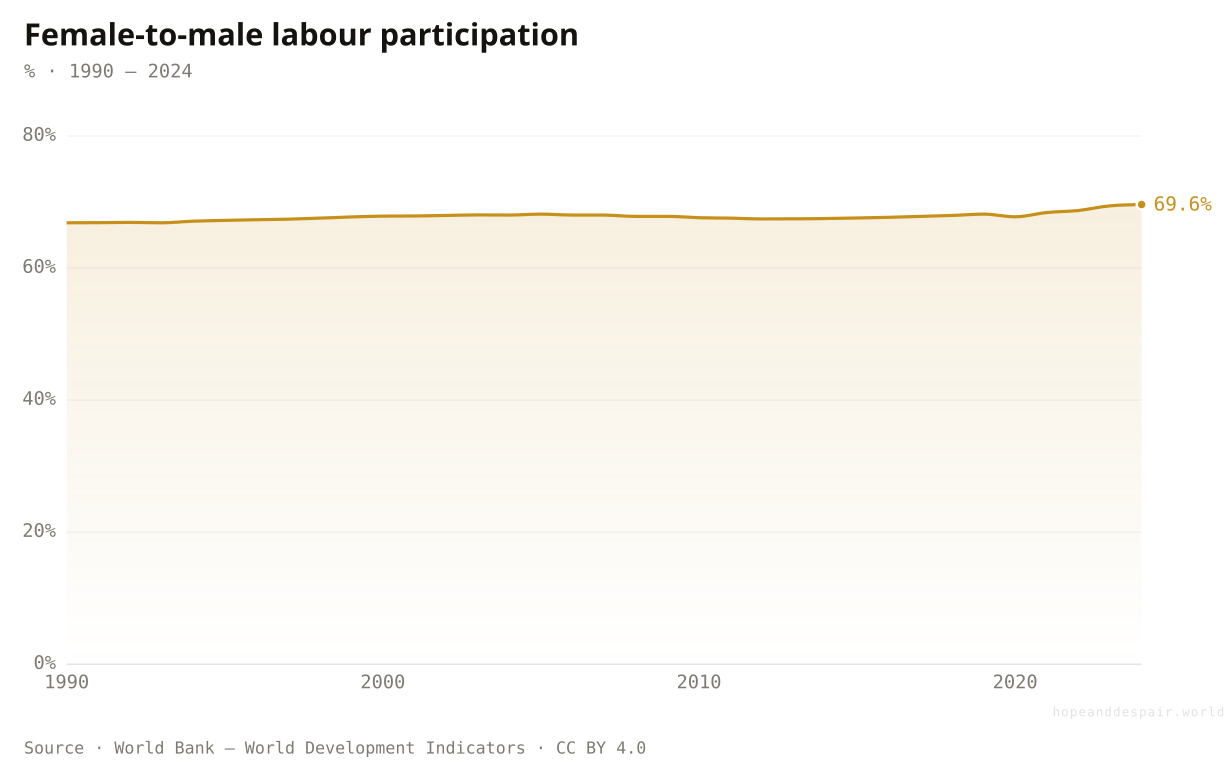
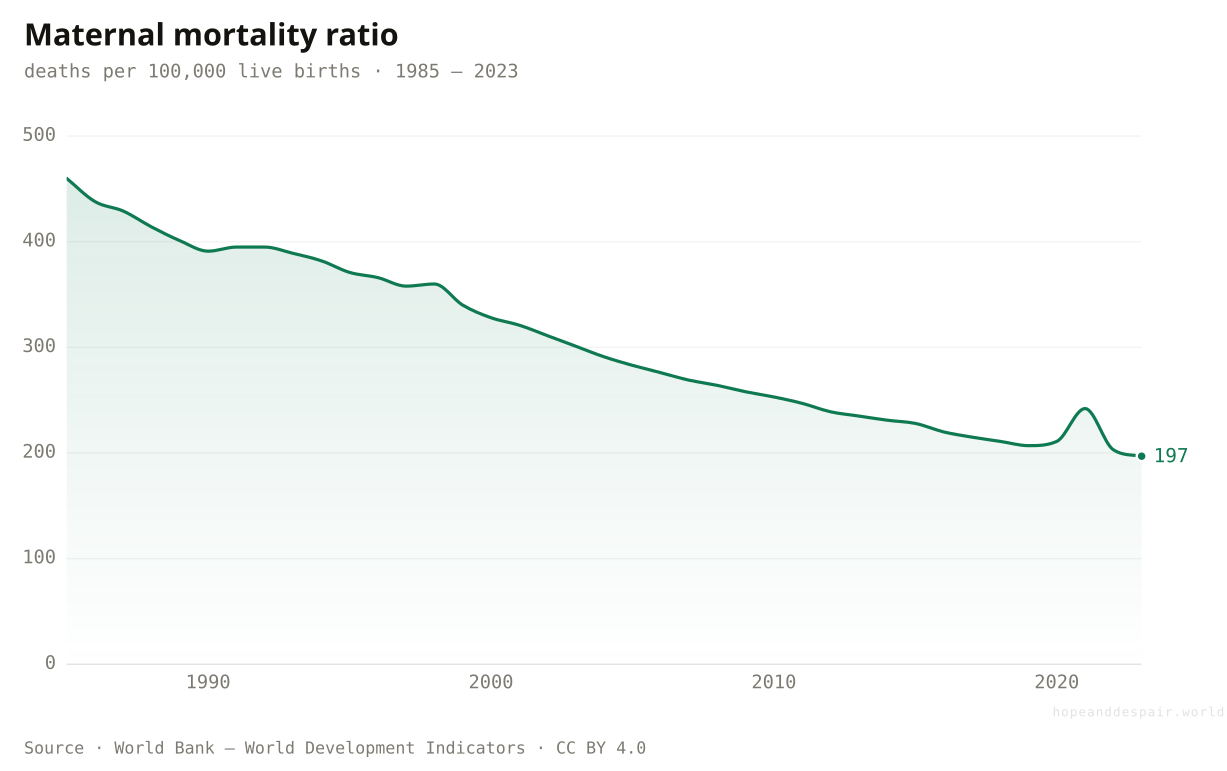
The gender gap in schooling has almost closed and maternal mortality has more than halved since the 1980s. But women’s share of paid work and of parliamentary seats rises only slowly, and stays far from parity.
In the classroom the oldest inequality has essentially closed: girls worldwide now enrol about as often as boys, a parity that would have stunned every century before this one.
Outside the classroom the gap holds. Women’s share of paid work has barely shifted in thirty years, stuck near 70% of men’s — equality in school has not carried into the economy or the boardroom.
The gain measured in lives: a woman is now less than half as likely to die giving birth as in the late 1980s. Childbirth is still far deadlier in poor countries than rich ones, but that gap is narrowing faster than almost any other in women’s health.
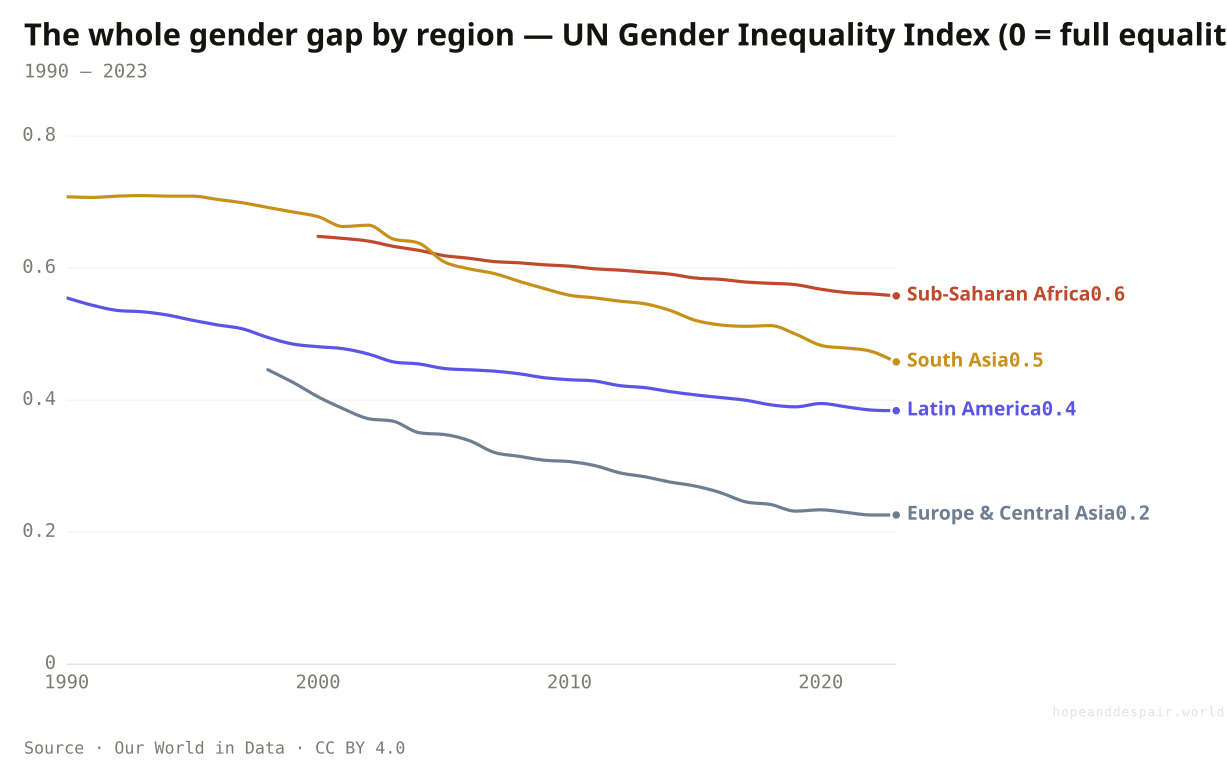
One composite of reproductive health, political power and paid work — and on it, every region is falling toward equality. South Asia has moved fastest, from the most unequal region in 1990 to about the global average today; Sub-Saharan Africa now sits highest, while Europe and Central Asia approaches the floor. A lower line is a more equal one.
The gap between women’s and men’s lives is widest where you would guess and narrowest where you would too. Yemen and Afghanistan sit near the top of the inequality scale, their women shut out of schooling and paid work; Norway and Denmark sit at nearly zero, about as close to parity as any society has reached. India lands in the awkward middle at 0.40 — better than a generation ago, still far from its own stated ideals. The United States, at 0.17, trails much of Europe.
A girl today is far likelier to read, to finish school, and to survive childbirth than her grandmother was.
Schooling equalized; safety, power, and pay did not. Women’s share of paid work has barely moved in thirty years, they hold a minority of seats in almost every parliament, and violence against women remains widespread — the gaps a classroom cannot close.
Equality in one arena does not transfer to another — girls fill the classrooms while the gaps in pay, power, and safety hold.
Technology & connectivity
Most of humanity is now online and electrified — a connection unimaginable a generation ago.
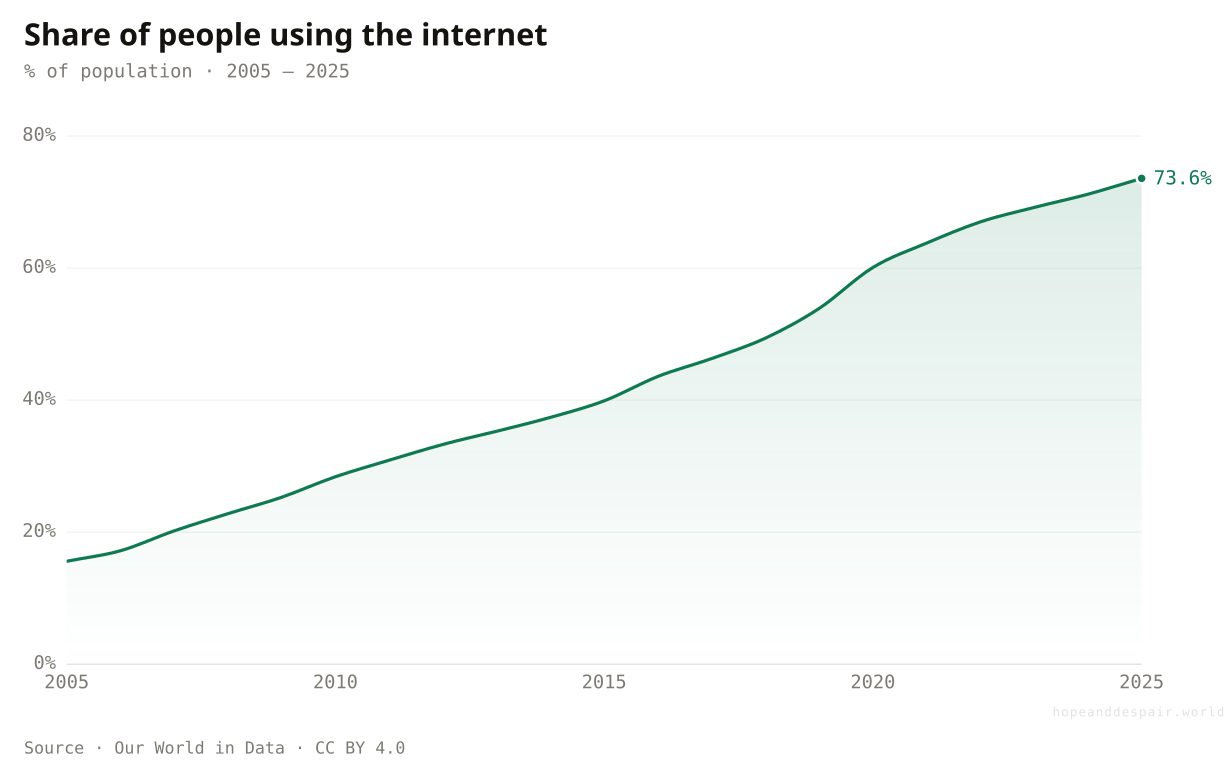
In 2005 fewer than one in six people used the internet; today it is roughly seven in ten, and nine in ten have electricity. Whether that connection informs or distorts is the harder question the data cannot answer.
In 2005 fewer than one person in six had ever been online; today it is nearly three in four. Few technologies in history have reached most of humanity this fast — and what that connection does to us, for better and worse, is the harder question no coverage figure can answer.
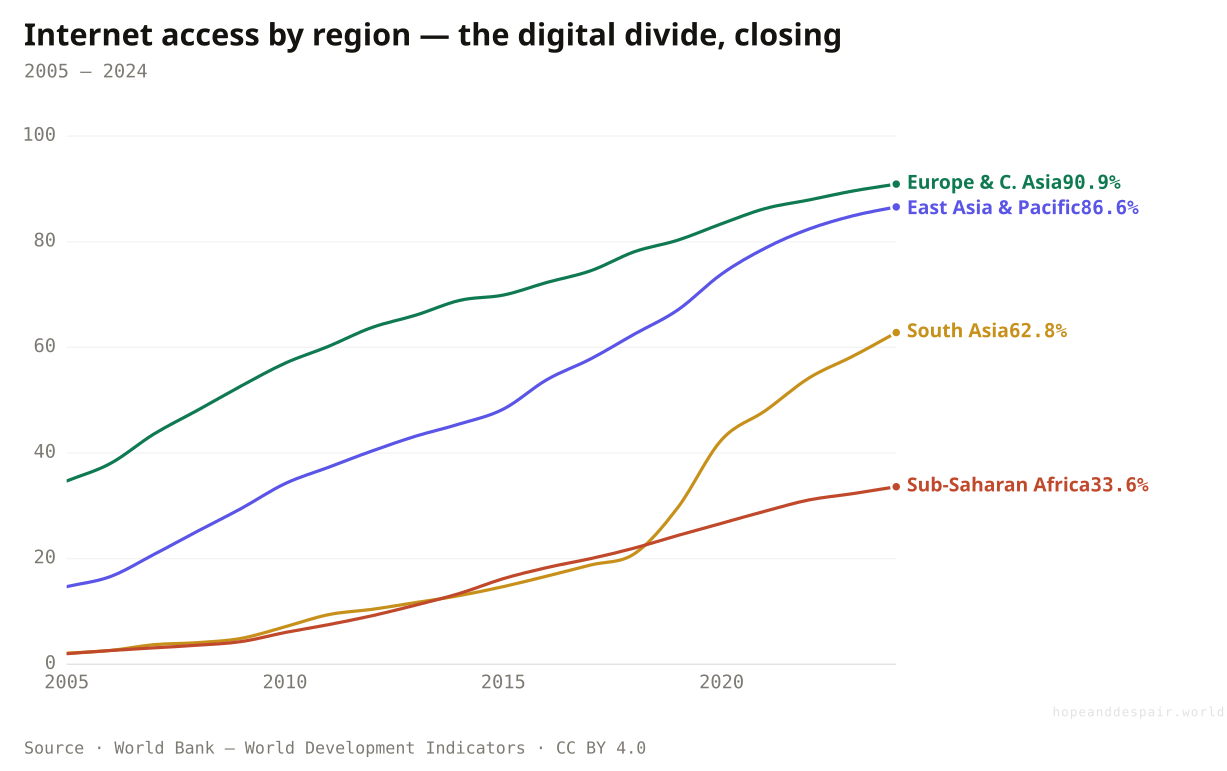
The divide is real but narrowing fast: Sub-Saharan Africa has gone from almost entirely offline to roughly a third connected in under twenty years, even as it stays far behind the rich world’s near-saturation.
The internet went from rich-world luxury to near-necessity in two decades, but the on-ramp is uneven. The Gulf states and South Korea are effectively fully connected; the United States and China sit in the low 90s. The frontier is the bottom of the list: India has crossed 70%, a billion people brought online fast, while Ethiopia and Chad remain under 20%. The people still offline are disproportionately the rural poor, and disproportionately women — last to get this, as they were last to get most things.
Billions gained access to the sum of human knowledge in a single decade.
A third of humanity is still offline, and connection brought surveillance, addiction, and misinformation with it.
The wire is neutral; whether it carries enlightenment or its opposite is not something a coverage figure can tell you.
Safety & accidents
The accidental toll — led by the roads — is slowly easing, even as the absolute count stays vast.
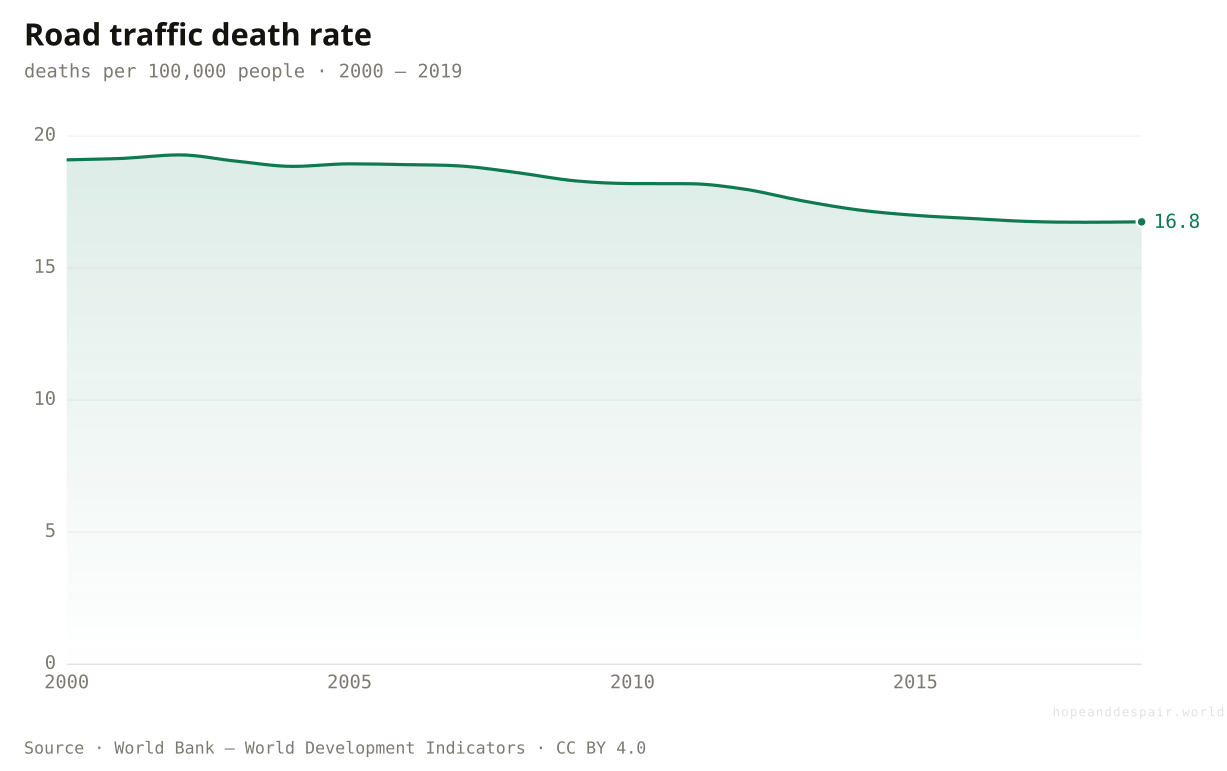
The global road-death rate has edged down since 2000, though more than a million people still die on the roads each year. Drowning, falls, and disasters add to a toll the open data captures only in fragments.
Safer cars and roads have bent the death rate down even as the number of vehicles on Earth exploded — quiet, unglamorous engineering progress. Yet more than a million people still die on the roads each year, most of them young, and the toll is climbing where cars are arriving fastest.
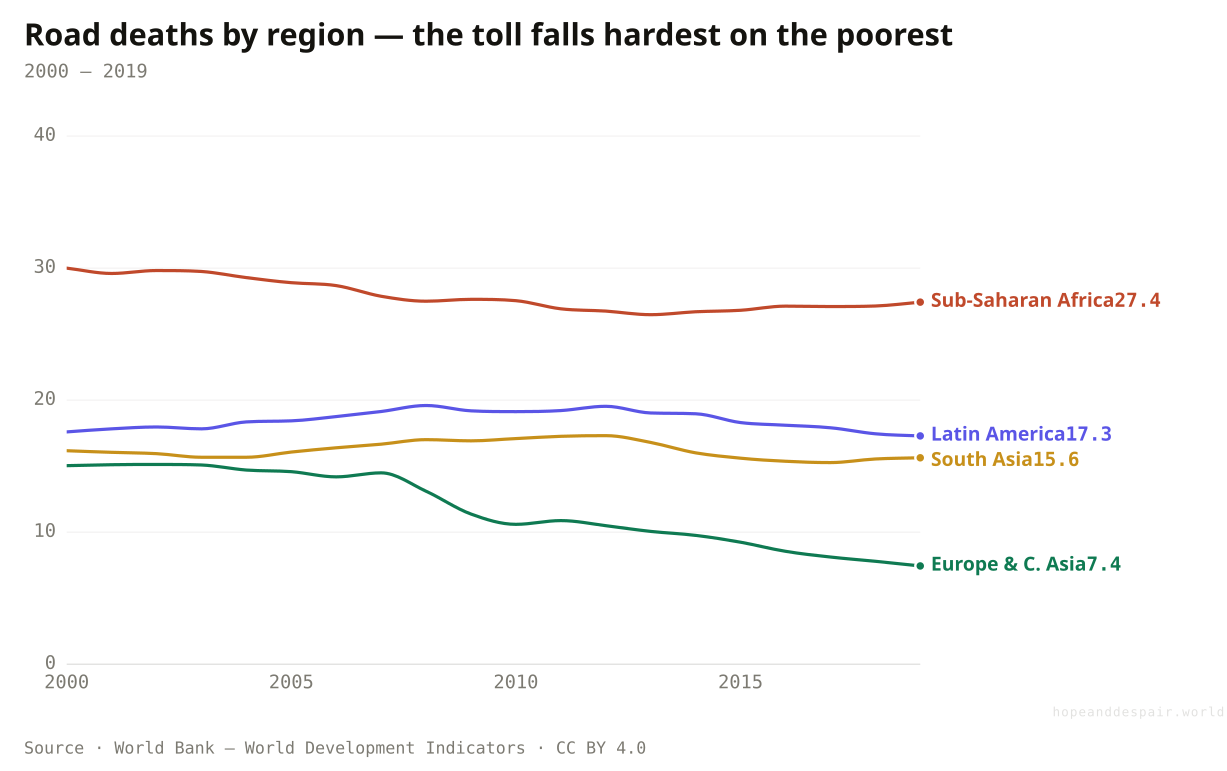
The danger has migrated to the developing world: a road death is now roughly four times likelier in Sub-Saharan Africa than in Europe, where half a century of seatbelts, speed limits, and safer design cut the rate in half.
Dying on the road is one of the most unequal risks there is. Saudi Arabia and DR Congo lose more than 30 people per 100,000 to traffic each year; Sweden and the United Kingdom lose around three. The pattern mostly tracks income, with one loud exception. The United States, at 12.7, kills roughly four times as many of its people on the road as its peer democracies do — a gap measured in tens of thousands of lives a year.
Safer vehicles and roads have bent the death rate down even as the number of cars exploded.
Over a million people a year still die on the roads — most of them young, most in poorer countries.
A falling rate and a still-enormous count can both be true; which you cite decides the mood.
Climate
Emissions keep rising and the air keeps warming — the clearest 'worse’ on the page.
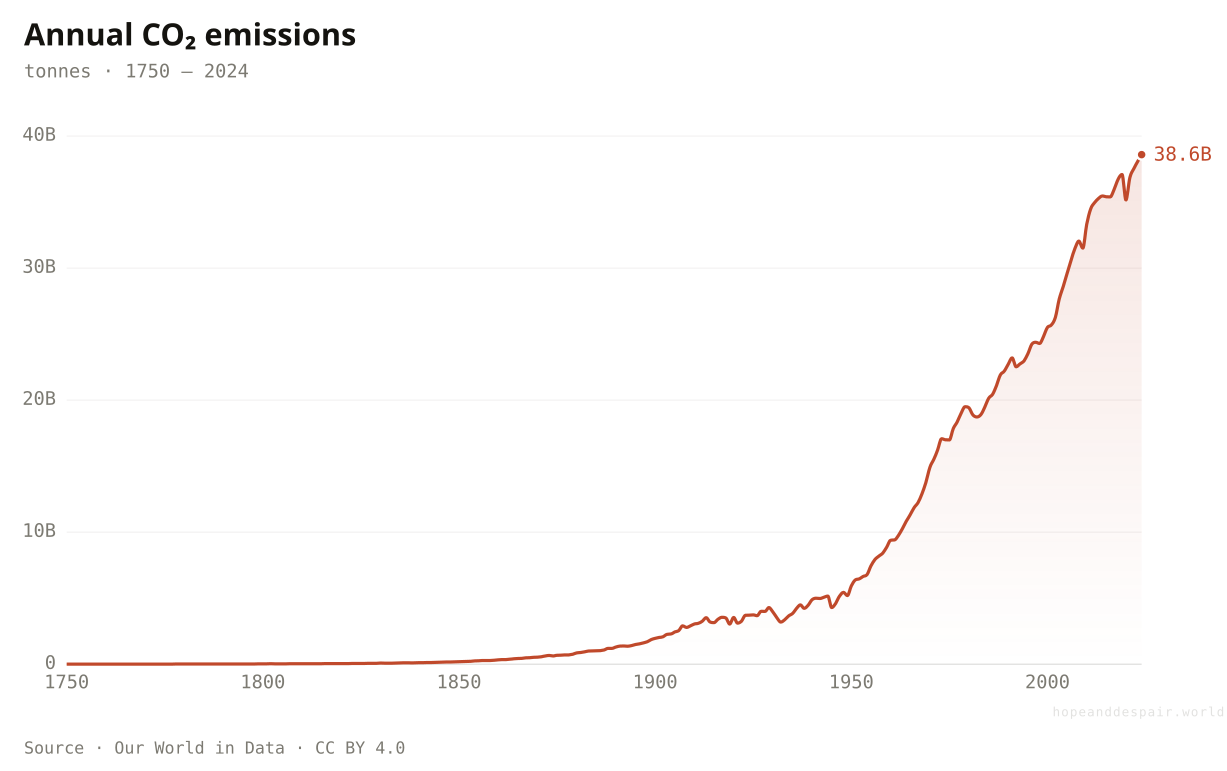
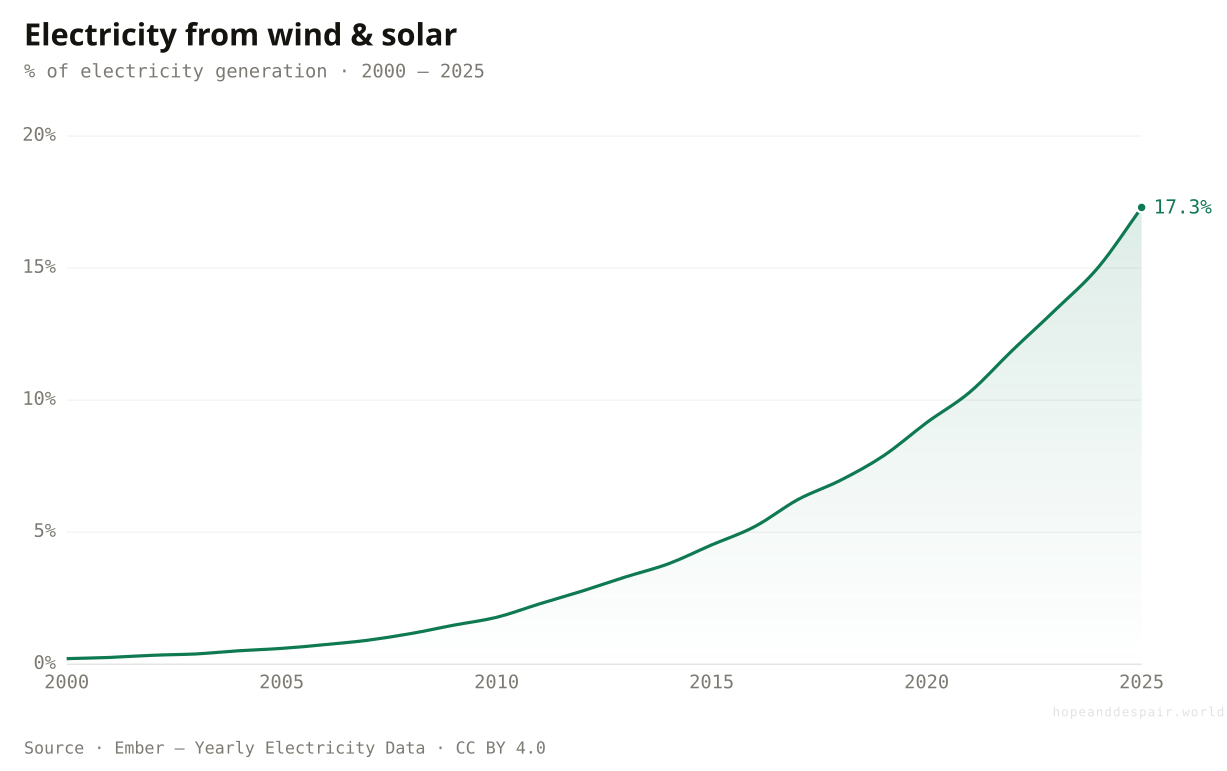
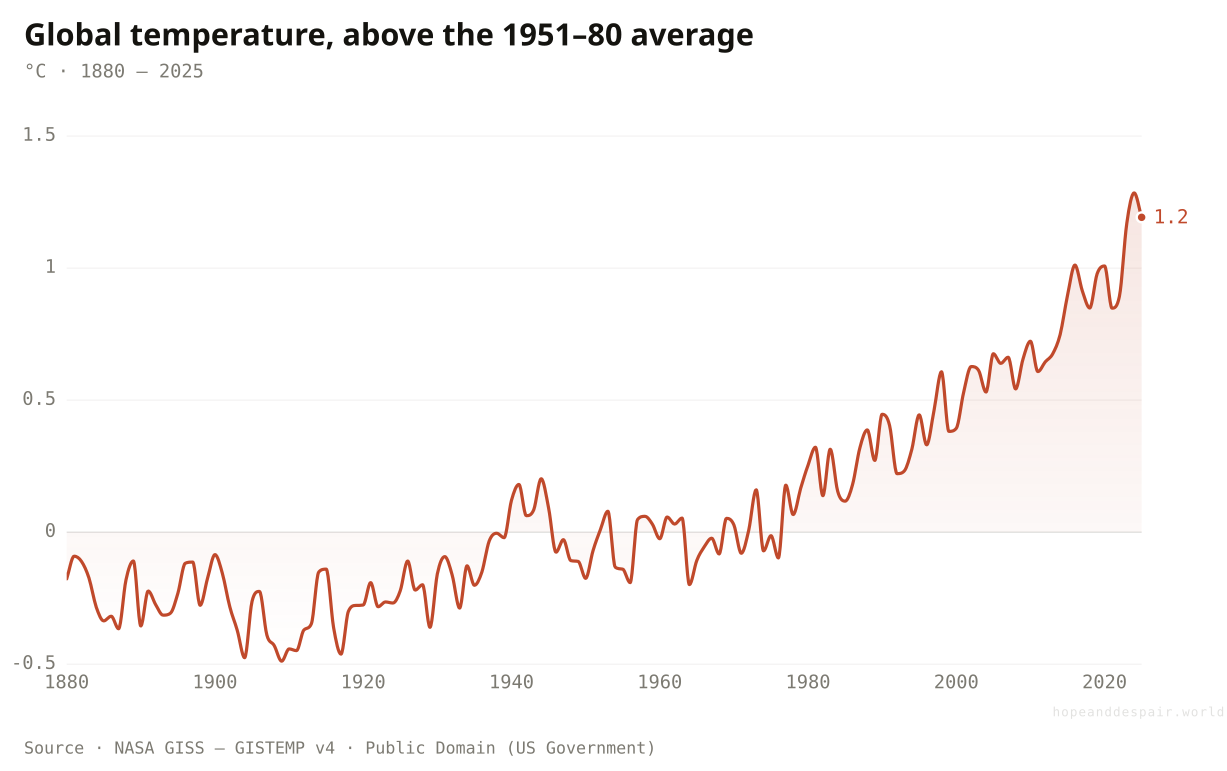
Atmospheric CO₂ has passed 425 parts per million, higher than at any point in 800,000 years, and annual emissions are still setting records. The one real lever — clean electricity — is moving fast, but not yet fast enough to stop the carbon from accumulating.
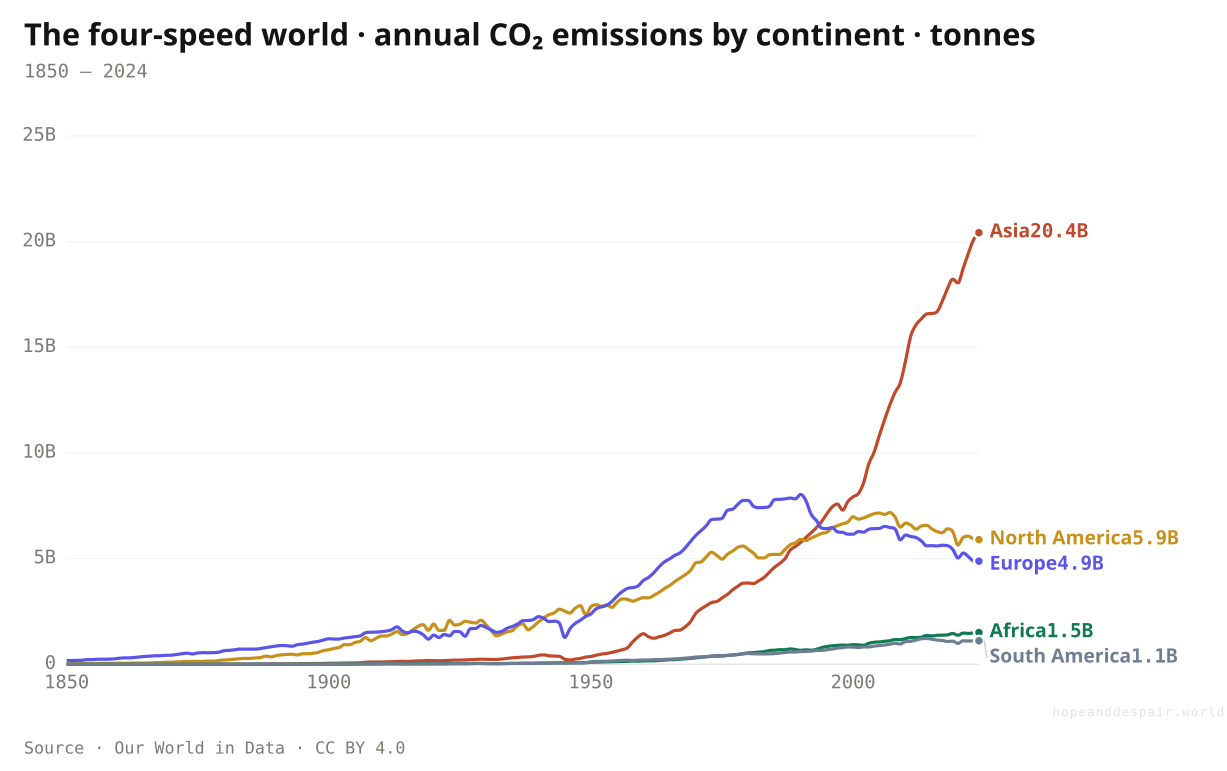
Every year humanity burns more carbon than the last. Annual emissions reached almost 39 billion tonnes in 2024 — another record — and the curve has bent upward, not down, for two hundred years. Until this one line turns over, everything else only slows the rate at which the problem grows.
The one line bending the right way, and fast: wind and solar climbed from a rounding error in 2000 to roughly a sixth of the world’s electricity by 2025, the share doubling every few years. It is the quickest-scaling source of power in history. The only open question is whether it scales quickly enough.
This is the warming already banked. The planet sits about 1.2°C above its mid-century average, and the sharpest part of the climb is the most recent stretch. Every tenth of a degree means more heat in the oceans, longer droughts, and a higher floor under every summer still to come.
Asia now emits more than the rest of the world put together — over 20 of those 39 billion tonnes — having passed Europe and North America early this century. Yet the ledger of who caused it runs the other way: the rich world burned first and longest, while Africa, home to a sixth of humanity, still accounts for under 4% of the carbon.
The damage and the blame point in opposite directions. A person in Qatar emits about 41 tonnes of CO₂ a year and an American 14, while a Nigerian emits well under one tonne and a Congolese barely a tenth of one — a gap of several hundred to one between top and bottom. China now sits in the upper-middle at about 8.7 tonnes, having industrialised on coal. The cruelty of the arithmetic is that the lowest emitters, across Africa and South Asia, stand first in line for the floods and heat the highest emitters set in motion.
Clean electricity is the fastest-growing power source in history, and now the cheapest in most of the world.
Concentration and emissions are both at record highs; the world still adds fossil generation every single year.
Direction and pace disagree: the transition is real, just too slow to stop the warming already locked in.
Nature
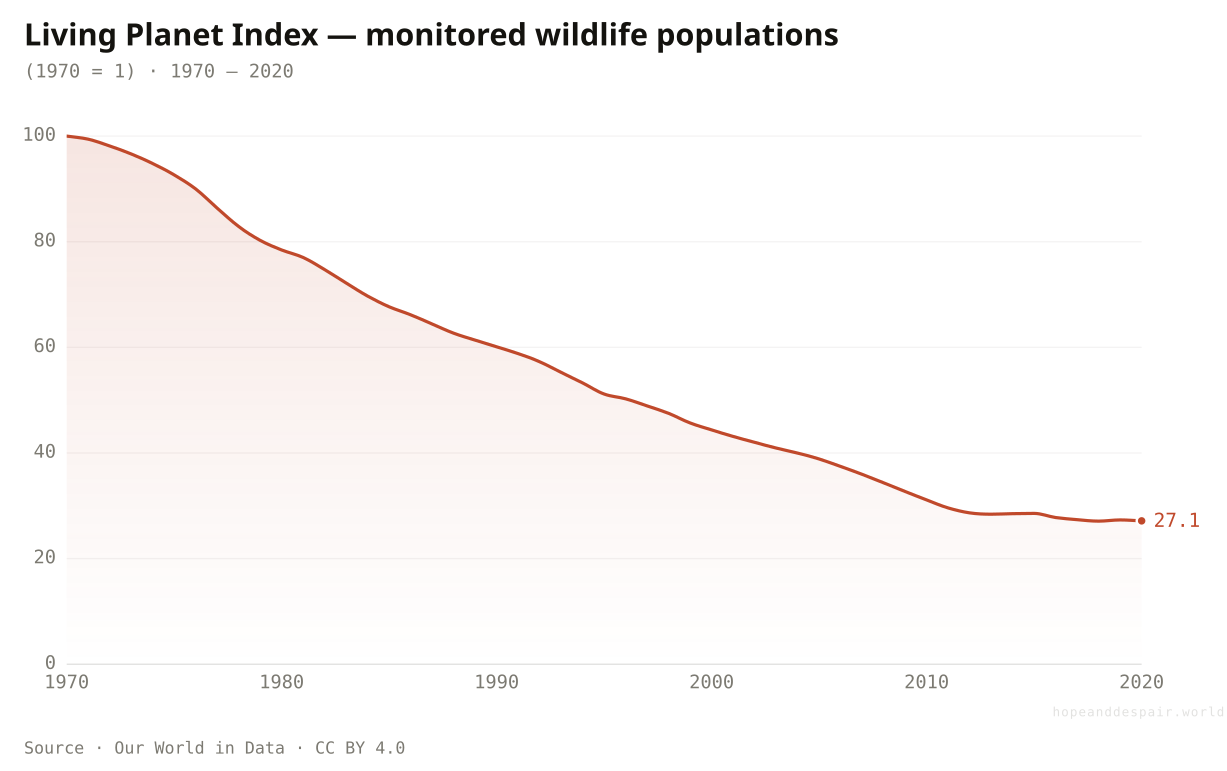
The human world is rising; the wild one is thinning out.
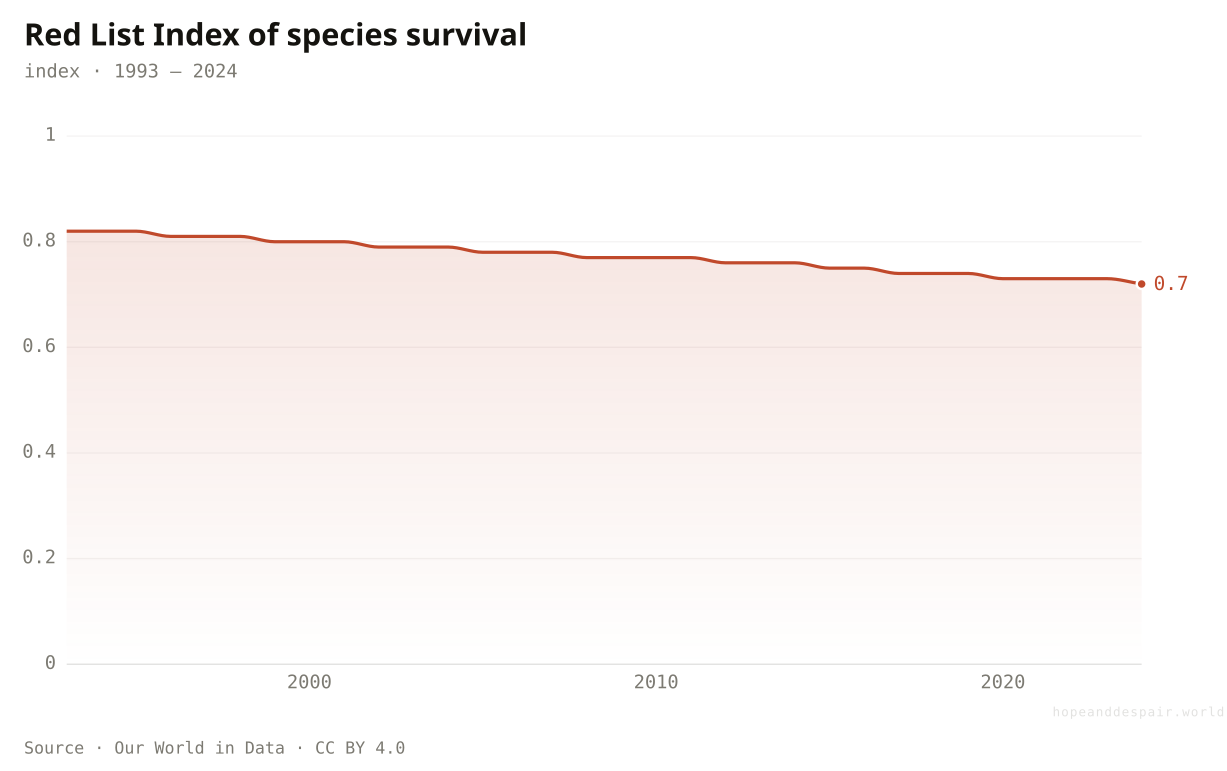
Monitored wildlife populations have fallen sharply since 1970 and the risk of extinction keeps climbing, even as forest loss slows and protected areas spread. The living world is paying the bill for human success.
The Red List Index measures how close assessed species — birds, mammals, amphibians, corals — sit to extinction, where 1.0 means none are threatened. It has slipped from 0.82 in 1993 to 0.72 today, each downward step a species sliding a category nearer to gone. Nothing on this line has been reversed; the only question is the speed of the descent.
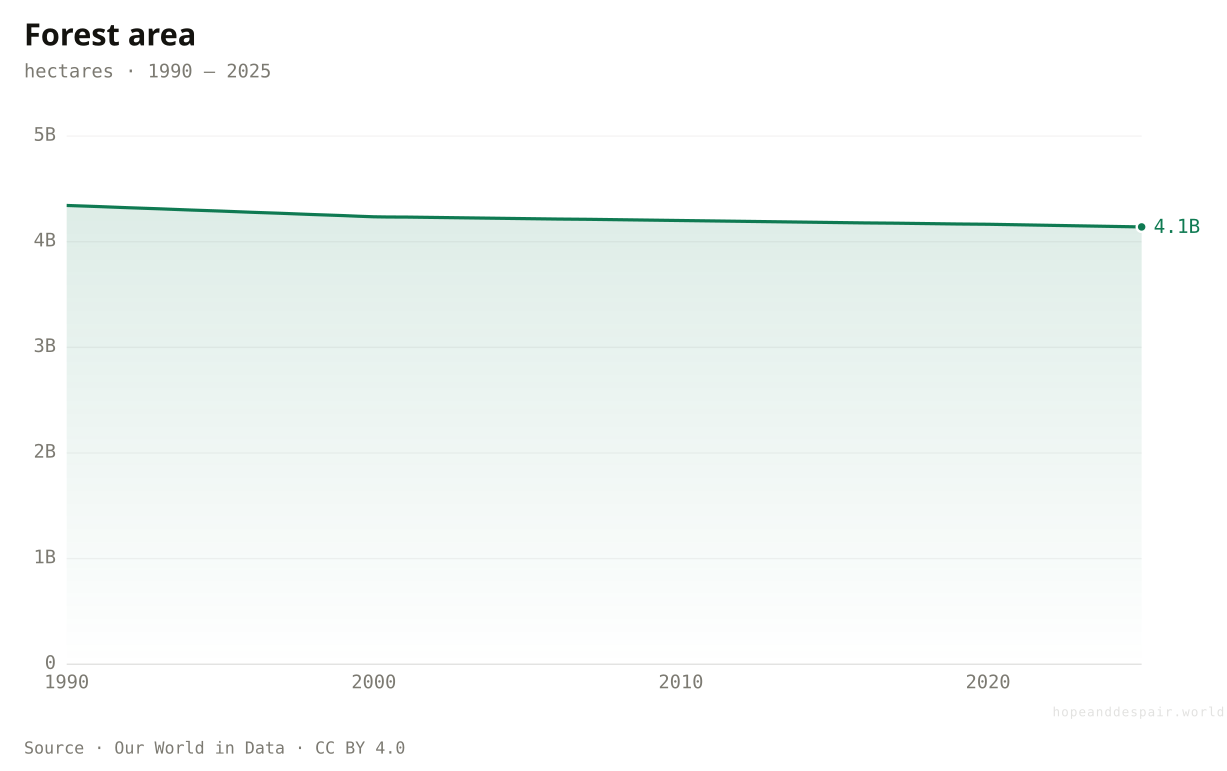
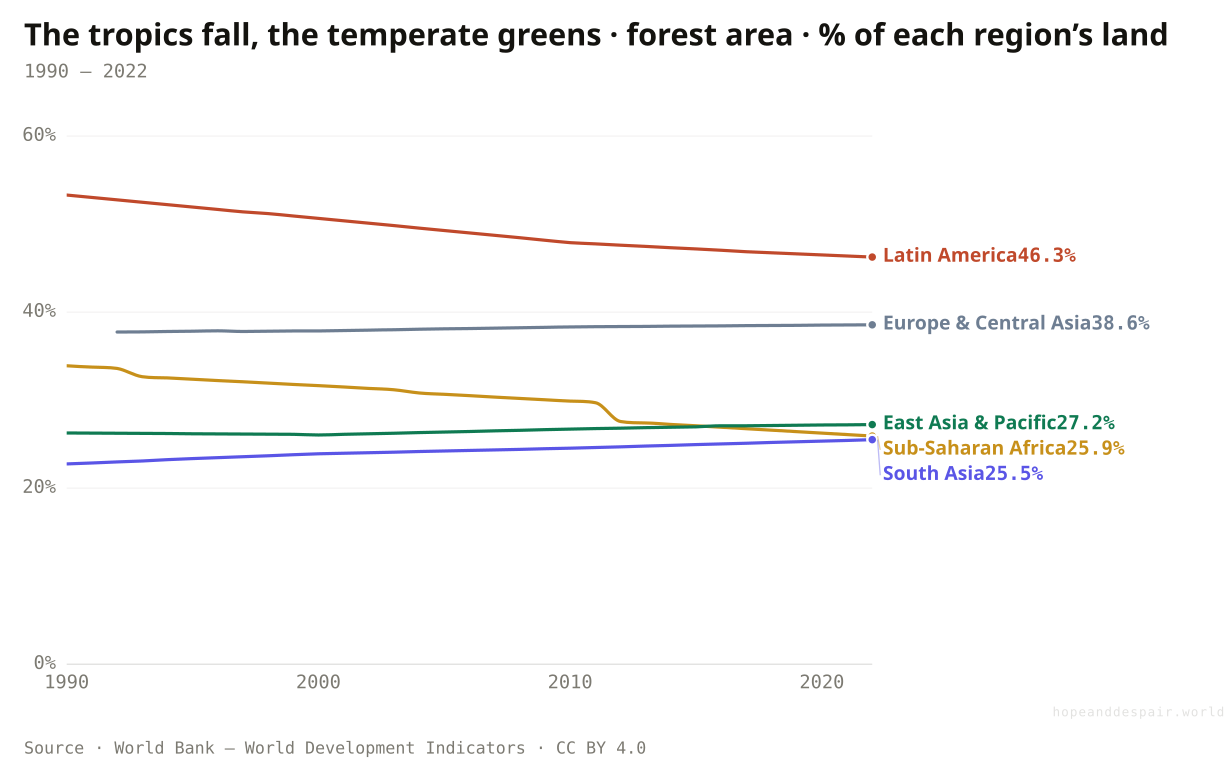
The one hopeful line here, and a fragile one. The world still has less forest each passing year — cover fell from about 4.34 to 4.14 billion hectares since 1990, an area the size of Mexico — but the loss is widening more slowly than it once did, as replanting across Asia and Europe offsets some of the tropical clearing. A wound still open, bleeding less fast.
This is the figure behind the headline that wildlife has collapsed by two-thirds. Among the vertebrate populations scientists track, average size fell about 73% between 1970 and 2020 — though it is an average of trends, not a head count, and a few crashing populations can drag it down further than the typical species has actually fallen. Real and alarming, and more contested than the round number lets on.
Two directions at once. Latin America — the Amazon above all — has lost the most, from 53% forested in 1990 to 46% today, and Sub-Saharan Africa has thinned from 34% to 26%. Europe and East Asia, having felled their forests centuries ago, are slowly putting a little back.
Forest loss is slowing and conservation has pulled real species back from the brink.
Wild vertebrate populations and extinction risk both point the wrong way, with no sign of turning.
How fast nature is emptying is genuinely disputed — the headline wildlife figure is contested by its own methodology.
Animal welfare
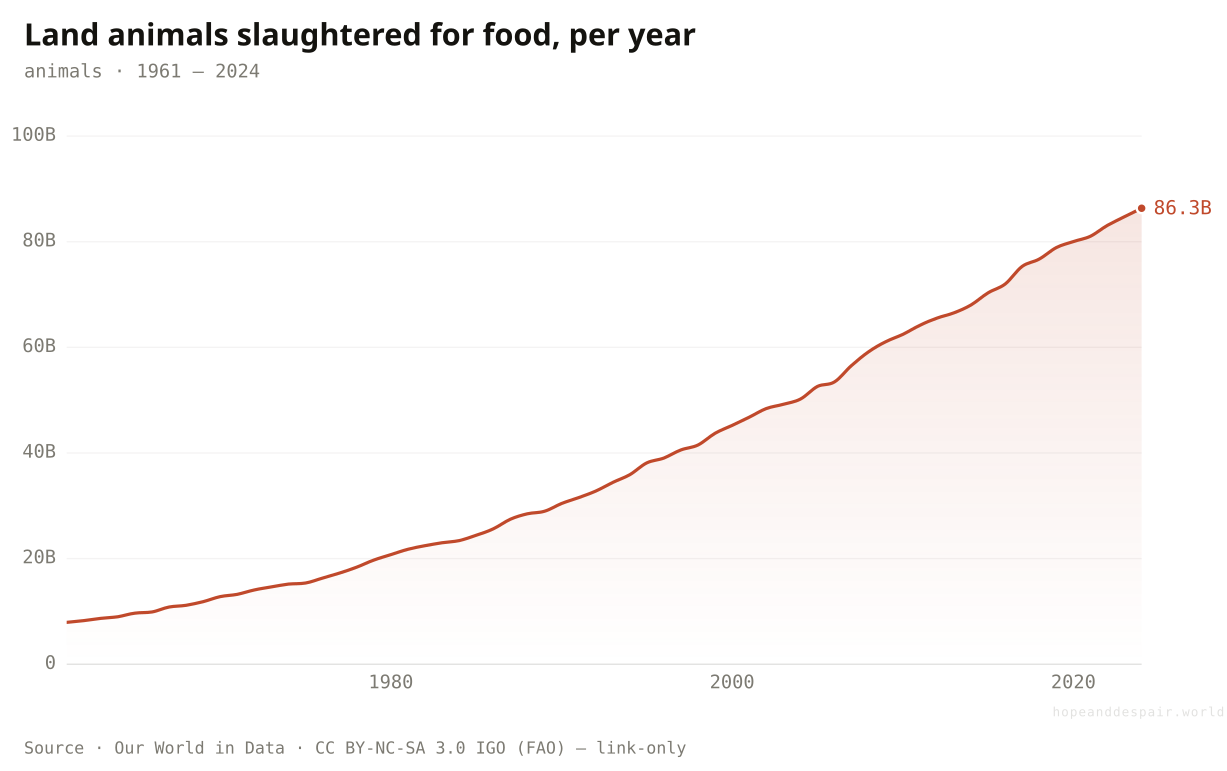
By sheer numbers, the world has never been worse for animals — and it is getting worse fast.
Humanity now slaughters around eighty-five billion land animals a year for food, the overwhelming majority of them chickens, and the number climbs with incomes. Almost every account of a better world quietly leaves this column out.
The line nobody puts on the progress charts. Humanity killed about 8 billion land animals for food in 1961; in 2024 it killed over 86 billion, almost all of them chickens, and the curve rises with the world’s appetite for meat. Every gain in human wealth on this page has so far meant more animals in cages — the one column where a climbing number is unambiguously worse.
The numbers here are almost too large to feel. China slaughters more than 16 billion land animals a year for meat and the United States about 10 billion — overwhelmingly chickens, which now outnumber every other farmed animal many times over. The totals track population and how industrial a country’s farming has become, not appetite alone: France and Germany each kill under a billion, yet eat about as much meat per person as anyone. However the line is drawn, the system takes more animals every year than the last, with little public attention to the curve.
A real animal-welfare movement now exists: cage-free farming is spreading and meat alternatives improve every year.
More sentient creatures are confined and killed each year than at any point in history, almost all in industrial conditions.
Whether this belongs in humanity’s moral ledger at all is exactly the kind of question the numbers cannot settle.
Violence & peace
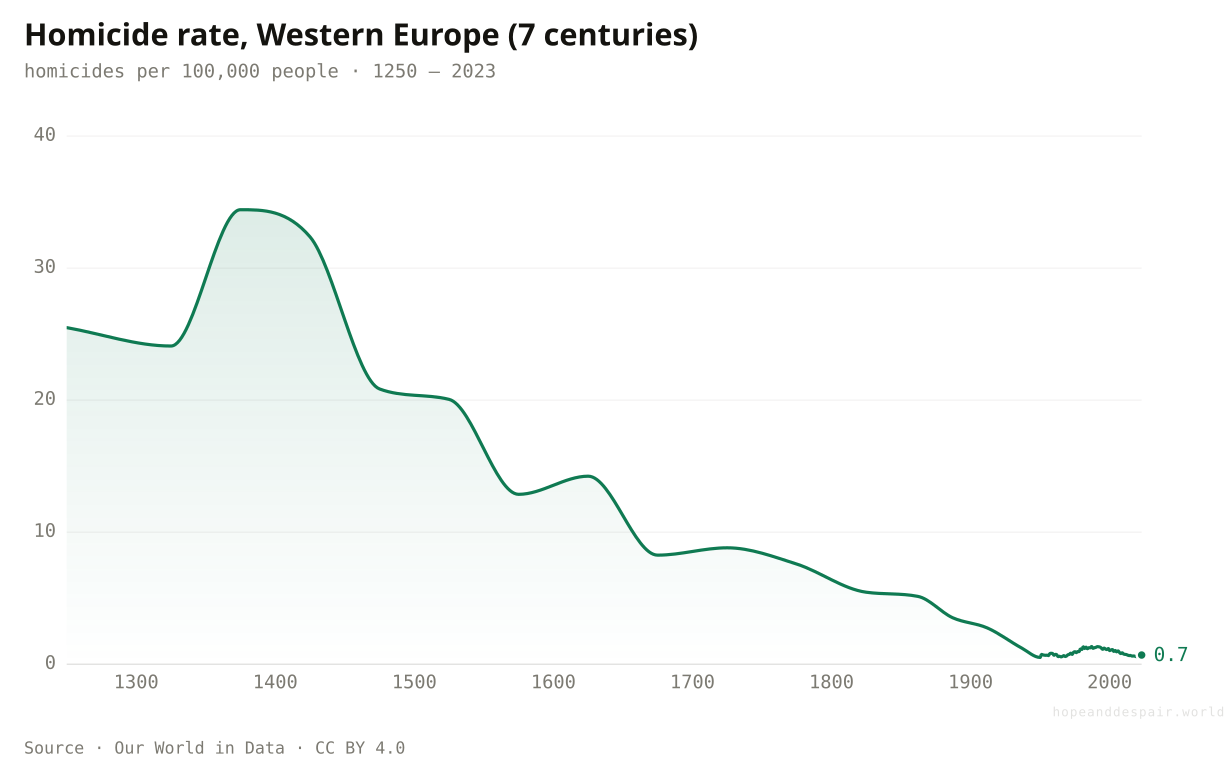
Across centuries, far less violent — across the last decade, fraying.
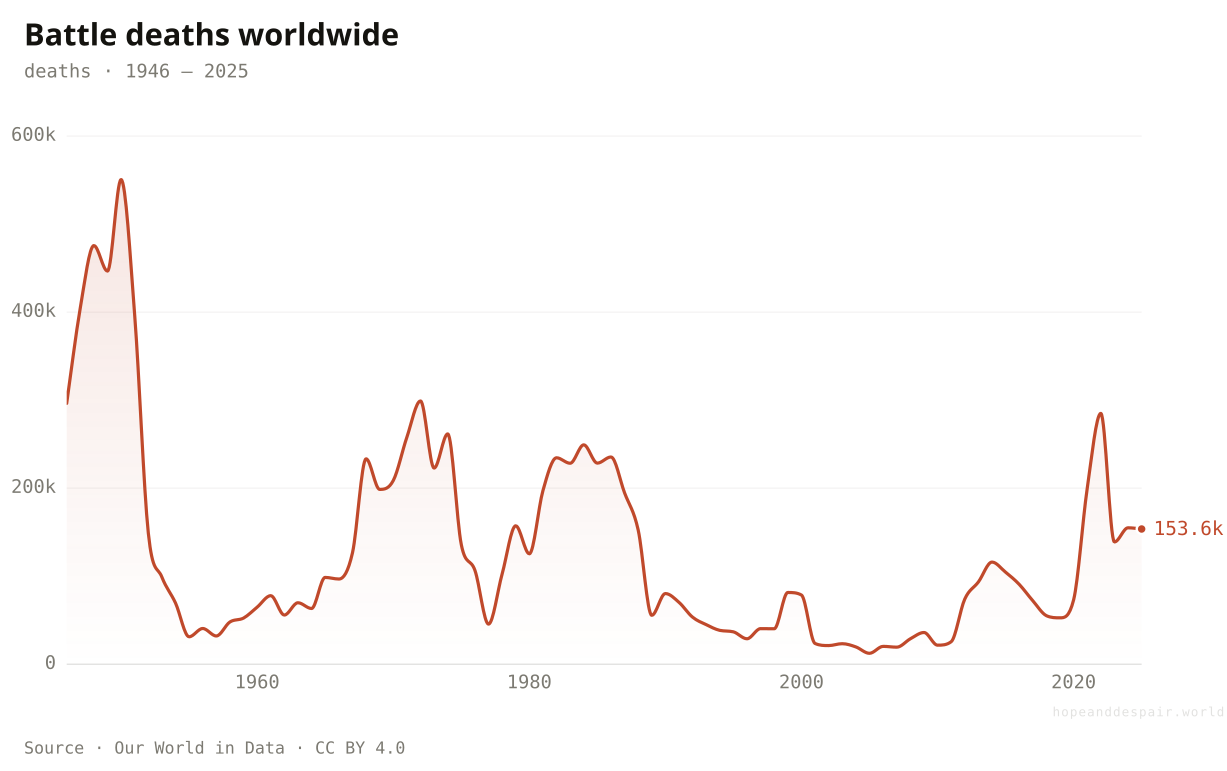
Everyday lethal violence has fallen for seven centuries: a medieval European was dozens of times more likely to be murdered than you are. But since 2020 battle deaths, displacement, and great-power tension have all turned upward at once.
Seven centuries of records, pointing one way. A person in medieval England or Italy was dozens of times more likely to be murdered than someone in Western Europe today — the rate fell from above 30 per 100,000 in the 1300s to well under one now. Daily life grew so much safer, so gradually, that we mistake the calm for the natural state of things. It is the longest record of human behaviour on the page.
The reversal that broke the long peace. Deaths in state-based conflict had fallen to about 12,000 in 2005 — tiny by any historical measure — before Syria, Ethiopia, Ukraine and Gaza drove the toll back above 120,000 by 2024. The series is jagged by nature, one large war dominating a decade, so a single year matters less than the slope — and the slope since 2020 points up.
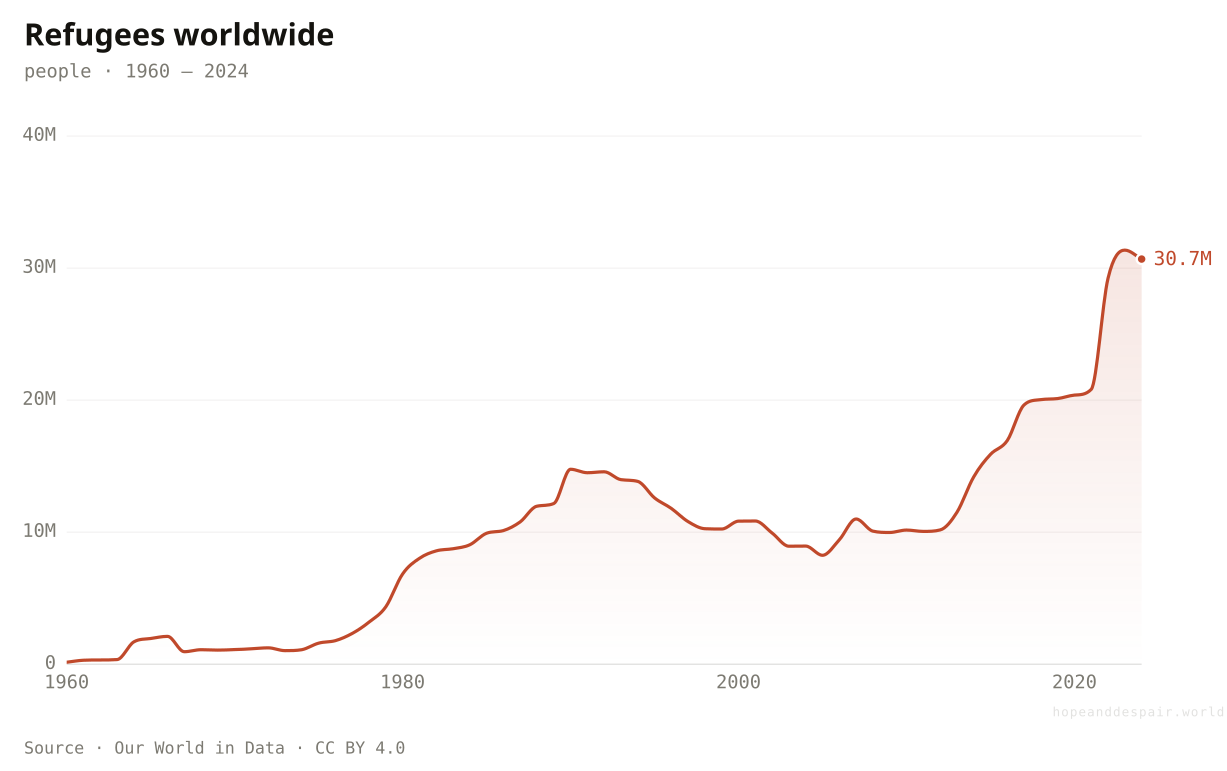
A direct readout of that fraying. The number of people driven across a border by war or persecution has climbed to around 31 million, the most in the six decades of record here, up from a few hundred thousand in 1960. Behind the line sit a handful of catastrophes — Syria, Ukraine, Afghanistan, Sudan — and it leaves out the even larger number displaced inside their own countries.
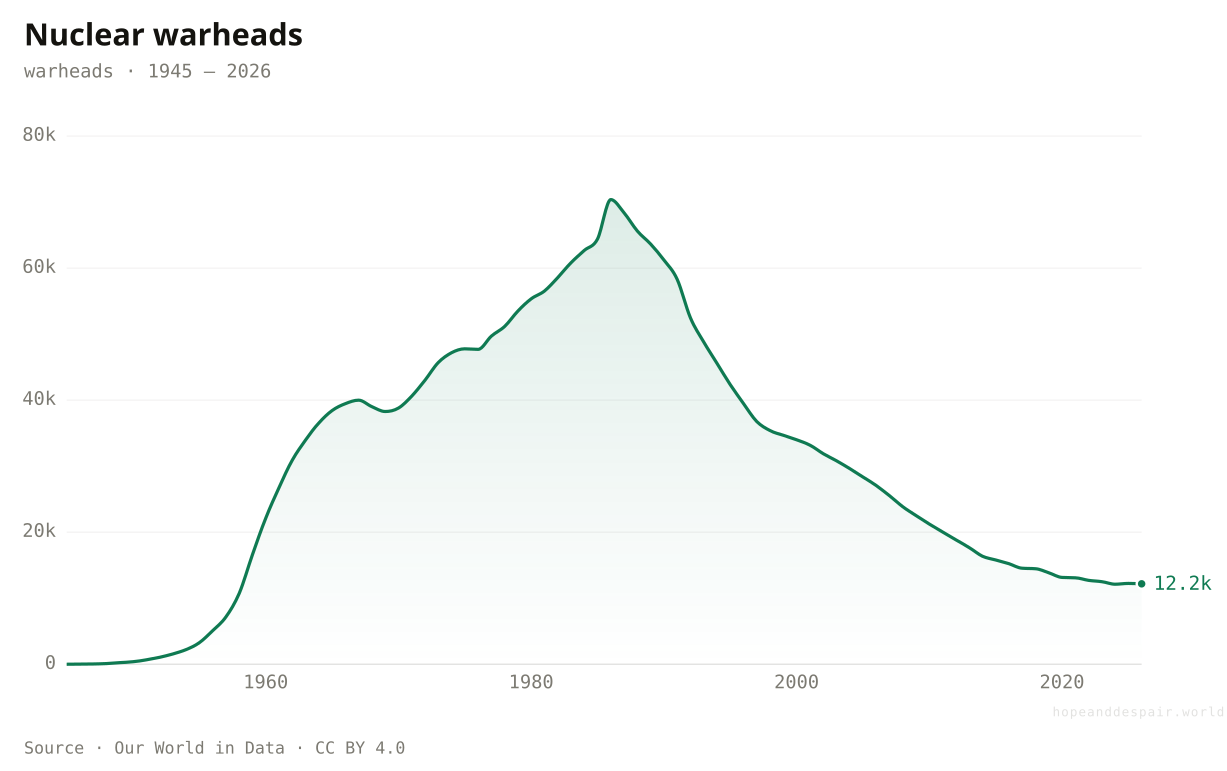
The Cold War’s receding shadow, and the most double-edged 'good’ line on the page. Stockpiles fell from a peak near 70,000 warheads in 1986 to about 12,000 now, as Washington and Moscow stood down most of their arsenals. But the decline has flattened, modernisation is back, and 12,000 warheads remain enough to end civilisation several times over — a smaller sword over a still-bare neck.
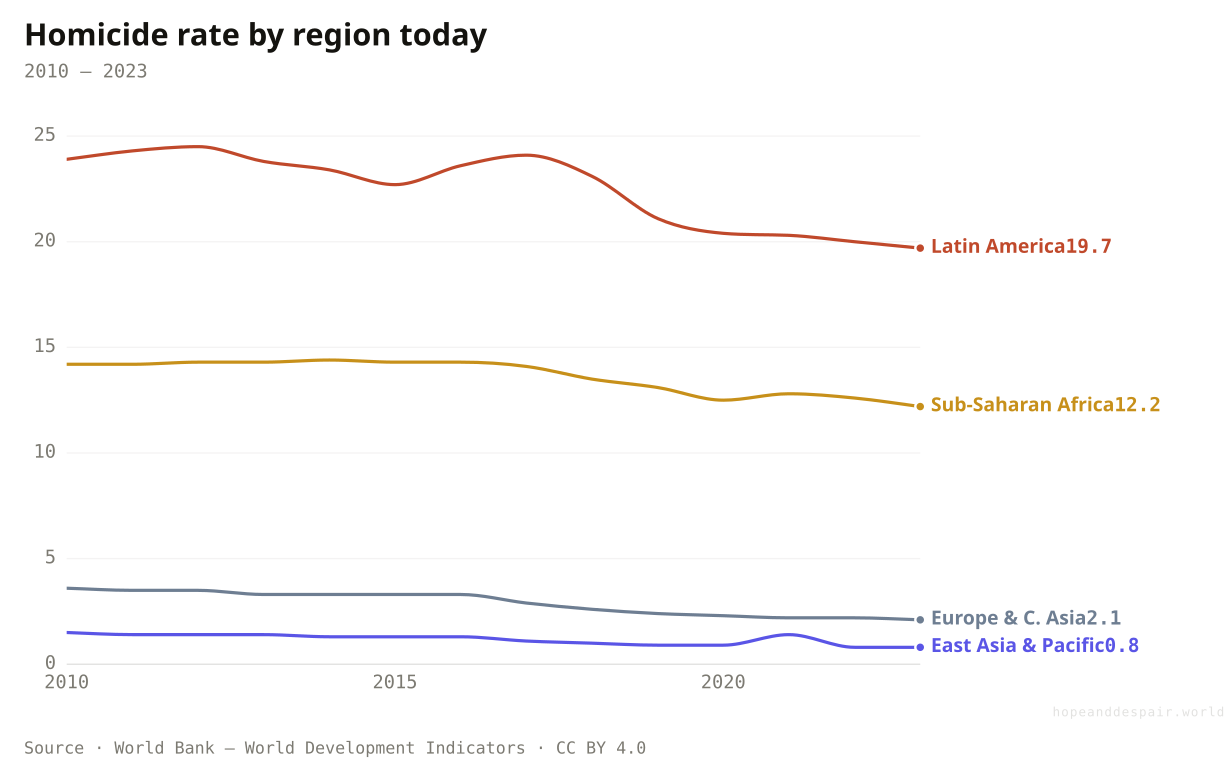
Where lethal violence lives now is not where history would guess. Latin America is the deadliest peacetime region on Earth — around 20 homicides per 100,000 people, roughly ten times Europe’s rate and twenty times East Asia’s — driven by gangs, drugs and weak courts rather than war. The medieval decline reached everywhere; the modern burden settled unevenly.
Murder is wildly uneven across the map. Jamaica and South Africa run above forty killings per 100,000 — common enough to shape daily life — while Singapore and Japan sit so near zero that a single murder can make national news. Latin America carries much of the world’s lethal violence, with Mexico and Colombia near twenty-five and Brazil close behind. The United States is the outlier among rich nations at 5.8 — roughly four times France’s rate and nearly thirty times Japan’s — proof that wealth alone is no shield.
Everyday lethal violence has fallen for seven centuries — the long arc bends hard toward peace.
The long peace is fraying: war deaths, displacement, and great-power tension are all rising again.
Whether the recent reversal is a blip or a turning point is exactly what the data cannot yet say.
Wealth & inequality
The world grew vastly richer — yet the share flowing to the very top has barely moved in two centuries.
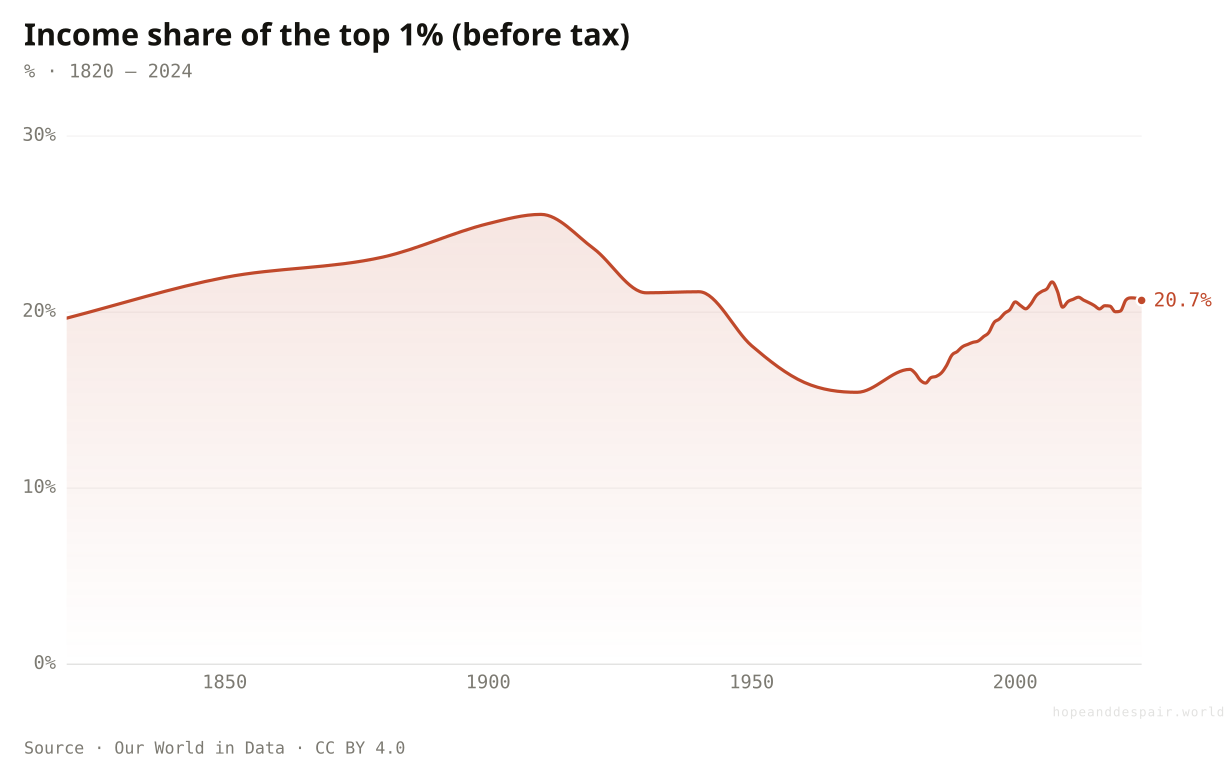
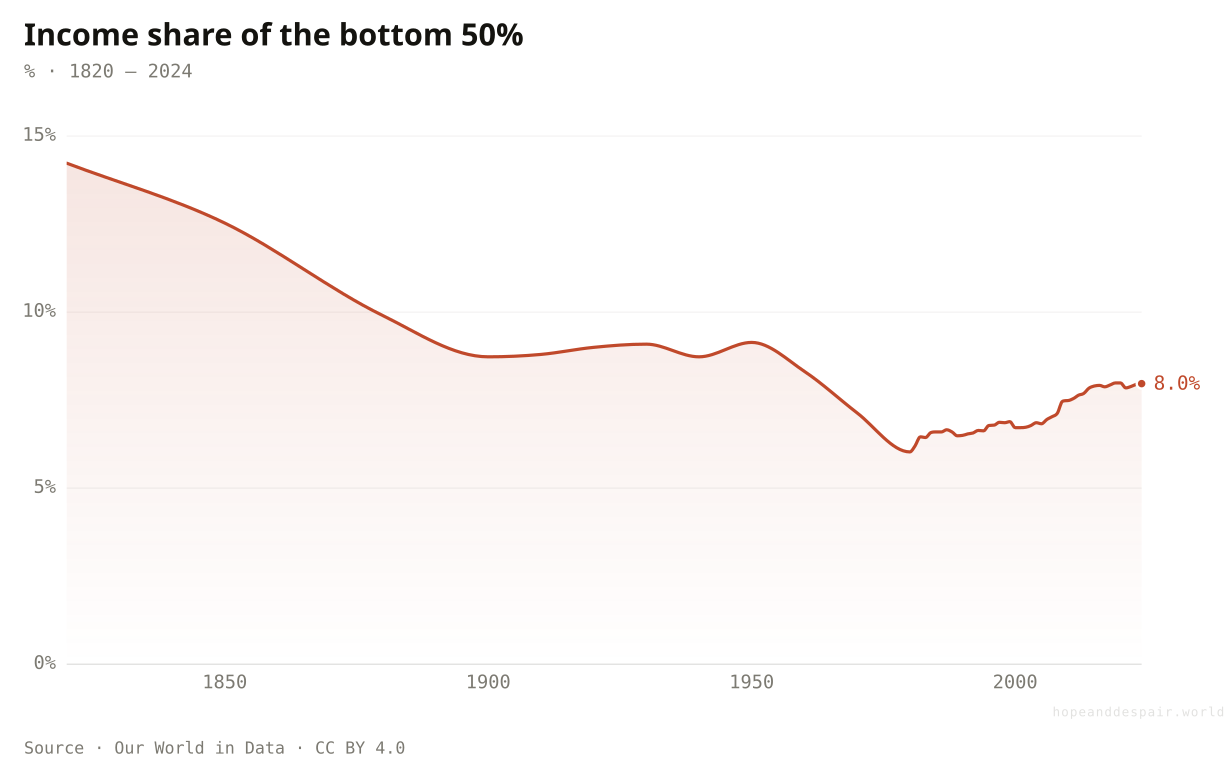
Extreme poverty has collapsed and the average income has multiplied. But the top one percent still takes about a fifth of all income, almost exactly its share in 1820, while the share going to the bottom half has actually fallen.
Two centuries of upheaval, and the top still takes the same cut. The richest 1% captured 19.7% of world income in 1820 and 20.7% today, with a dip in the mid-20th century — when war and steep taxes briefly squeezed the very top — long since clawed back. The world transformed beyond recognition; the share flowing to the top of it barely moved.
The floor rose even as the ceiling held. Measured against an absolute line, the bottom is far better off: the share living under $8.30 a day fell from 70% in 1990 to about 44% now, as Asia’s poor climbed toward the middle. Shares of the pie can stay fixed while billions still escape destitution — which is exactly why the floor and the ceiling tell opposite stories.
The other end of the same ledger. The bottom half of the world’s adults — about four billion people — share under 8% of global income between them, down from roughly 14% in 1820. For every dollar earned worldwide, the poorest half splits less than eight cents, while the richest hundredth takes more than twice that from far fewer hands.
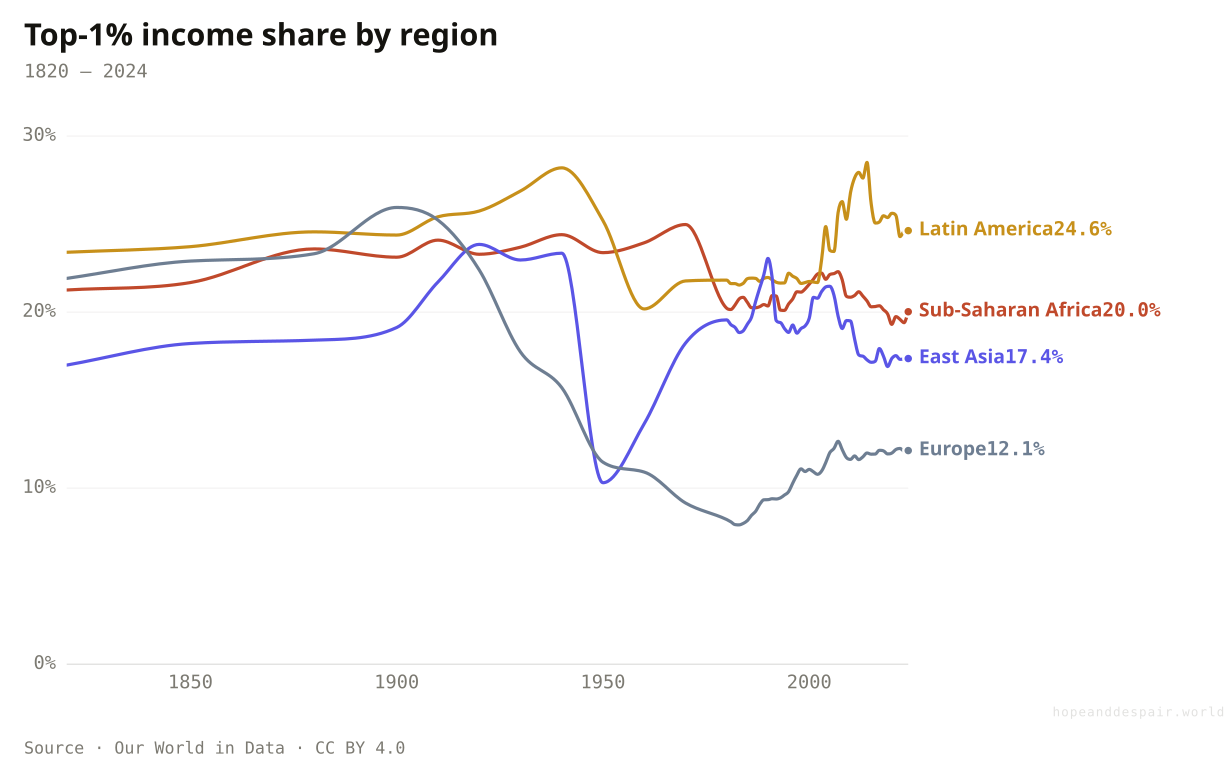
Inequality is not one number but many. Latin America has been the most top-heavy region for two centuries, its richest 1% still taking nearly a quarter of all income; Europe is the most equal, having roughly halved the top’s share since 1900. Where the rich ended up taking less, it was politics — unions, taxes, welfare — that made it so, not growth alone.
Inequality within nations varies as much as the gulf between them. South Africa and Namibia, still shaped by their histories, are among the most unequal societies ever measured — Gini scores in the mid-to-high 50s, a sliver of the population holding most of the income. The United States, near 42, is markedly more unequal than Germany or Sweden, which sit around 30. China, once imagined as egalitarian, now reads about 36 — above Germany and Britain, if still short of the US. The rich world has reached nothing like a shared answer on how much gap is bearable.
The bottom has risen fast in absolute terms: a billion people have left extreme poverty in a generation.
The very top’s share is stuck near where it was two centuries ago; the bottom half’s share has shrunk.
Whether inequality is 'getting worse’ depends entirely on whether you measure the floor or the ceiling.
Energy transition
Clean power is the fastest-growing energy source in history — and still not fast enough.
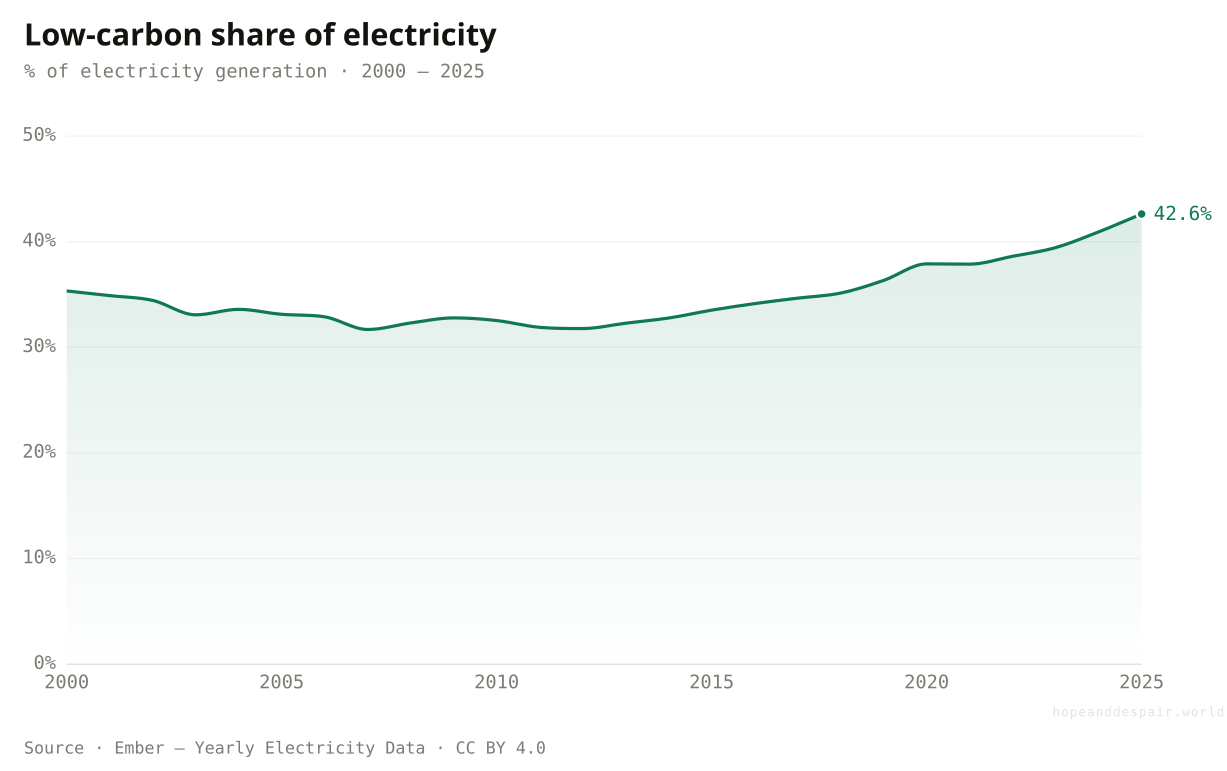
Wind and solar have gone from a rounding error to a sixth of the world’s electricity, and the price of solar has fallen more than five-hundredfold since 1975. Yet electricity demand grew faster still, so the world burns more fossil fuel than ever.
Two of every five units of the world’s electricity now come from a source that burns no carbon — wind, solar, hydro and nuclear together — up from about a third in 2000. The climb is real but gentler than the headlines imply, because surging demand keeps refilling the fossil side as fast as clean power is added. The share is rising; the carbon, not yet falling.
The number that spoils the celebration. The world now generates almost twice as much fossil-fuelled electricity as in 2000 — roughly 18,000 terawatt-hours against 10,000 — because clean power has so far been stacked on top of coal and gas, not swapped in for them. Until this line turns down, the rising clean share is winning a race the atmosphere is still losing.
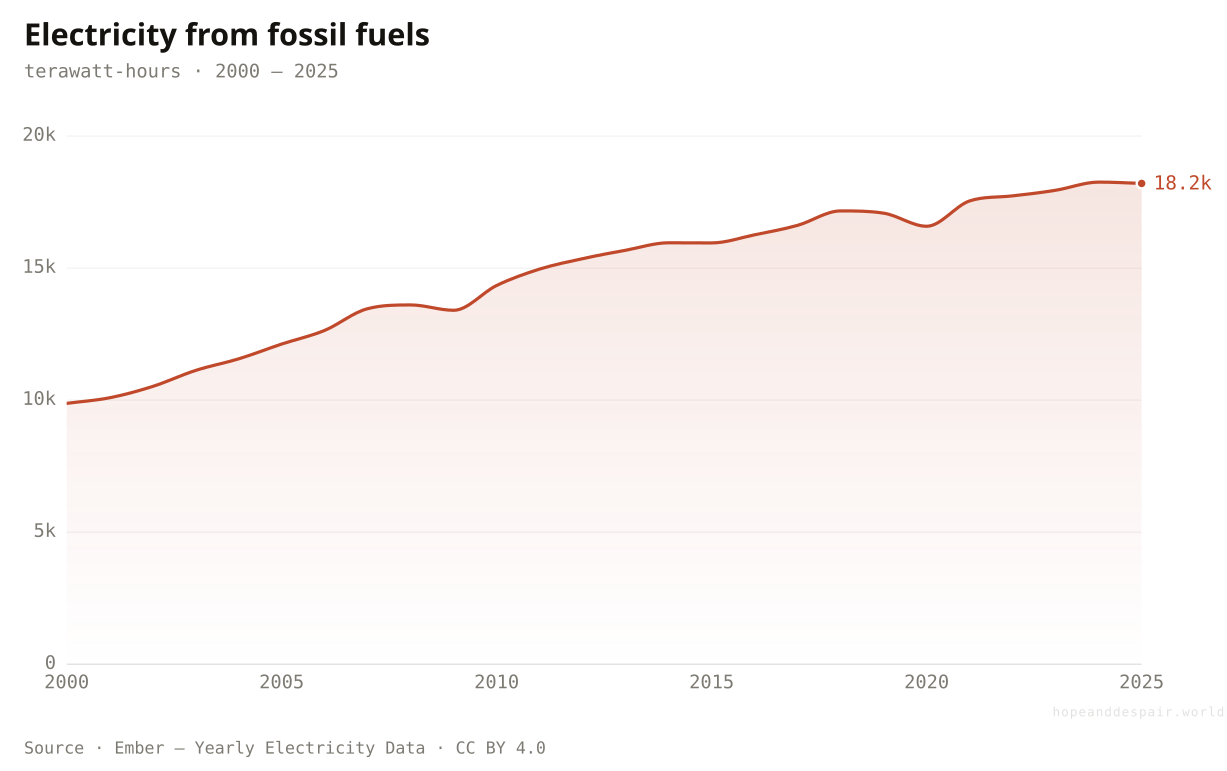
Perhaps the most consequential line in all of energy. A watt of solar cost about $128 in 1975 and costs around 26 cents today — a fall of roughly five hundredfold, among the steepest sustained price collapses ever recorded for anything made by people. Cheap sunlight is why clean power is no longer a subsidy story but an economic one: across most of the world, new solar is now simply the cheapest electricity there is.
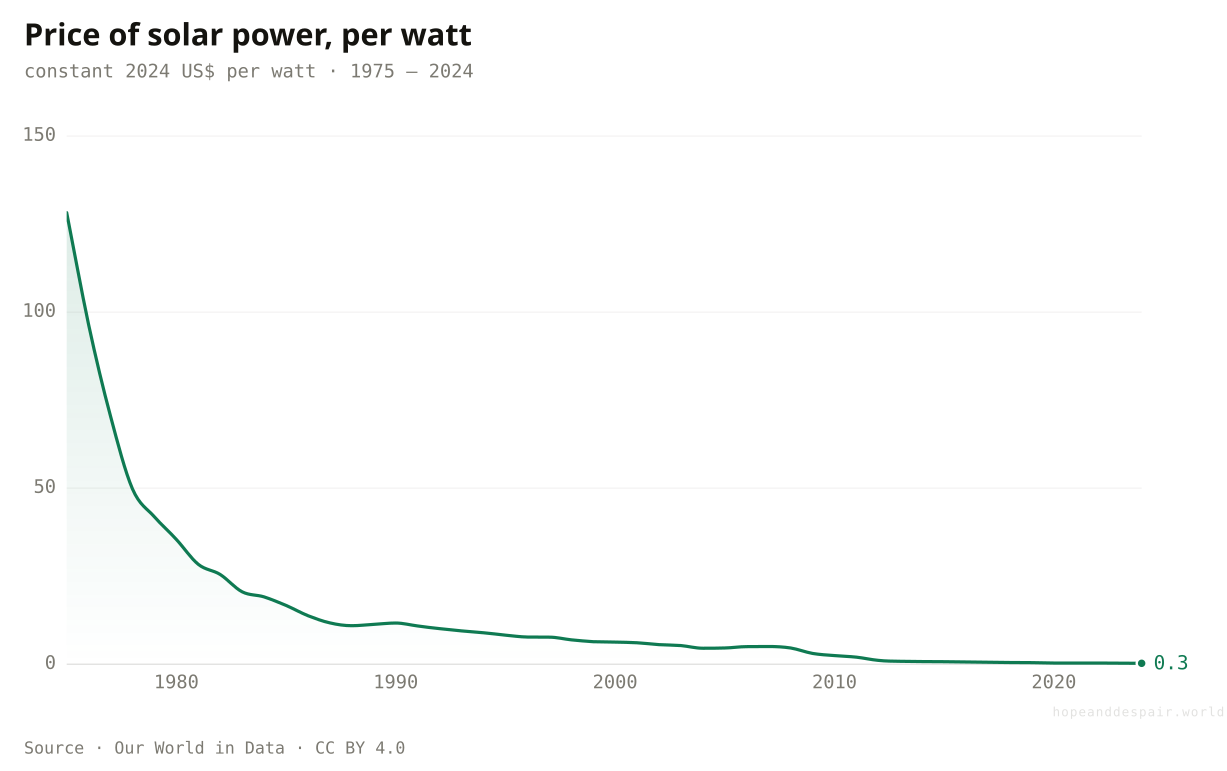
One transition running at four speeds. Europe already draws more than three-fifths of its power from low-carbon sources; Africa, barely a quarter — and the gap is less about will than money, since the grids and solar farms that decarbonise a country cost what poor ones do not have. The cleanest electricity belongs, for now, to those who burned the most coal first.
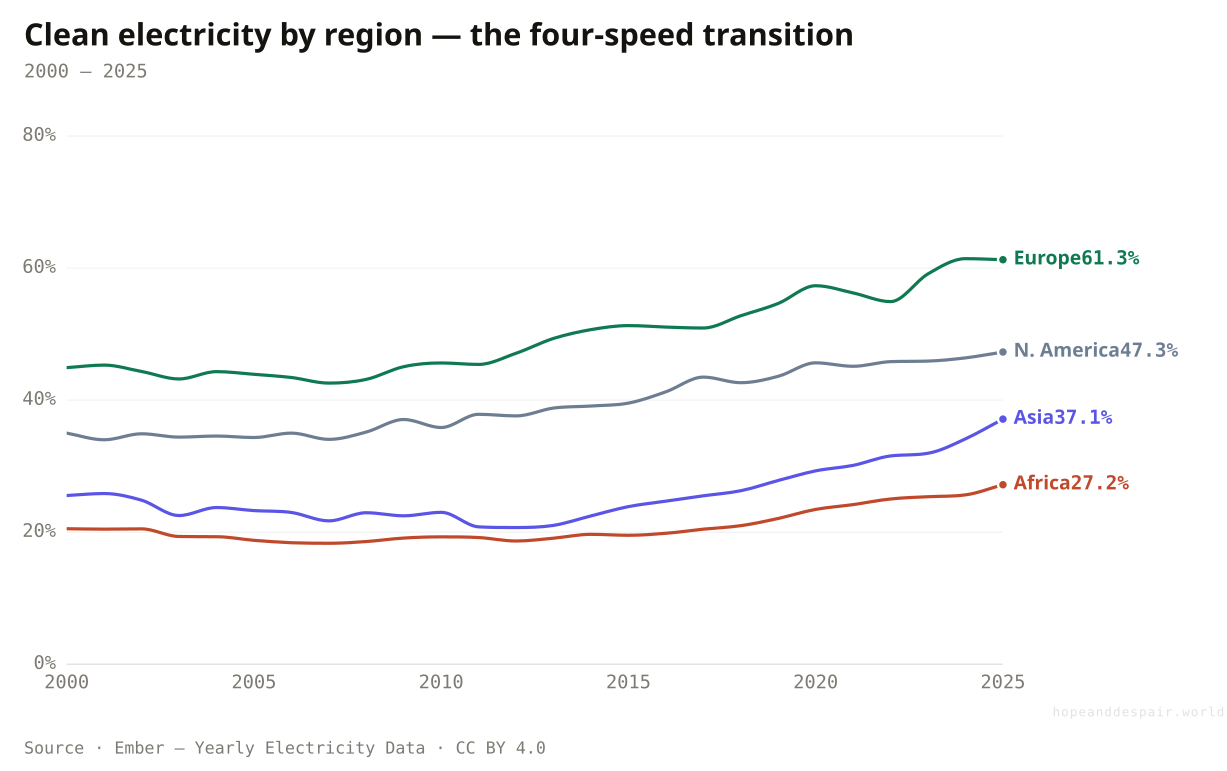
The solar-cost collapse is one of the great technological stories of the century — clean power is now the cheapest there is.
Renewables are adding to supply, not yet replacing it: fossil generation keeps setting records.
Direction and pace disagree — the transition is unstoppable and too slow at the same time.
Science & progress
More science is produced every year than ever — and it may be yielding less.
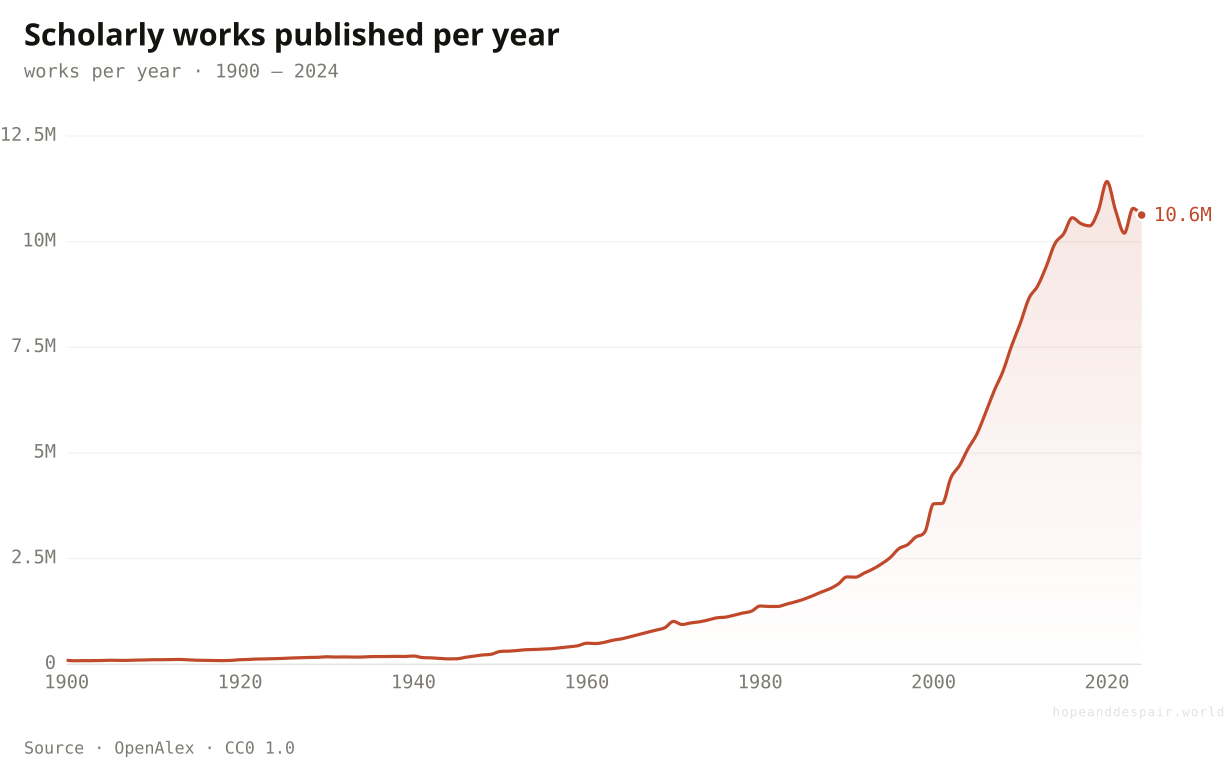
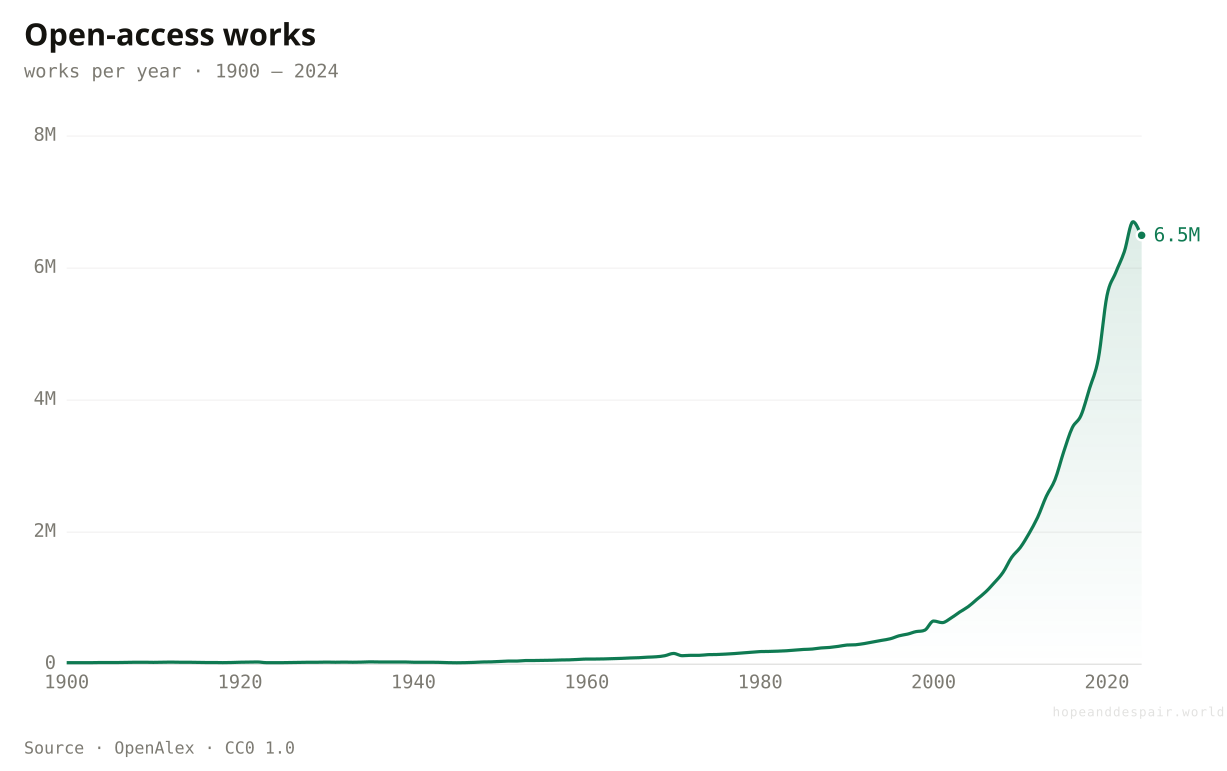
The world now publishes over ten million scholarly works a year, up from under a hundred thousand a century ago, and ever more of it is open to read. Yet research spending climbs while breakthroughs, by several measures, are getting harder to find.
More research pours out each year than anyone could read in a thousand lifetimes. The world published under 100,000 scholarly works in 1900 and more than 10 million in 2024 — roughly a hundredfold rise, steepest in the last two decades. But volume is not discovery; the same flood feeds a growing worry that ever more papers are chasing ever thinner slices of the unknown.
A quieter gain hides inside the flood. More than half of all new research is now free to read: open-access works rose from a trickle to over 6 million a year, around three-fifths of the total, prising science loose from paywalls that long shut out anyone without a university login. The knowledge is multiplying, and more of it than ever is public.
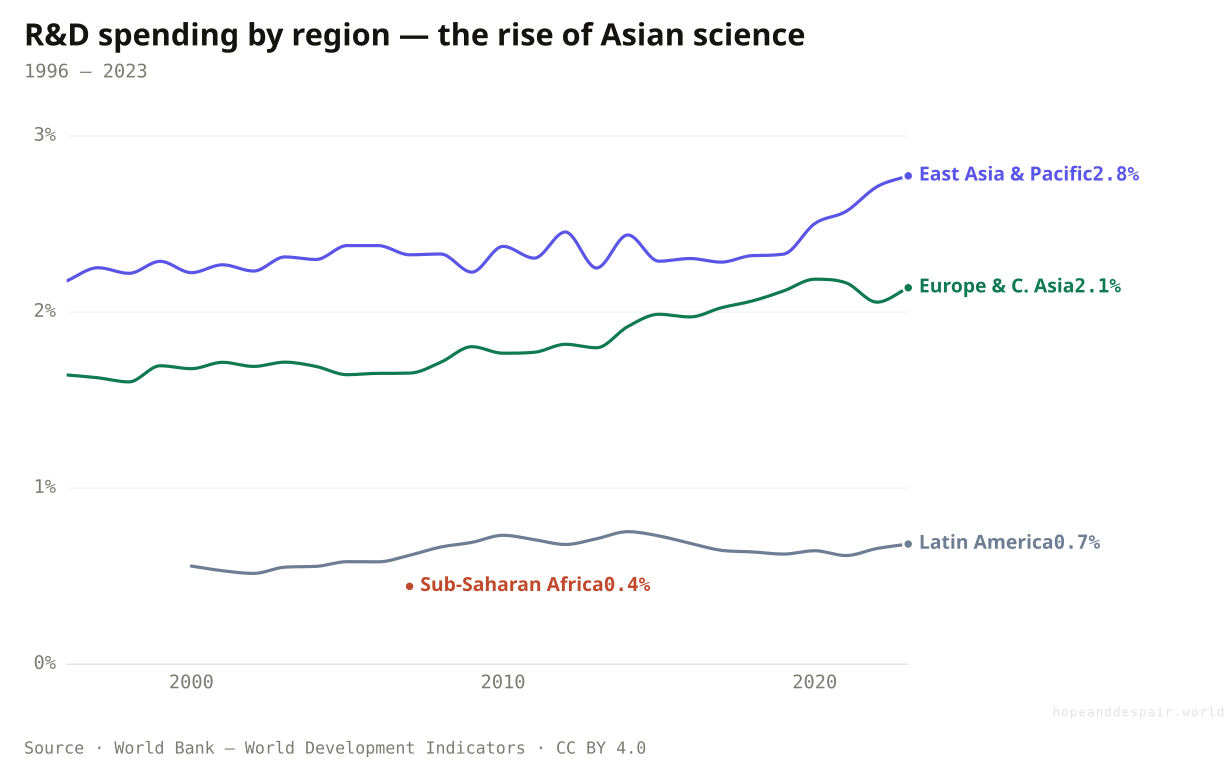
The centre of gravity in research is sliding east. East Asia and the Pacific now spends a larger share of its economy on research than Europe does — about 2.8% against 2.1% — a reversal from a generation ago, when the West held an easy lead. China above all has gone from scientific bit-player to rivalling the United States in sheer output.
The geography of science has been redrawn inside a generation. China now publishes nearly 900,000 scientific papers a year, almost twice the United States, with India third and climbing fast — a reversal that would have read as fantasy in 1990. Germany and Japan each still sit near 100,000, producing far more per person than the giants above them. Raw output rewards size and says nothing about whether the work is any good — but the centre of gravity has plainly moved east.
Research output and funding keep climbing, and ever more of it is open to anyone, anywhere.
Breakthroughs may be getting harder to find — more papers and more money buy less disruption.
Counting outputs can’t tell us whether knowledge is deepening or merely accumulating.
Happiness
Richer, longer-lived, better-fed — and no happier on average.
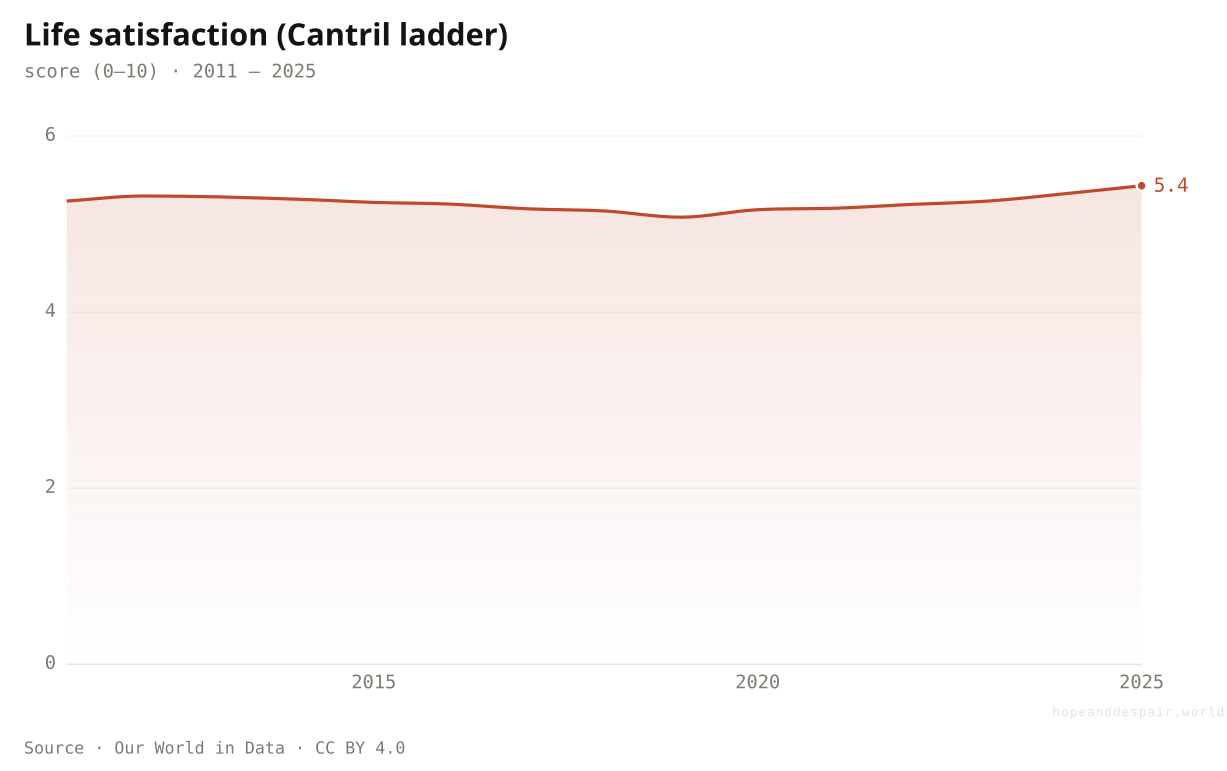
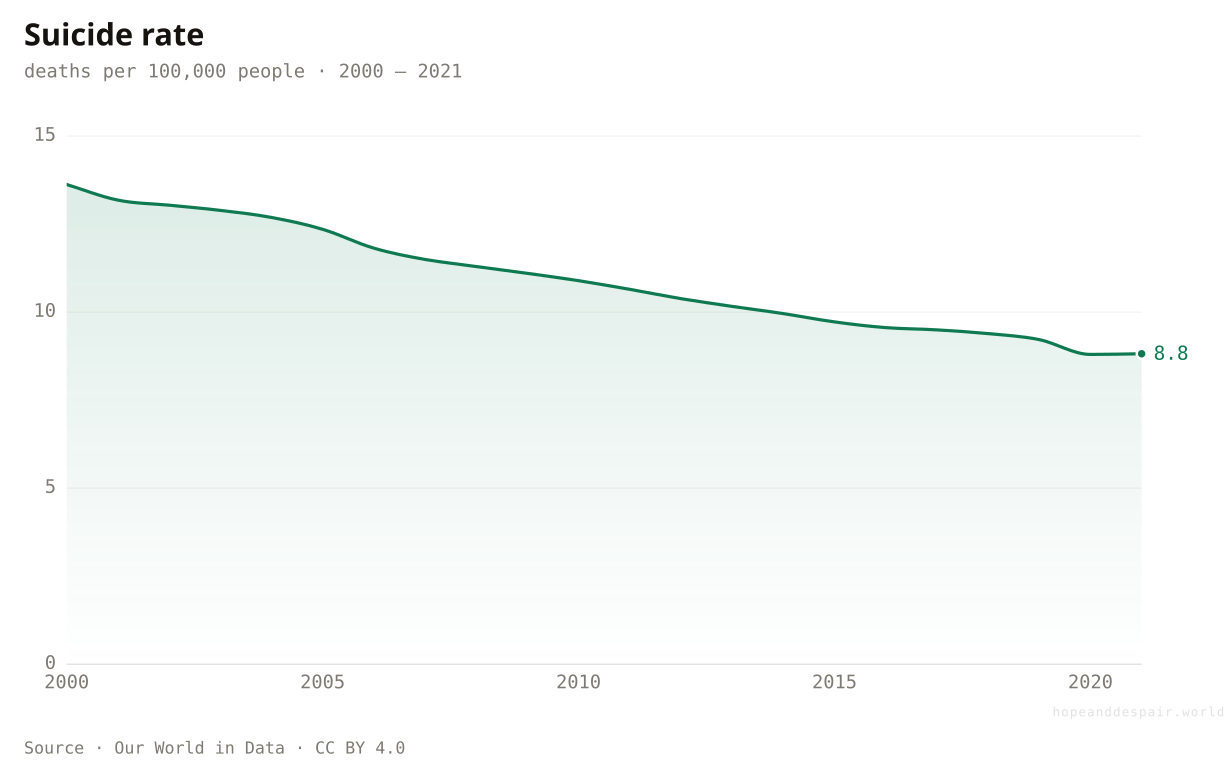
Self-reported life satisfaction has barely shifted for as long as it has been measured well, even as almost every material measure improved. The one clear movement is hopeful: the suicide rate has fallen by a third this century.
Ask the world to rate its life from zero to ten and the answer barely moves — about 5.4, near-flat across every year it has been measured well. The strangeness is in the comparison: incomes, lifespans and schooling all climbed steeply over the same span while this line held still. Wealthier, healthier, no more satisfied.
The hopeful counter-current beneath that flat average. The global suicide rate fell by about a third this century, from roughly 13.6 to 8.8 deaths per 100,000 — a quiet retreat at the very edge of human despair, led by sharp declines in China and India. Fewer people are reaching the last resort, even as everyday contentment refuses to climb.
Ask people to score their own lives from zero to ten and the extremes rarely surprise: Finland leads at 7.8 with the Nordic countries just behind, while Afghanistan sits at the floor, 1.4, a figure that reads like a measure of collapse. The middle is where it gets interesting. China reports 6.1, comfortably above India’s 4.5 and Nigeria’s 4.8, despite India’s far louder optimism about its future. Income buys a great deal of life satisfaction — but past a point, peace and health appear to buy more.
The suicide rate has fallen by a third this century — a quiet sign of fewer lives at the very edge.
Life satisfaction has flatlined despite decades of material progress; in some rich countries the young report falling well-being.
Either we adapt to every gain, or the things that make a life good were never in the data to begin with.
Freedom & democracy
Two centuries of democratic gains — and a clear retreat over the last fifteen years.
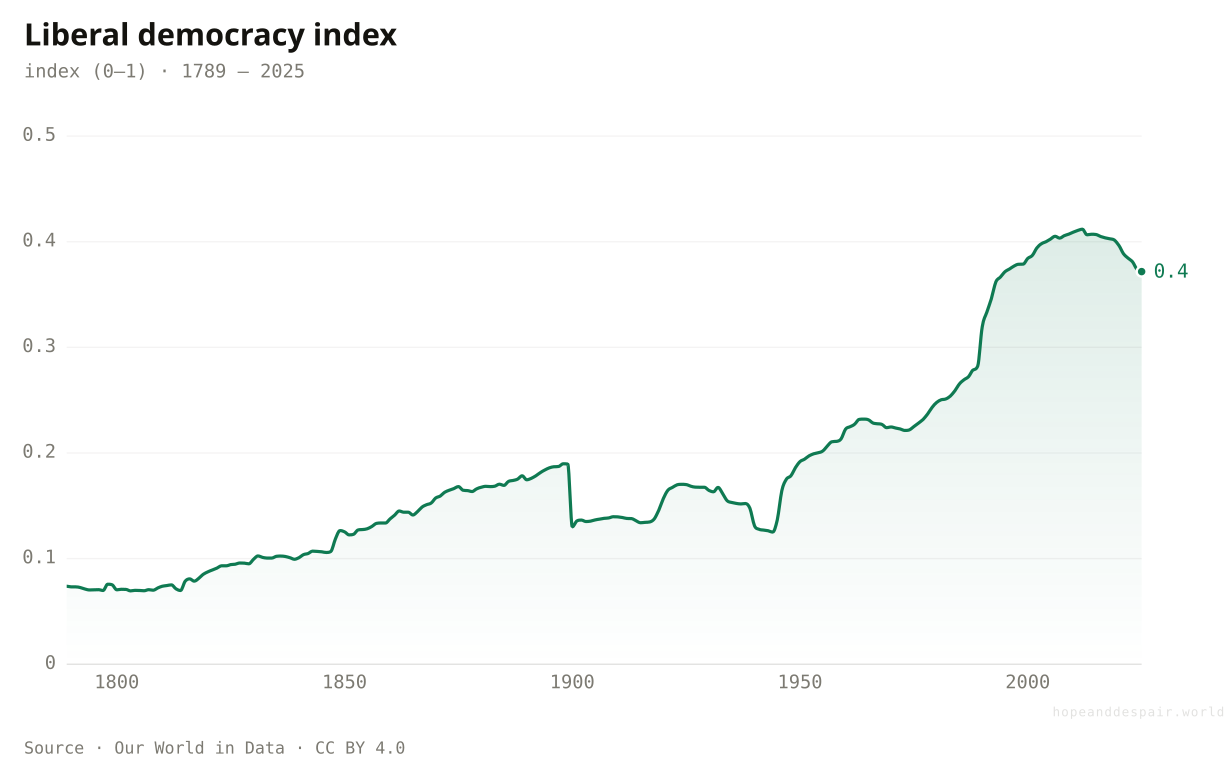
By most measures the world grew steadily freer from the nineteenth century through the 2000s. Since then the trend has reversed: the average person now lives in a less democratic country than they did in 2010 — the 'third wave of autocratisation’.
The average person lives in a freer country than their great-grandparents did — and a less free one than they did in 2012. The index rose for two centuries to a high around 0.41, then slipped to about 0.37 as elected leaders hollowed out courts and presses from within. This is the 'third wave of autocratisation’, and weighted by population it is unmistakable.
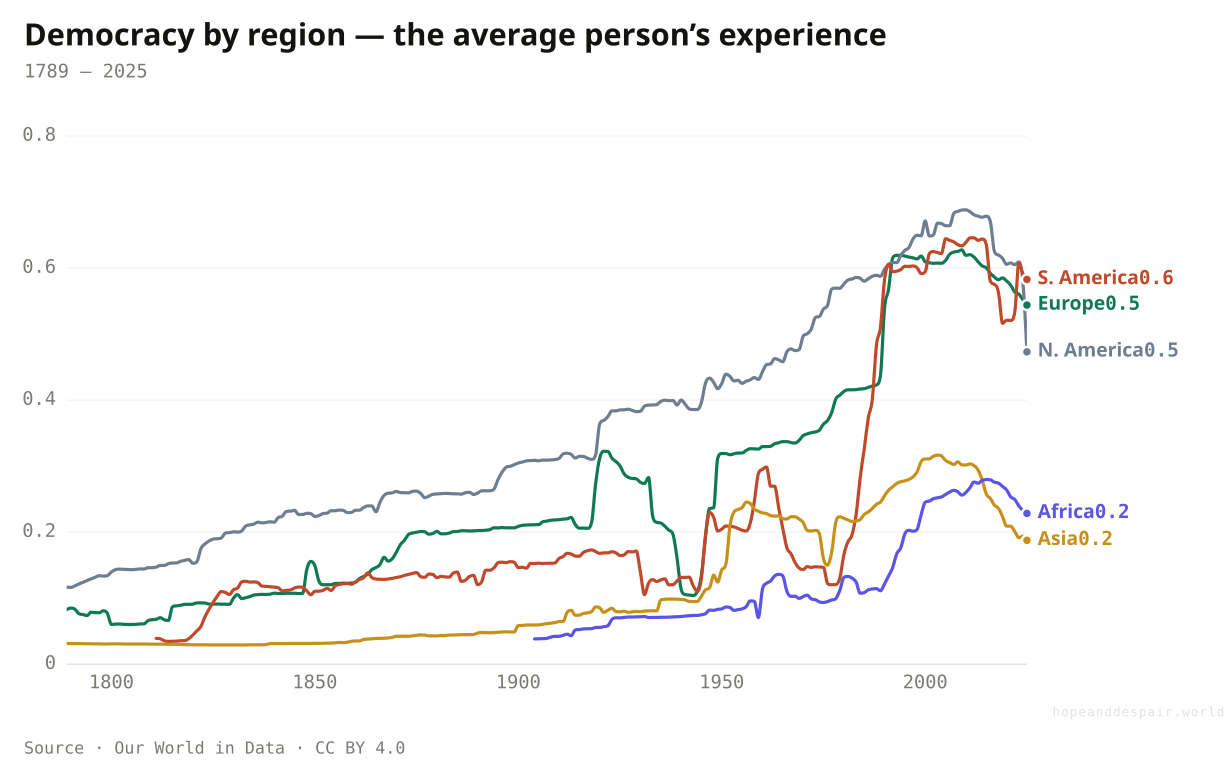
The retreat is sharpest where democracy seemed safest. North America, long held up as the model, has fallen hardest — its score down by nearly a third from a 2010 peak as institutions strained under pressure. Even Europe, still the most democratic region, now sits below its 2009 high. The backsliding runs through the wealthy democracies that thought themselves immune — while South America, a generation on from its dictatorships, is the rare region still well above where its past left it.
Democracy is not a switch that is on or off; it runs by degrees. Denmark and Sweden sit near the top of the scale, around 0.85, while the United States now occupies an uneasy middle at 0.57 — still a democracy, a notch below the nations it once lectured. India, the largest democracy by headcount, scores lower again, about 0.26: V-Dem now rates it close to an 'electoral autocracy’, its institutions worn by a decade of majoritarian pressure. Russia and China sit near the floor, where elections are ritual or absent.
Across two centuries the trend is unmistakable: more people choose their rulers than ever before.
Democracy has been in retreat for fifteen years; the median person’s freedoms are narrowing, not widening.
The long arc and the recent slope disagree — and which one matters depends on how long you mean to live.
Work & jobs
Far fewer workers are trapped in working poverty — yet precarious, informal work is still the global norm.
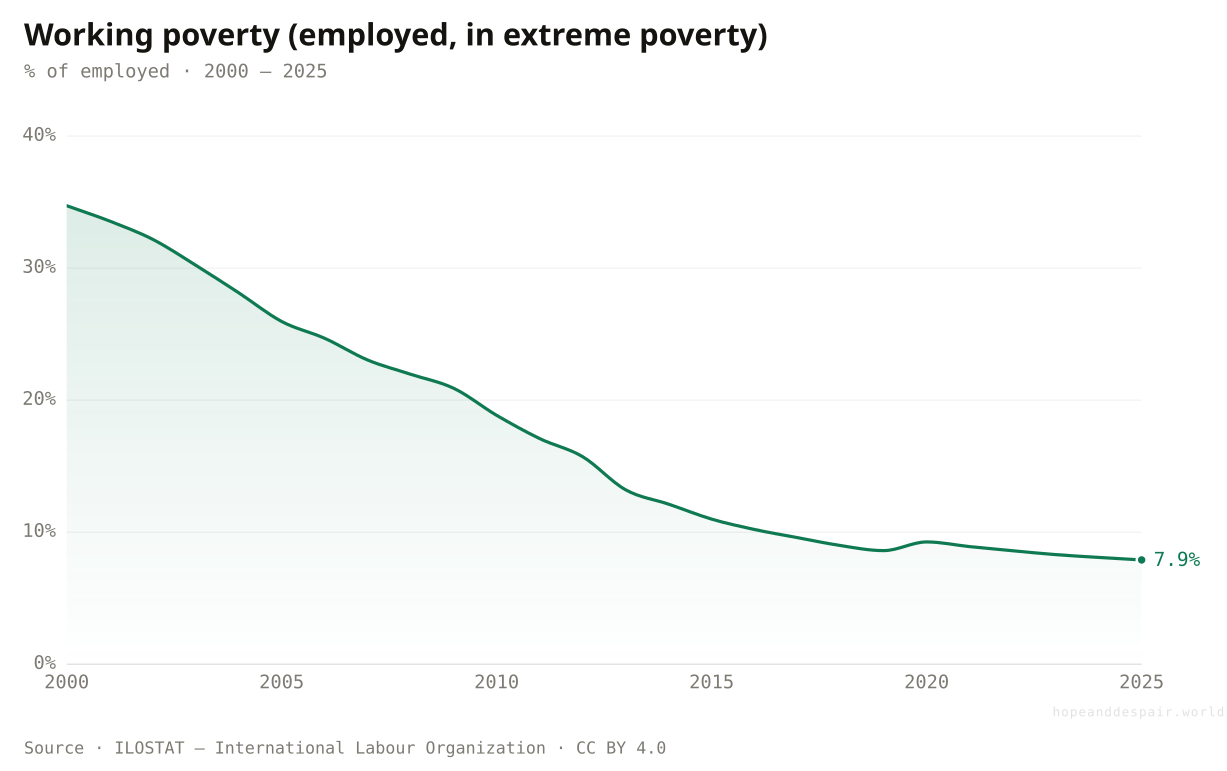
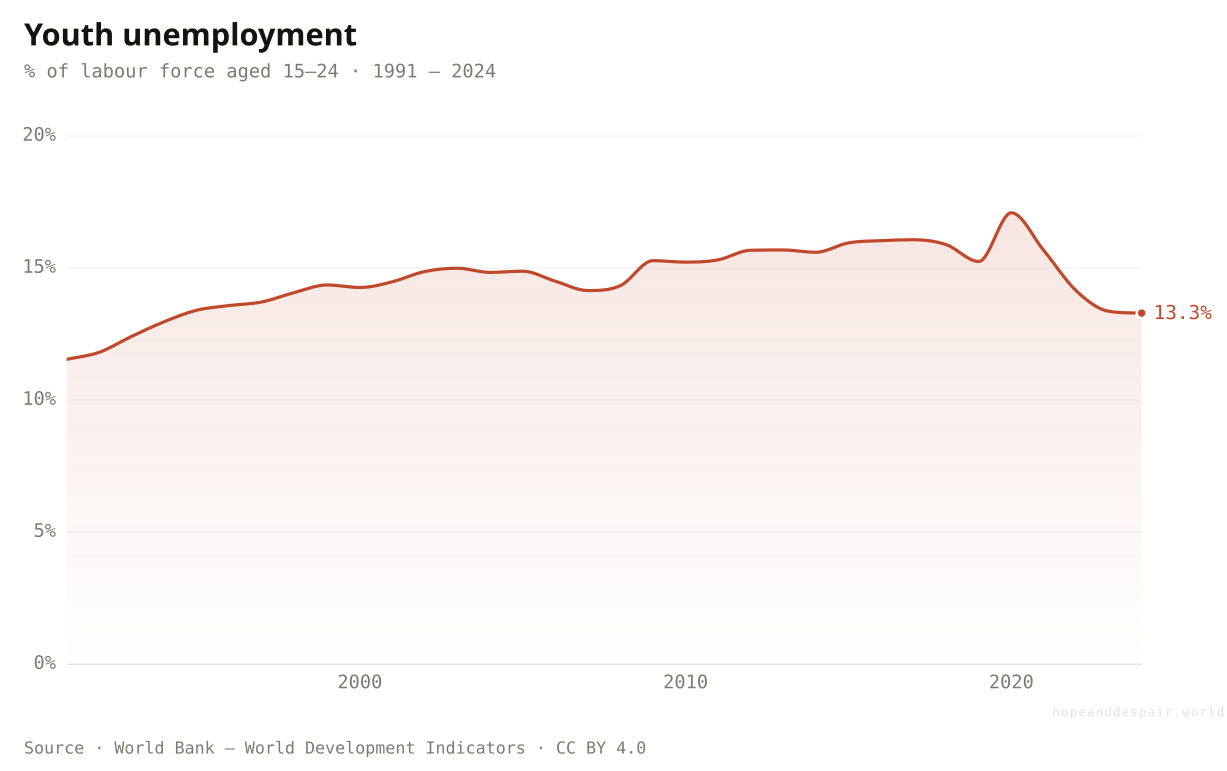
The share of the world’s workers living in extreme poverty collapsed from a third in 2000 to under a tenth. Yet more than two in five remain in vulnerable, own-account or family labour, and youth unemployment is creeping up.
Having a job once did little to keep you out of extreme poverty; now, far more often, it does. The share of the world’s workers in extreme poverty collapsed from about a third in 2000 to under one in twelve today, on the back of rising wages across Asia. Work is paying its way out of misery — even where the work itself stays informal and insecure.
The catch falls on the young. Even as work lifts older adults clear of poverty, the global youth unemployment rate has drifted upward — from about 11.5% in 1991 to over 13% now, spiking near 17% in the pandemic year. A generation better schooled than any before it is finding the first rung of the ladder harder to reach.
Unemployment is the rare measure where a low number can hide bad news. South Africa’s 32% is a genuine catastrophe — a third of everyone who wants work cannot find it. But Thailand’s 0.8% and Vietnam’s 1.6% do not mean those economies are healthier than the United States or Germany; across much of the developing world almost no one can afford to be openly unemployed, so people take whatever informal, unprotected work they can find, and the count records them as employed. The figure captures whether you have any work at all, not whether it pays a living or lasts the year.
Work pays its way out of poverty far more often than it did — a job now far more often means a living.
Most of the world still works without a contract or a safety net, and the young struggle to find work at all.
Fewer working poor and more precarious workers describe the same labour market from two angles.
Trade & globalisation
The world wove itself together through trade — then, around 2008, the weaving stopped.
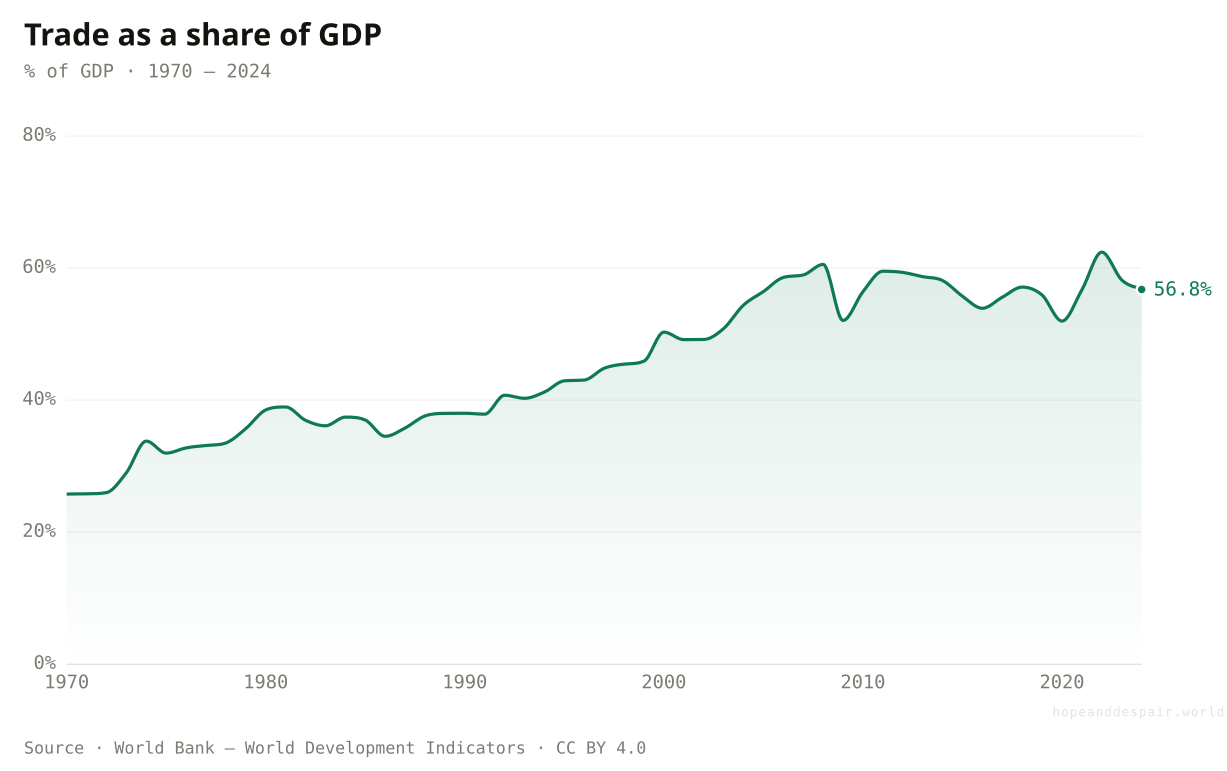
Trade grew from a quarter of world output in 1970 to over sixty percent by 2008, lifting hundreds of millions out of poverty along the way. Since the financial crisis it has plateaued, and politics has turned toward tariffs and walls.
The world stitched itself together, then stopped pulling the thread. Trade more than doubled as a share of world output — from a quarter in 1970 to nearly 60% today — carrying hundreds of millions out of poverty as factories moved to wherever labour was cheap. But the climb ended with the 2008 crisis; the line has wobbled sideways ever since, just as politics turned toward tariffs and walls.
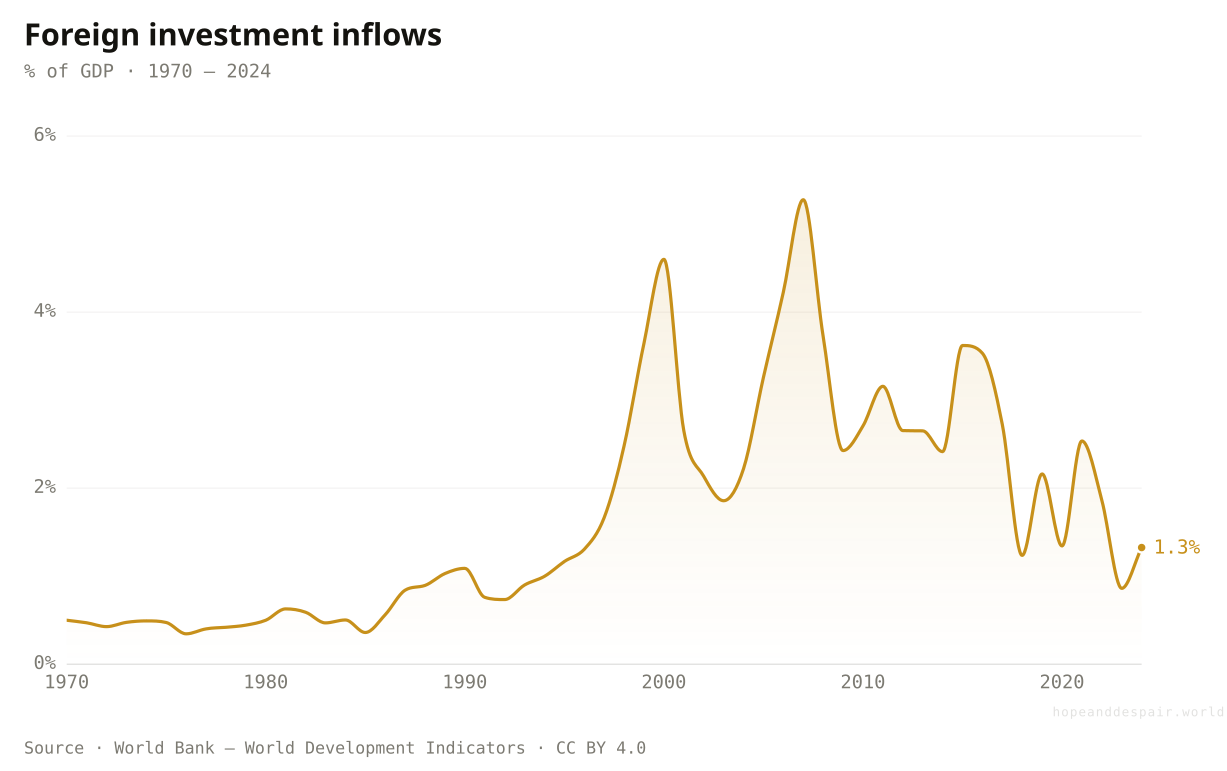
The deeper retreat hides in capital, not goods. Foreign direct investment — factories and firms built across borders — peaked near 5% of world output just before the 2008 crash and has sunk to barely 1.3% since, as companies grew wary of far-flung supply chains. Money, even more than trade, has been quietly heading home.
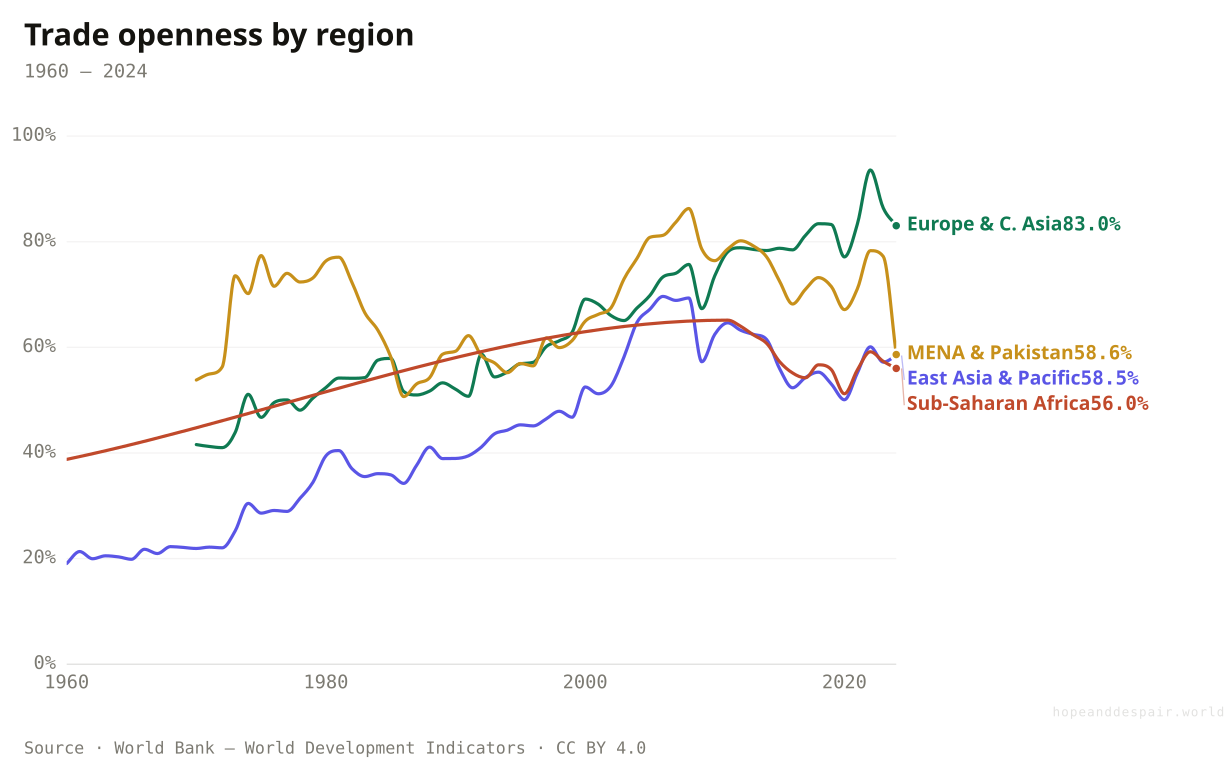
Trade openness tracks size and strategy, not just wealth. East Asia tripled its trade-to-GDP ratio as it became the world’s factory — from under 20% in 1960 to nearly 60% — while Europe’s tightly-knit economies run above 80%, each member trading heavily with its neighbours. Big, self-contained economies trade less as a share of themselves, which is why the world average sits well below its most open regions.
Trade as a share of GDP measures how open an economy is, not how rich or how well — which is why the ranking can mislead. Tiny, trade-built Singapore clears 300%, re-exporting far more than it makes; Vietnam, the world’s new factory floor, runs near 175%. The giants sit low for the opposite reason: the United States and China move enormous sums in absolute terms, but their vast internal markets leave trade at only a quarter to a third of output. Open is not the same as large, and neither is the same as fair.
Open trade was the engine of the greatest poverty reduction in history, especially across Asia.
Globalisation hollowed out industrial communities, and its retreat now raises the price of everything tradable.
The same integration that lifted Shenzhen emptied the rust belt — one process, opposite verdicts.
Demography
The population bomb defused itself — and left an aging, soon-shrinking world in its place.
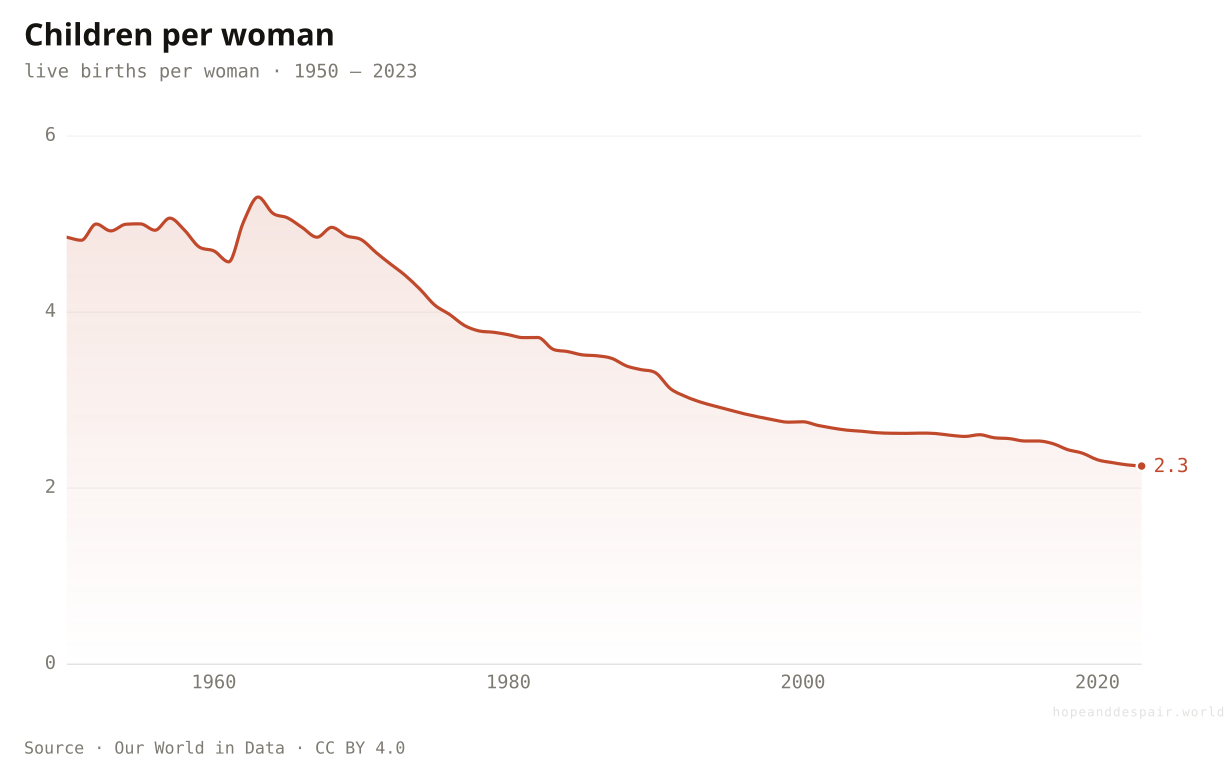
The average woman now has about half as many children as in 1950, and fertility has fallen below replacement across much of the planet. Humanity will likely peak this century, then decline — ever more old, ever fewer young.
The population bomb defused itself. The average woman bore nearly five children in 1950 and bears about 2.25 today — a hair above the level that holds a population steady, and still falling. It happened with almost no coercion: as children survived and women gained schooling and a say, families simply chose to be smaller.
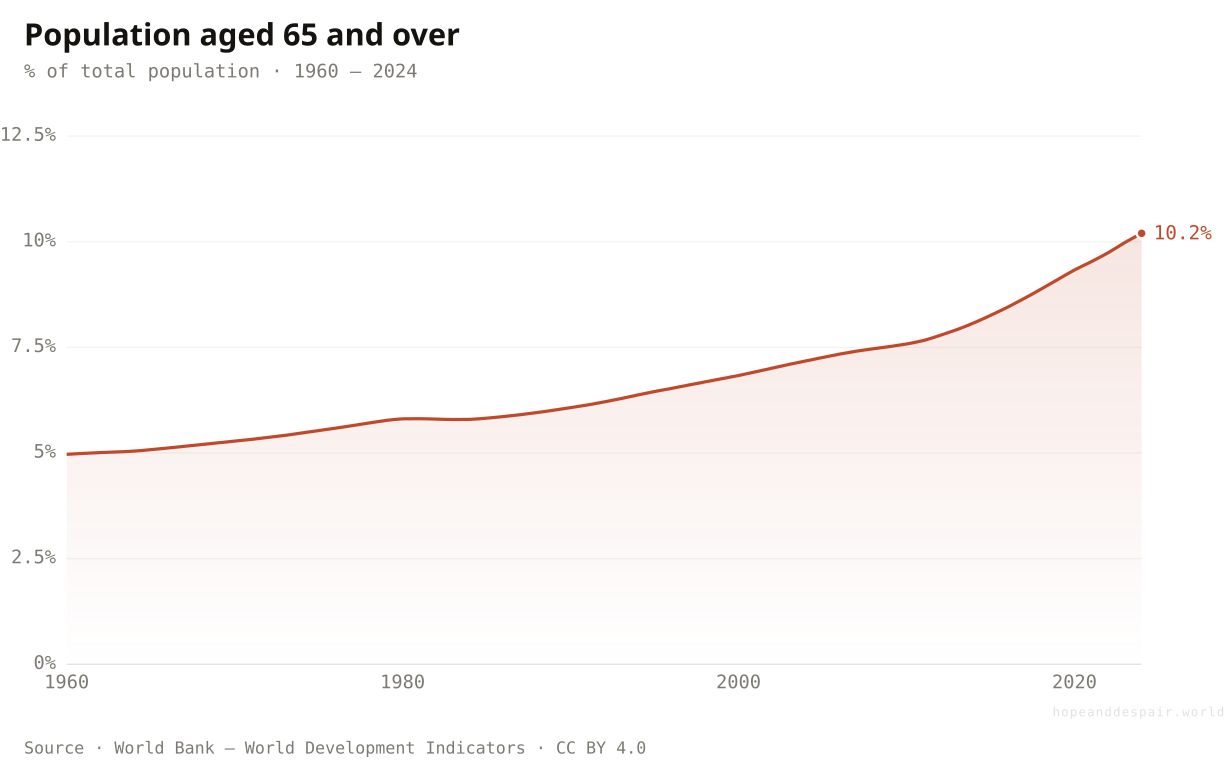
The flip side of fewer births: a world growing old. People over 65 were about 5% of humanity in 1960 and are over 10% now — a doubling — and the share rises fastest exactly where birth rates fell first, in Europe and East Asia. Fewer workers supporting more retirees is the central strain of the century’s second half.
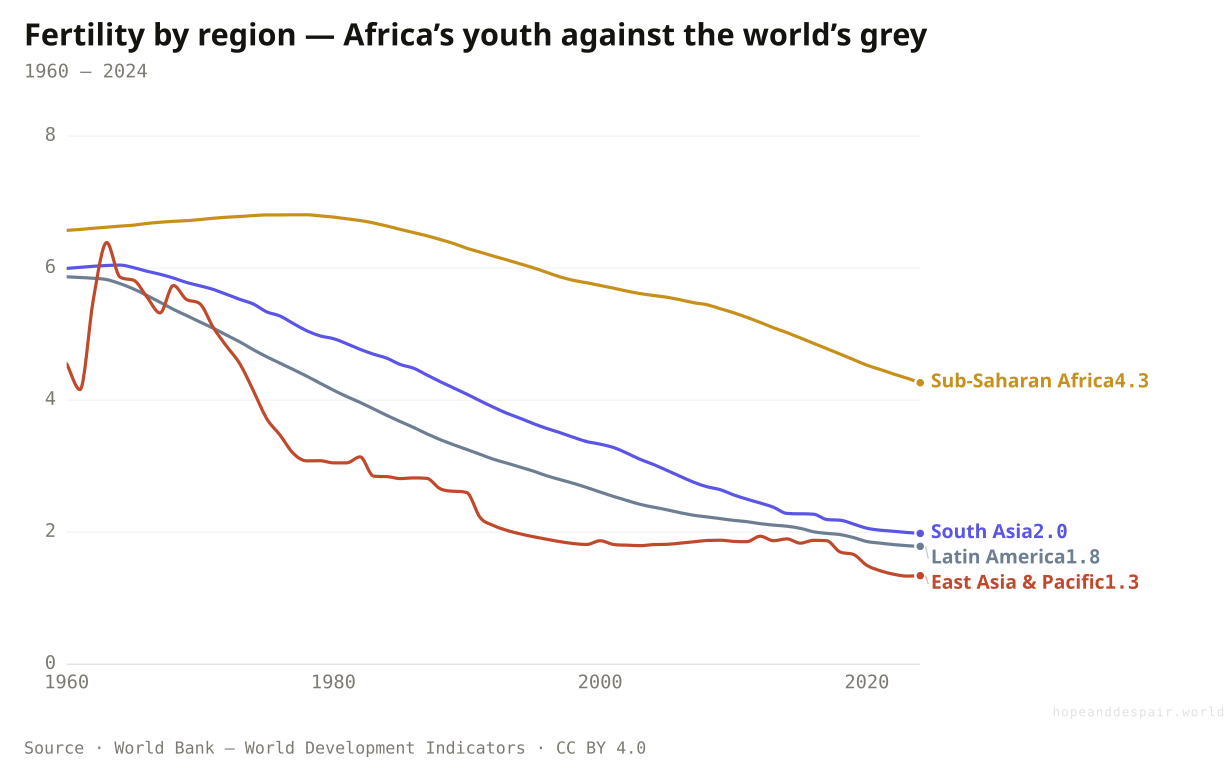
Two demographic worlds are pulling apart. East Asia and Latin America have dropped far below replacement — to about 1.3 and 1.8 children per woman — and face shrinking, greying populations, while Sub-Saharan Africa still averages over four and will supply most of this century’s population growth. The future is being born in very different places than the recent past was.
The world is splitting into two demographic futures, with replacement set at about 2.1 children per woman. At one end, Niger and DR Congo still average close to six — young, fast-growing populations that need schools and jobs faster than they can build them. At the other, South Korea has fallen to 0.75 and China to almost exactly one, a collapse that means each generation roughly halves the next. India has just slipped below replacement, to 1.96, quietly joining the shrinking half of humanity. Too many and too few are both real problems, and almost nowhere now sits at the steady middle.
Smaller families reflect women’s choices, lower child mortality, and lighter pressure on the planet.
Aging societies face shrinking workforces, strained pensions, and in places a real fear of depopulation.
A falling birth rate is a triumph of choice and a looming crisis of structure at the very same time.
Substance & addiction
The world’s deadliest legal habit is in retreat — even as new addictions rise to meet it.
Adult smoking has fallen by roughly a third since 2000, one of public health’s quiet victories. Alcohol use is broadly flat, while drug-overdose deaths climb in several rich countries — a despair the open global data captures only dimly.
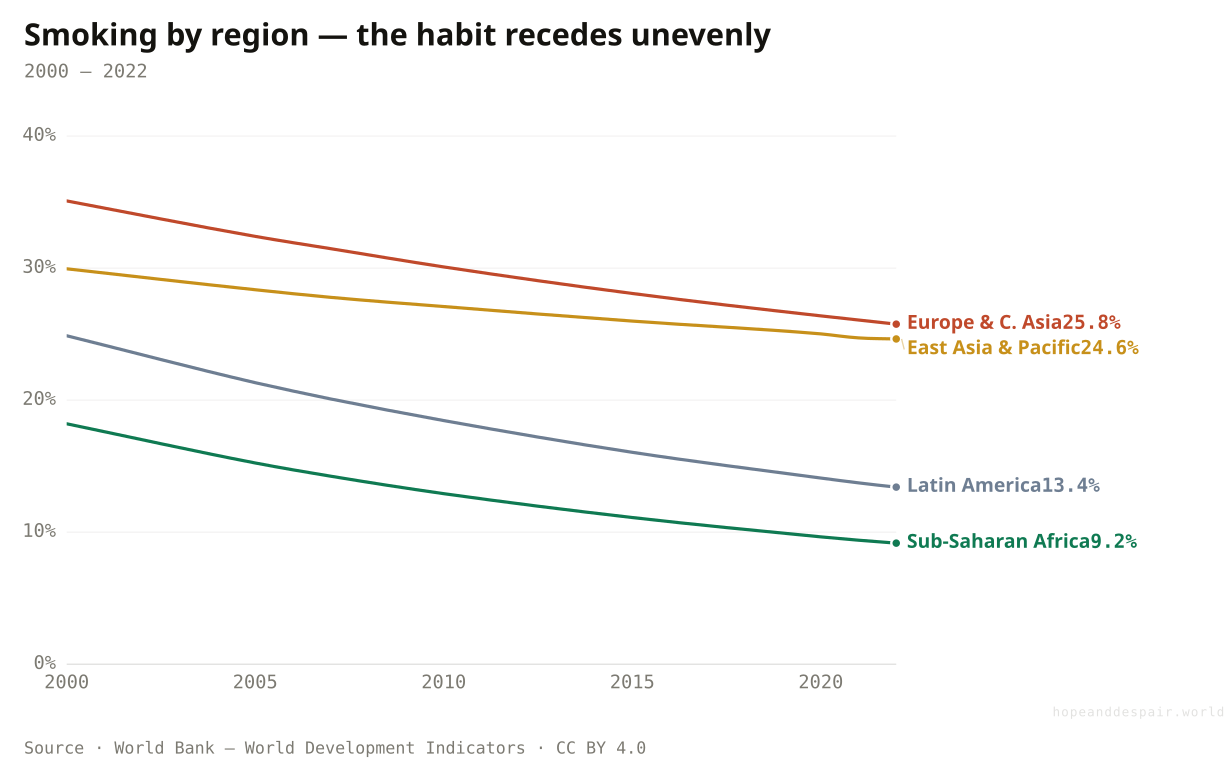
Public health’s slow, enormous victory. The share of adults who smoke fell from about 34% in 2000 to under 22% today, pushed down by taxes, advertising bans and plain packaging — the patient dismantling of a century-old habit. The cigarette is losing the rich world; the open question is the poorer countries where the tobacco industry now sells hardest.
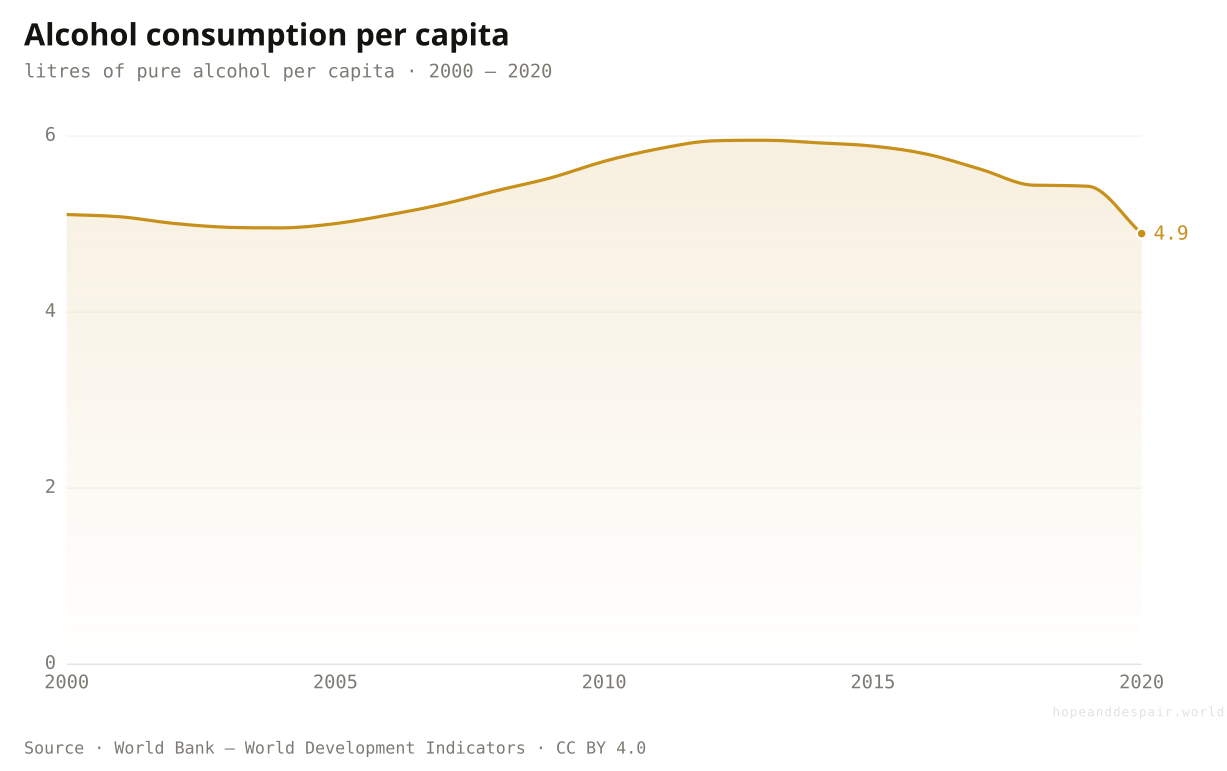
The other drug, holding roughly level. Global alcohol intake has barely changed this century — around 5 litres of pure alcohol per adult a year — but the steady average hides a split: drinking is falling across the rich world and rising in fast-growing middle-income countries. A flat line stitched from two opposite trends.
Falling everywhere, at wildly different speeds. Latin America and Sub-Saharan Africa have roughly halved their smoking rates since 2000 — Africa’s is now under 10%, the world’s lowest — while East Asia, home to around a third of the world’s smokers, has barely shifted, still near 25%. The habit is fading from the West faster than from the places it reached last.
Tobacco still kills more people than almost anything else on this page, and where it grips varies enormously. More than a third of adults use it in Indonesia and Greece; in Nigeria barely three in a hundred do, a rare case of Africa faring best. The single number folds together very different habits — India’s is heavy with chewed tobacco, China’s with cigarettes smoked overwhelmingly by men. Britain, which once led the epidemic at far higher rates, has pushed use down to 14%, proof the habit can be unlearned at scale.
Hundreds of millions have quit or never started smoking — a vast, slow-motion saving of lives.
Opioids and synthetic drugs are killing more people than ever in the places they hit hardest.
One addiction recedes as another advances; the net effect on human suffering is genuinely unclear.
you read
- This page reads twenty-odd dimensions at a glance. Each is a doorway, not the whole room — the deep article behind every one holds far more than the single verdict shown here.
- Every chart runs on real, openly-licensed data (Our World in Data, the World Bank, UCDP, Ember, OpenAlex, NASA, ILOSTAT), cited under each. Where a source forbids re-hosting, we link out rather than chart it — and where a whole domain is closed, we say so.
- Which cluster a dimension sits in — winning, losing, or both — is an editorial reading of its direction, not a computed score. Reasonable people would move a few.
We are winning the fights we have waged the longest, and losing the ones our own success began.— the one-sentence answer
Strongest case for hope
Take the long view and the verdict is not close. A child born today is far likelier to survive, to read, to be fed, to live in a democracy, and to die of old age than a child born in any previous century. Extreme poverty, child mortality, illiteracy, and famine — the ancient companions of human life — are all in retreat at once, and faster than ever before. Most of this happened within a single lifetime, which is why it feels less like progress than like the way things have always been.
Strongest case for despair
Stand closer and a different picture sharpens. The climate is destabilising and the living world is thinning out, both as direct consequences of the prosperity above. Democracy has retreated for fifteen years. Progress on poverty and hunger has stalled, even reversed, in the last decade. And the things people most fear — a home they cannot afford, a public square they cannot trust — are exactly the things this page could not measure, because no one measures them openly across the world.
The honest answer turns on one question the data cannot yet settle: are the fights we are losing the kind we can learn to win? Humanity has organised against death, scarcity, and disease for centuries and bent every curve. It has been organising against climate change and biodiversity loss for only decades, with far less to show. If the second set proves as tractable as the first, the optimists are right and this is the best moment yet to be alive. If it does not, the bill for our success is still coming due.
Everything done to the numbers between the source and the chart, disclosed in full. Where a choice is editorial rather than measured, we say so.
- What this is
- A hub. Each dimension shows a compact verdict drawn from real series; the full evidence, the regional detail, and the deeper caveats live in the dedicated article behind each one.
- The clusters
- Dimensions are grouped as winning, losing, or both by an editorial reading of their direction — not a computed index. The point is the pattern, not a precise ranking, and a few sit near a boundary.
- Licensing
- Only CC BY / CC0 / public-domain data is re-hosted with downloads. Restricted sources (some WHO and IHME series, UN-Habitat, survey attitudes) are cited and linked, never mirrored — and where a whole domain is closed, the page says so plainly.
- How it’s written
- The prose is LLM-assisted and disclosed; every quantitative claim traces to a derived series on this site, audited by hand against the data.
- Our World in Data — ourworldindata.org ↗ · CC BY 4.0 · vintage 2026-06
- World Bank Open Data — data.worldbank.org ↗ · CC BY 4.0 · vintage 2026-06
- Ember — Yearly Electricity Data — ember-energy.org ↗ · CC BY 4.0 · vintage 2026-06
- OpenAlex — openalex.org ↗ · CC0 1.0 · vintage 2026-06
- NASA GISS — GISTEMP v4 — data.giss.nasa.gov/gistemp ↗ · Public Domain · vintage 2026-06
- ILOSTAT — International Labour Organization — ilostat.ilo.org ↗ · CC BY 4.0 · vintage 2026-06
- Uppsala Conflict Data Program — ucdp.uu.se ↗ · CC BY 4.0 · vintage 2026-06
Cite this page
Reference
Hope & Despair. “Is the world getting better or worse?.” Hope & Despair, 2026. https://hopeanddespair.world/questions/is-the-world-getting-better-or-worse.
BibTeX
@misc{hopeanddespair:is-the-world-getting-better-or-worse,
  author       = {{Hope & Despair}},
  title        = {{Is the world getting better or worse?}},
  year         = {2026},
  howpublished = {\url{https://hopeanddespair.world/questions/is-the-world-getting-better-or-worse}},
  note         = {hopeanddespair.world, updated 2026-06-14}
}
Original prose, code, and chart designs are released under CC BY 4.0 ↗ — reuse freely with attribution. Source datasets keep their own licences, listed above. Add your access date when citing.
- Mobile-first chart system + redesign branch snapshot View diff →
Generated from the commit history — every edit to a number, a word, or a chart is tracked in the open. Browse the full history & diffs on GitHub →
in plain words
So, is the world getting better or worse?
Both, and not at random. Read the table top to bottom and a pattern shows through the noise.
The things getting better are the fights humanity has waged the longest: death, disease, hunger, poverty, illiteracy, everyday violence. We have organised against these for centuries, and it shows — a child born today has the best odds in the history of the species. The things getting worse are newer, and they are mostly the bill for that success: a heating climate and an emptying living world, both produced by the very scale and energy that beat scarcity, and a politics strained by the same forces.
So the optimist and the pessimist are not really arguing about the facts. They are reading different columns of one table. The optimist reads the rows we have fought longest and sees the greatest improvement in human history. The pessimist reads the consequences and sees a species outrunning its own wisdom. Both are looking at real numbers.
What the data cannot see. The most honest column on this page is the one we could not draw. The things people most fear about the modern world — that trust is dissolving, that truth is up for grabs, that a home is slipping out of reach, that we are lonelier than we were — are exactly the things no one measures openly, across the world and across time. Their absence here is not an oversight. It is the finding: the frontier of human worry has moved to where the data runs out.
Whether it all nets to hope or despair comes down to one open question. The fights we are winning, we learned to win. The fights we are losing are the ones we have only begun. If they prove as answerable as the old ones, this is the best moment to be alive. If they do not, it is the moment the bill came due. The data cannot tell you which — only make sure that whichever way you lean, you are leaning on something real.